
Data-Enhanced Design: Engaging Designers in Exploratory Sensemaking with Multimodal Data
Katerina Gorkovenko 1, Adam Jenkins 2, Kami Vaniea 3, and Dave Murray-Rust *,4,5
1 NatWest, UK
2 Kings College London, UK
3 University of Waterloo, Canada
4 Delft University of Technology, Delft, the Netherlands
5 University of Edinburgh, UK
Research in the wild can reveal human behaviors, contexts, and needs around products that are difficult to observe in the lab. Telemetry data from the use of physical products can help facilitate in the wild research, in particular by suggesting hypotheses that can be explored through machine learning models. This paper explores ways for designers without strong data skills to engage with multimodal data to develop a contextual understanding of product use. This study is framed around a lightweight version of a data enhanced design research process where multimodal telemetry data was captured by a GoPro camera attached to a bicycle. This was combined with the video data and conversation with the rider to carry out an exploratory sensemaking process and generate design research questions that could potentially be addressed through data capture, annotation, and machine learning. We identify a range of ways that designers could make use of the data for ideation and developing context through annotating and exploring the data. Participants used data and annotation practices to connect the micro and macro, spot interesting moments, and frame questions around an unfamiliar problem. The work follows the designers’ questions, methods, and explorations, both immediate concerns and speculations about working at larger scales with machine learning models. This points to the possibility of tools that help designers to engage with machine learning, not just for optimization and refinement, but for creative ideation in the early stages of design processes.
Keywords – Multimodal Data Annotation, Design Research, GoPro Data, Cycling.
Relevance to Design Practice – Working with data is increasingly important for designers. We articulate a design process that works between design ethnography, data analysis, and sensemaking that points to a fluid, exploratory practice for designers deriving design insight from complex data.
Citation: Gorkovenko, K., Jenkins, A., Vaniea, K., & Murray-Rust, D. (2023). Data-Enhanced design: Engaging designers in exploratory sensemaking with multimodal data. International Journal of Design, 17(3), 1-23. https://doi.org/10.57698/v17i3.01
Received July 11, 2023; Accepted December 1, 2023; Published December 31, 2023.
Copyright: © 2023 Gorkovenko, Jenkins, Vaniea, & Murray-Rust. Copyright for this article is retained by the authors, with first publication rights granted to the International Journal of Design. All journal content is open-accessed and allowed to be shared and adapted in accordance with the Creative Commons Attribution 4.0 International (CC BY 4.0) License.
*Corresponding Author: d.s.murray-rust@tudelft.nl
Katerina Gorkovenko is a Senior UX researcher with NatWest Group. She uses interviews, contextual inquiry, usability testing, and other design methods to understand how people relate to digital and physical products. She carries out research at the intersection of technology, design, and social science.
Adam Jenkins is a postdoctoral researcher at Kings College London working on human factors and security. His work centers on understanding the way that people relate to security concerns, through understanding responses to phishing, patching, and other behaviors. He has a mission to understand people in order to create software that better serves their lives.
Kami Vaniea is an Associate Professor at the University of Waterloo’s Department of Electrical and Computer Engineering (ECE). Her research interests are in the human factors of security and privacy. The goal of her work is to make security and privacy technologies more accessible for a wide range of users including end users, developers, and system administrators. Her recent projects include: developer-centered privacy, dynamic phishing advice, smart speaker bystander privacy, understanding barriers to software update installation, and people’s misunderstanding of Twitter’s privacy settings.
Dave Murray-Rust is an Associate Professor in Human-Algorithm Interaction Design at the Faculty of Industrial Design Engineering. He explores the messy terrain between people, data, algorithms, and things through a combination of making and thinking to build better futures for humans and AI. His work centers on systems that use data as a medium for design while exploring social and technical issues and the agencies between humans and machines. He also holds an Honorary Fellowship with the University of Edinburgh.
Introduction
One of the challenges of carrying out design research is getting right into the moment where interesting things happen. There is a constant tension between disrupting what is happening and getting good insight. One way through this is to instrument objects so that they create telemetry data (Gorkovenko et al., 2019) to support contextual enquiry—this creates a picture of what has happened that can guide researchers to interesting insights. These kinds of in the wild research methods are particularly valuable for design because they capture behaviors that may not be observed in lab studies. Research suggests that sensor data from physical product use can be used in a similar way to analytics in data-driven product design (Gorkovenko et al., 2020) or data-enabled design (van Kollenburg & Bogers, 2019), where data from product use in the wild can inform design cycles.
The connection between data, activity, and the design of artefacts is particularly interesting given the possibilities around machine learning to create models that can scale up the amount of time and activity that can be engaged with. In fields such as learning analytics, the potential of machine learning to process data and expand the gaze of learning practitioners has been developed over the last decade (e.g., Gasevic et al., 2014); mining activity patterns around collaboration can help to design better ways to work together (Martinez-Maldonado et al., 2019) and so on. Beyond optimization, however, there is the possibility to bring data into the fuzzy front end of design (Sanders & Stappers, 2008)—the part of the design process where the nature and scope of what is being designed is still being determined. The adoption of data-enabled practices—especially around Research through Design (RtD) methodologies—can change the nature of the relations between designer and end user, with more opportunities for co-creation throughout the design and deployment processes (Giaccardi, 2019). Having a closed loop between activity and function gives more agency to the things under design, and allows for continual feedback around user needs.
Early stage product design—the fuzzy front end—poses a different set of questions to optimizing well understood situations. Here, the objects and behaviors of interest are less well defined, emerging in concert with the development of product identity and capabilities (Frauenberger, 2020). Modern design practices around co-design see roles shift between designers, researchers, and users (Sanders & Stappers, 2008), as we move towards spaces where end users are collectively dreaming their designs (Sanders & Stappers, 2014) and objects redesign themselves through the data they relate to (Speed & Oberlander, 2016). Practically, digitally oriented design teams may contain a range of roles—user experience (UX) researchers, UX designers, service designers, machine learning experts—all of whom might have a unique understanding of the data coming in and its usage context. Key questions remain in how such data may be used to understand human behavior and generate design insight, while maintaining an appropriate level of trust, confidence, and criticality.
There is a rich world of data use within and beyond the design process, across from the direct functioning of products and the creation of data-driven product ecosystems out to broad contextual understanding of human behavior. In this study, we are concerned with design researchers who want to engage with data with minimal support, in a fast and lightweight manner. As such, we are interested in the strategies and relationships that designers develop when provided with the data traces that can be quickly and economically extracted from an arbitrary physical object. We are interested in findings that can support the creation of tools for designerly investigation based on multimodal data, and in particular the possibilities it gives them for thinking both about product function and the wider relations between users, products, and society.
This paper primarily covers the ways designers think about the possibilities of data, and how they approach a first engagement with the possibilities of a data-enabled design process. It is also oriented towards thinking about the opportunities for engagement with machine learning and related techniques. Designing with AI and machine learning systems can be complex, demanding multiple literacies and practices, with uncertainty around capabilities and outputs (Yang et al., 2020). Indeed, uncertainty itself is a key feature to engage with when designing with machine learning (Benjamin et al., 2021). In the study, we use purposefully simple and easily obtainable data collection and analysis methods, in order to reduce wow effects, and encourage a pragmatic yet exploratory approach to working with the possibilities of machine learning. This goes in two directions. Firstly, the camera used has a simple model of scene classification, which gives probabilistic outputs, providing a basis for discussing the use of uncertain outputs. Secondly, the discussion of making use of data was oriented towards questions of where creating a machine learning model of particular phenomena might play a part in a design process.
The study consists of one-on-one online data exploration and co-design sessions with 20 researchers, designers, developers, and engineers. Participants were individually presented with a small set of telemetry data including acceleration, speed, GPS, and scene recognition collected from a GoPro camera. This data was collected from a bicycle in use, and the analysis used a combination of the telemetry data, the captured video data, and the opportunity to ask questions of the rider. Through exploring the data, participants were asked to generate research questions, hypotheses, and interpretations that would build on machine learning analysis of data, and that could lead to improvement of existing products or ideas for new products and services.
Key Contributions
Through analysis of the collected material, this paper makes the following contributions:
- We provide an overview of the strategies and techniques that designers without particular data expertise use when engaging with multimodal data, and show that data can be used for design ideation as well as optimization.
- We develop the idea of trajectories of fluid investigation, where designers move from one domain to another driven by observable features and hypotheses, relating quantitative data to human experience; we show multiple starting points and directions to these investigations, pointing to the need for flexible and lightweight tools.
- We show that annotation is a key designerly practice for engaging with data and the world, in order to bring in familiar practices and to keep the data for design exploration contextualized.
- When engaging with the possibility of machine learning, we show that simple analysis can go a long way, as many questions raised can be answered with simple models, that clustering and novelty are ideas that designers can easily reach for, and that there is the possibility for a natural engagement with uncertainty.
Our work contributes a picture of the opportunities for telemetry data for early stage design research identified by researchers and designers as well as an indication of how this use can connect with the use of machine learning for new forms of design practice.
Background
This paper is concerned with ways of supporting design research practice with data—in particular, through the annotation of multimodal data. The starting point is design ethnography (Salvador et al., 1999)—that is, the use of ethnographic practices that seek to understand human behavior as an adjunct to the design process, producing knowledge that aids the refinement and re-conceptualization of designs. To give context, we first outline the broad connections between digital data and design processes, before unpacking the current state of the art in data-driven and data-enabled design (DDD, DED). We then contextualize our work by mapping out related fields and concepts within design. There are multiple ways in which data is entangled in the development of products and understanding the many relations between products and humans. While DDD is central to this work, we map out some related fields of practice to help differentiate and situate this work (Figure 1). These have been roughly placed on a spectrum according to how intimately they are part of a product’s functioning—for smart or data-driven products, their operation is based on the streams of data coming in and out; for more ethnographic practices, data of various kinds is used to understand either the relations between humans and products or wider social relations, whether or not the products actually make use of data. Finally, we touch on broader sensemaking and data annotation practices for working with multimodal data.
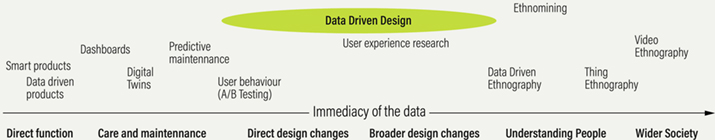
Figure 1. A spectrum of related practices based on how closely the data in question is made use of by the objects of inquiry. At one end, smart products require data flows for their existence; in the middle, data is used to support the optimization and creation of products; and towards the right, data is used as a window into user or societal relations.
Overview of Digital Data and Design
While design processes are typically entangled with data, whether checking assumptions, assessing function and quality, or showing limitations and opportunities, the rise of digital data and data science practices talk about data in a manner distinct from the qualitative, experiential, empirical work traditionally carried out by designers. Sensor data and telemetry captured during the operation of systems support in the wild approaches (Chamberlain et al., 2012) to understand interactions outside the lab. Smart products, and more broadly human-data interaction paradigms (Mortier et al., 2014), alter the way that products and objects function, requiring designers to develop new ways as they create data-enabled artefacts—see the transition in Speed et al.’s ablative framework as an example of how the traditional approach of designing products from research data moves to designing with data as a design material (Speed & Oberlander, 2016). Designers have the potential to draw from the torrents of big data from sensor systems as well as the thick data produced by ethnographic practices (Smets & Lievens, 2018; Storey, 2016).
Digital data has been deeply intertwined with the development of digital products and services: it is relatively easy to instrument software systems to collect a range of usage data, and the creators of those systems are generally fluent in digital technology. However, data can also be collected around physical products and systems, as we are concerned with here. This collection requires both the addition of sensing hardware to the physical device, and often a change in culture for the system creators. There are many different ways to make use of digital data around physical products, ranging from being an active part of the product’s function—a smart thermostat that responds to user presence, or a Segway balancing based on gyroscopic data streams—through to practices that use data to directly change the design of systems, such as A/B testing or stress modelling, to ways of understanding the human and social contexts around the use of products. While this paper focuses on the more creative and exploratory end of data use, we briefly present some of the important practices around digital data use.
Data Driven/Enabled Design
This project is situated within the area for Data Driven Design, or Data Enabled Design, where data is used as a resource at various stages of a design process. This is a relatively new field, with the bulk of papers published from 2017 onwards (Bertoni, 2020), as technology makes the practices of data collection and analysis easier and more accessible. Despite a journal special issue dedicated to the topic (Kim et al., 2017), there remains a lack of precise specification of the term (Zheng et al., 2020). Briard et al. (2021) synthesize key issues to frame challenges in DDD: there is a need for guidelines for how to carry out DDD; how to integrate data analysis into design practices; and in understanding what the particular strengths and weaknesses of DDD are. Bertoni (2020) highlights the uses of DDD in many stages of the design process, but in particular points out its use for concept development, where it can help to generate product concepts, explore design spaces, and identify customer needs. The emphasis on this last application implies a missed opportunity: where most applications have a single analyst look at social media and other existing data traces to identify latent customer needs, there is the possibility of using data as a more creative medium to collaboratively generate possibilities and explore the long tail of the design space (Gorkovenko et al., 2020).
In this vein, Kun et al. (2018a) build on techniques designed to improve data literacy to support Generative Data Explorations in order to stimulate the generation of new design ideas, often ideating through the process of exploring public datasets (Kun et al., 2019) or drawing on techniques from data science (Kun et al., 2018b). Seidelin et al. (2020a) explore the possibilities of co-design, where the agency of data helps shape collaborations.
Data Enabled Design (DED) (Bourgeois & Kleinsmann, 2023) extends to the use of data in co-design contexts, and to understanding the data collection process as a design activity in its own right (Feinberg, 2017; Seidelin et al., 2020b; van Kollenburg & Bogers, 2019). Bogers’ and van Kollenburg’s work propose a comprehensive data-enabled design methodology that follows a joined pair of loops: a design research loop turning insights into contexts, syntheses, and explorations with data, and an everyday life loop that collects data, generates prototypes, and adapts them remotely (Bogers et al., 2016; van Kollenburg & Bogers, 2019). Similarly, Gorkovenko et al. look at carrying out design processes around data collected from objects in the wild, where the data is used both as a source for ideation and in support of further product development (Gorkovenko et al., 2019; Gorkovenko et al., 2020). Data is used as a support for contextual enquiry, following an entangled ethnography approach (Murray-Rust et al., 2019) to build up an understanding of rich contexts from both the human and thing perspectives (Giaccardi et al., 2016). This study extends these foundations, looking at what practices could emerge and what competencies would be at play within these kinds of entangled, data-enabled design explorations.
Data in Product Operation and Design
Here, we look at the ways that data relates to the functioning and immediate design of products, with varying levels of connectedness.
- Data Driven Products: At the most deeply connected end of the scale, designers have to work with increasingly data-driven products. As an example, the Hovding helmet (Abrahams, 2019) uses 2000 hours of collected data with 3000 staged accidents to determine whether a rider is in an accident or not; self-driving cars are built on analysis and use of large corpora of real world data (Tomei et al., 2019) to decide how to function (Edu et al., 2020). Strategies for designing these kinds of products are emerging (Wolff et al., 2018) through ways to prototype smart devices (Houben et al., 2016), relate data to end users (Yarosh & Zave, 2017), develop context (Bogers et al., 2016), manage the transactional complexity of data interactions (Pschetz et al., 2017), and using data to effect behavioral change (Bourgeois et al., 2014).
- Data Supported Operation: Data can also contribute indirectly to the operation of a product or service through predictive maintenance, as data collection is used to build a model of likely component failures. This approach has typically been applied to high-end systems such as aircraft engines (Austin et al., 2004), with increasing recognition of both the role of human data interaction (Daily & Peterson, 2017) and expansion to other fields such as medical devices (Sipos et al., 2014).
- Digital Twins: Grieves and Vickers (2014; Grieves & Vickers, 2017) take the predictive models of failure and go further to include complete simulations of the physical object. These parallel simulations can help to understand and ameliorate complex behavioral events, but have also been gaining traction as a resource for design (Tao et al., 2019), and part of design frameworks that support production and manufacture (Tao et al., 2019). Alongside data-driven products, digital twins can increase the level of provenance kept about the physical aspects of the objects as well as providing a resource for thinking about and redesigning them (Burnett et al., 2019).
- A/B Testing: The use of quantitative data gathered from user engagement with products in the wild is seen in software design, where A/B testing (Kohavi et al., 2013) emerged through the development of web based platforms as a way to carry out experiments in support of design decisions. In 2015, LinkedIn ran 400 simultaneous experiments to determine which interface changes led to better engagement (Xu et al., 2015). The malleability of software products allows a rapid exploration of design spaces (Kohavi et al., 2014), and builds the idea that small incremental changes can be better optimized through empirical data than designer insight (Kohavi et al., 2009). While effective, there are calls to ensure that practices are in place to avoid over-reliance on data, and to ensure that it is not seen as the only source of knowledge (Liikkanen, 2017).
- Telemetry Driven Design Processes: A/B testing approaches are often enabled by the collection of extensive user telemetry—for example, users’ clicks on a website. This viewpoint opens up many possibilities for working with data, such as using clickstreams to create user personas (Zhang et al., 2016), optimizing the design of interfaces (Lomas et al., 2016), or breaking down complex personalization based on the choices of many other users (Bahirat et al., 2018). More generally, it opens the possibility of interaction mining—looking for common patterns of interaction and flows in the traces of activity (Deka et al., 2016). In the gaming industry, it is possible to capture the trajectories of users’ characters through a game-world, visualizing common behaviors and moments of difficulty (Wallner et al., 2014), and developing analytics and clustering approaches to interrogating these datasets (Drachen & Schubert, 2013). Moving towards human experience, galvanic skin response (GSR) sensors and other biometrics can be used to give insight into people’s gaming experience (Robinson et al., 2016), cognitive load (Nourbakhsh et al., 2017), or mobile app use (Yao et al., 2014).
Ethnographic Practices with Data
On the right hand side of Figure 1, methods shift from directly supporting the design and operation of products into supporting understanding of humans, their practices and relationships. While this may indirectly support product design and function, the immediate knowledge is about human experiences.
- Data Driven Ethnography uses data for ethnographic practices to create understanding as well as the optimization oriented approaches above. Ethnomining looks at data as co(a)gents to assist the researcher in deconstructing the phenomenon being studied in collaborative interpretation interviews with participants (Anderson et al., 2009), using log traces as a viewpoint to understand human behavior (Churchill, 2017). Particularly as humans move through connected systems, a multi-dimensional synthesis of various streams of data can emphasize the assemblages that constitute our lives, interweaving digital, embodied, and internal experiences (Haines, 2017). Working with computational techniques helps not just to scale up qualitative research, but also to build context for a range of inquiries (Evans, 2016).
- Trace Data: the records left, consciously or unconsciously, as humans navigate digital worlds are of particular interest in the ethnographic process (Dubois & Ford, 2015). Alongside traditional experience sample or diary studies, data that records traces of activity can provide a rich post-hoc viewpoint for uncovering participant experiences. Viewing visualizations of activity can help to trigger memory (Bhavnani et al., 2017), and trace interviews are a way to focus on individual actors as they navigate complex digital environments—for instance, using editing records to ask Wikipedia editors about their process in responding to unfolding events (Dubois & Ford, 2015). Sensory postcards (Droumeva, 2015) create snapshots of experiences, using mobile phone capture, but avoiding the narrative viewpoint of video.
- Video Ethnography uses video capture as the main ethnographic material, rather than data traces. This is a powerful technique, as it can capture a wealth of contextual information which can then be very closely read. It helps to develop rich and detailed pictures of social situations, and has been used with cyclists (Pink et al., 2017; Spinney, 2011) and other forms of mobility (Tuncer et al., 2020). While this is not data-driven in the sense of telemetry or sensor data, it is still a digitally driven practice for gaining insight into human relations.
- Thing Ethnography enlists things of various sorts into the ethnographic process. This can mean attaching sensors to the objects to experience their viewpoint (Giaccardi et al., 2016, 2020), even in extensive urban contexts (Chang et al., 2017). The same agential object, from an ethnographic viewpoint, can reveal human behaviors around data (Pschetz et al., 2017), but also human social practices (Tallyn et al., 2018). Bringing together data and a consideration for non-human things leads to an understanding of the constellations surrounding the creation and use of products (Coulton & Lindley, 2019), and an understanding of the entanglements throughout design and use (Murray-Rust et al., 2019). This is captured by projects such as the Thing Constellation Visualizer (Huang et al., 2021) that constructs constellations of the social relations of objects based on their co-occurrences in photographs.
Sensemaking and Annotation of Data
As well as ethnographic practice, there is the more general question of how humans collaborate and make sense of data. Here, two general areas are of interest—sensemaking and annotation.
Sensemaking
The practices of inspecting data, engaging with its content, and placing that data in relation to broader contexts (Koesten et al., 2021) is part of a vision that developing meaningful representations from data facilitates insights and intelligent action (Russell et al., 1993) whether individual or collective (Pirolli & Russell, 2011).
Within extended design practice, sensemaking goes beyond traditional engagement. Gaver et al.’s (2016) DataCatcher includes experiential capture and translation of data; Fischer et al. (2017) look at collaboratively carrying out the data work to make shared data accountable; and Romat et al. (2019) bring in annotation to articulate and explore hypotheses in a natural manner. These point to an array of approaches and viewpoints for designers to engage with data in their design process, from immediate use to contextual understanding, from monitoring the physical world to shaping the digital.
Multimodal Data Annotation
Annotating data with human interpretations can help to create links between various parts of a complex dataset in a human understandable manner. This can be at the level of an entire design process—for example, Chandrasegaran (2016) looks at creating tools for creative ideation, using annotations on sketches as a window into the unfolding process. At a lower level, fields such as learning analytics make increasing use of video annotation (Evi-Colombo et al., 2020). For example, Di Mitri et al. (2019) introduce the Visual Inspection Tool (VIT) that helps to understand people’s learning experiences through annotating multimodal data. They also reference several related tools that help users to annotate data streams based on synchronized video streams for social signals (Wagner et al., 2013), time series (Kothe et al., 2018), or geographic data (Kothe et al., 2018). In linguistics, special purpose tools are becoming more common to make use of combined audio and video data (Cassidy & Schmidt, 2017). More recently, MotionNotes by Rodrigues et al. is designed to help users add annotations to video footage in order to augment educational and cultural content—for example, adding performance notes to video capture dance performance (Rodrigues et al., 2022); Badam’s FacetNotes gives ways to use annotation to explore connections in multimodal data such as complex information about flight status or geospatial crime statistics (Badam et al., 2022). All of these techniques help to add human understanding to the data that has been collected, but in general put less emphasis on techniques that support creative ideation around multimodal data streams.
Research Framing
Within the space set out in Figure 1, the study starts with data collection, both video and telemetry, about the use of a non-smart product. It explores how, in the early stage of a design process, annotation and sensemaking around this data can be used for ideation and suggestions for improvement. We draw particularly from ideas in thing ethnography, looking at trace data collected around everyday practice, to investigate relations between the user and the product in support of open-ended re-design.
Method
To investigate how designers and researchers would approach utilizing telemetry data within a design research process we collected video and telemetry data from a camera attached to a bicycle, visualized it, and placed the visualizations and videos on an online whiteboard. The data was used as a prompt with 20 designers and researchers who explored it in a series of one-on-one sessions. We were particularly interested in the types of research questions they generated, how they made sense of it, what value they saw in the data, and what further investigations they were able to come up with. The aim was not for the researchers and designers to analyze in depth the data they were presented, but instead to use it as a starting point in considering what and how they might be able to investigate with off-the-shelf data collection and visualization tools, and speculate on the possibility of answering questions through machine learning.
The study was conducted during the height of the COVID 19 lockdown in the United Kingdom, and throughout we took great care to eliminate the need for in person work or exchange of physical materials. Ethics approval was sought and granted through our internal research panel before any data collection was conducted with participants.
Bicycle Data Collection
We chose a bicycle as the use case study for the research primarily due to the fit between the data that could be captured using off-the-shelf hardware, and a sense it would inspire questions around product usage. A GoPro Hero 8 camera was used to capture accelerometer, gyroscope, GPS, speed, ISO, orientation, and audio levels, encoded in MP4 files alongside video footage. It also includes a probabilistic ‘scene classification’ tag that uses a model to classify the video feed with a probability of belonging to six classes: SNOW, URBAn, INDOor, WATR, VEGEtation, BEACh (see https://gopro.github.io/gpmf-parser/ for a full discussion of features available). The dataset was generated by the lead researcher using a bicycle with the camera attached to the handlebars. This was felt to provide the participants with a rich source of contextual insight, with data that directly relates the performance of the product, such as its vibration and steering, while including nascent machine learning labelling capabilities. The data collected was extracted and visualized using a GoPro Telemetry extractor available online (https://goprotelemetryextractor.com/free/) and displayed as line graphs and a map.
The lead researcher conducted two, nearly identical, 5-minute cycles through a park at noon and again at 7 p.m. During both cycles the researcher cycled on a paved road, a bike path, a mud track, and through grass. The setup was intended to provide participants with a range of data about activities and variations while also keeping the time frame short enough so that details are still visible within the data visualizations.
Recruitment
The focus of the research was in understanding the value of telemetry and video data for design research. We therefore aimed to include a diverse range of disciplines related to design, including product designers, HCI researchers, service designers, design researchers, ethnographers, and even those with software engineering backgrounds. All of these roles may use such data to generate knowledge and insight that might feed onto the design process within their day jobs.
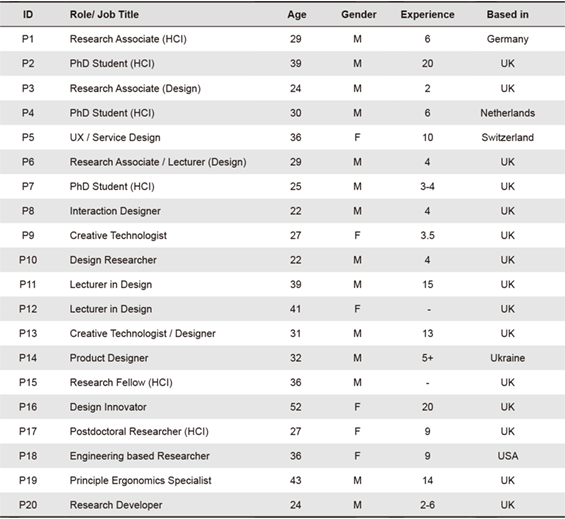
A total of 20 participants were recruited through Twitter and relevant design-related LinkedIn groups, with snowball sampling and participant referrals (Table 1). All participants were reimbursed with a £20 Amazon gift voucher.
Table 1. Participant demographics, showing current role, age, gender, years of experience within the field of design, and current country of residence.
Procedure
The study was composed of a series of one-on-one remote online data exploration sessions with each session lasting 1hr 51 min on average with the longest session lasting 2 hr 11 min. The study was conducted using a video conferencing tool and the online whiteboard Miro (https://miro.com/). The calls were recorded and transcribed.
All interviews were conducted by the lead researcher. Since the lead researcher was also the subject of the video and data collection, they were able to answer questions about their subjective experience relating to the data. For clarity, in the text, they will be referred to as subject when in this role. The participants could ask the subject about the terrain and context that may not have been apparent from the video.
The overarching task of the participants was to speculate about design research questions (DRQs). We were interested in understanding how participants went about formulating DRQs and speculating on ways to answer them, as well as how they developed a critical perspective on the limits and possibilities of the dataset and the self-reported experiences of the researcher.
The data exploration tasks were conducted on a Miro board composed of six different frames arranged vertically:
- Introduction to the research aim of the study. Participants were asked to explore if they could develop design research investigations, which could be supported through telemetry data gathering. The data was used as an example of what could be collected in their own research.
- Training, introducing the participants to the functions of Miro.
- Details of the bike itself, including six images of the bike and its components, such as the front tyre, back tyre, GoPro mounting, chain, and a view of the left and right side of the bike. Next to the bike images were nine sticky notes where design research questions could be written. These questions were intended as an initial brainstorming exercise.
- The two videos of the day and evening cycles. After watching the videos and having a look at the types of data that was visualized, each participant was asked to write two DRQs to investigate further. They were then told that we did not expect them to answer their questions; instead they should aim to develop hypotheses around their process for answering them.
- All of the telemetry data visualizations which were extracted from the MP4 files. The day and evening cycle runs were placed beside each other. Visualizations included: GPS map with speed and elevation; Acceleration data line graph; Gyroscope data line graph; Speed in m/s line graph; Scene classification line graph, including classifications of vegetation, indoor, urban, snow, water, and beach; Image uniformity line graph; Audio levels line graph; Camera orientation line graph; and ISO level line graph.
- A space for the participants to reflect on the potential for telemetry data to be used within design research.
Some examples of participants’ responses to the data exploration can be seen in the Appendix (Figures 6-8). The lead researcher took an active part in the data exploration process. They encouraged participants to annotate the data visualizations with notes and keywords to identify moments they found interesting and to ask questions about the experience and context of riding the bike.
Analysis
The lead researcher used thematic analysis (Braun & Clarke, 2006) to inductively code the transcripts in Nvivo (https://www.qsrinternational.com). This initial set of codes was then exported into a Miro board together with quotes from the transcripts. Two researchers conducted an affinity mapping session to cluster related codes and identify themes. As clusters began to settle, two more researchers joined the analysis process and engaged in discussion until a consensus was reached.
Results
Features of Interest
The participants’ brainstorming activities covered a diverse set of areas, including context of use, bike characteristics, the user experience of riding the bike, and the cyclist’s behavior. Questions regarding context investigated aspects of the weather, terrain, traffic, and infrastructure. Bike characteristics often focused on the potential of data to identify faults and suggest maintenance; for example, P17 asked “When does the chain guard become damaged?” User experience focused on confidence levels and safety; for example, P13 asked: “Can confidence be evaluated by looking at behavior before an event?” Cyclist behavior questions aimed to capture specific features of their skills, riding style, and actions. Questions also investigated potential relationships between themes; for example, P11 asked: “Does cycling on the pavement impact your confidence?”, combining context and behavior.
Participants’ final research questions and scope were guided by their interaction with the data streams and apparent patterns, which implied underlying relationships worthy of further investigation. These relationships were articulated as correlations or cause and effect scenarios, such as the impact of cycling speed on rider confidence. Combining the data streams allowed the participants to begin to make inferences about less easily quantified features, such as road safety and user experience. For example, once P14 observed the researcher’s cycling technique caused the bike to swing left and right, they wondered if the data could allow them to “spot the drunk bikers.” Participants also questioned the researcher about their experience at different points in the rides, which helped ground investigations around user experience:
“So what I am interested in here is being able to tell if the amount of stability in the camera can [identify] what terrain you are on.” [P8]
Sense Making
To make sense of the data participants often cross referenced between the telemetry data visualizations and the video. Participants, including P10, P16, and P17, identified moments of interest within the videos first and then tried to find them within the visualized data. They found this practice helpful in delineating the data based on terrain—Figure 2 shows a participant’s investigation. They identified when the bell was rung, and then looked into whether the proximity of pedestrians had an effect on the rider’s speed. Meanwhile, P3, P4, P5, P7, P8, and P20 utilized the opposite approach, identifying quantitative data of interest—such as spikes in gyroscope or accelerometer (Figure 3)—and watching the video to understand what was happening at that moment.
“Potentially there’s one way of looking at it which is like looking at the video first then looking for events and trying to match them up but there’s also looking at the graphs and sort of like things that are happening and lining those up.” [P3]
The participants also asked the subject to self-report their experience at certain points in the ride, to draw connections to the quantitative data, e.g., P17 wanted to correlate the bumpiness of the terrain as seen in the gyroscope data with the confidence of the rider, shown in Figure 4.
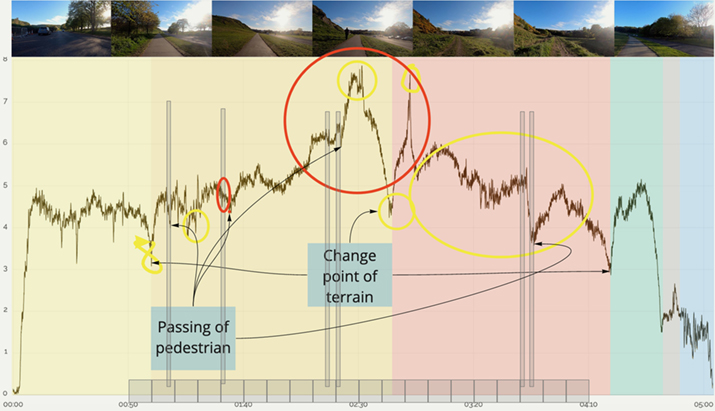
Figure 2. Graph of cyclist speed annotated by P10, showing events of particular interest identified within the video: indication of change of terrain and interaction with other path users, segmentation added to support analysis, and a hypothesis to investigate what was causing other changes.
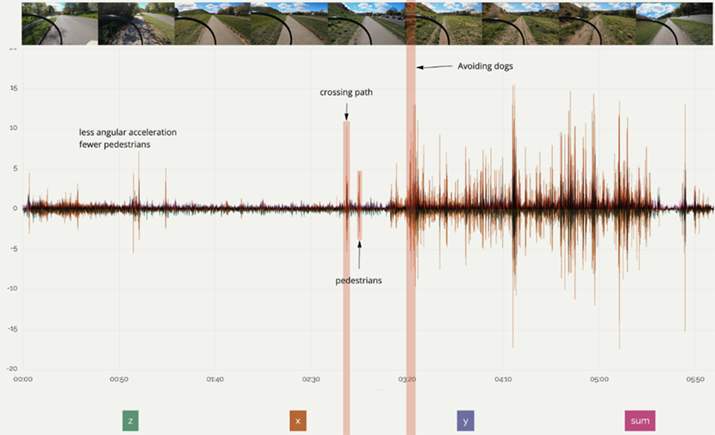
Figure 3. Gyroscope data annotated by P3, showing sections annotated based on observed events in the video (marked in red).
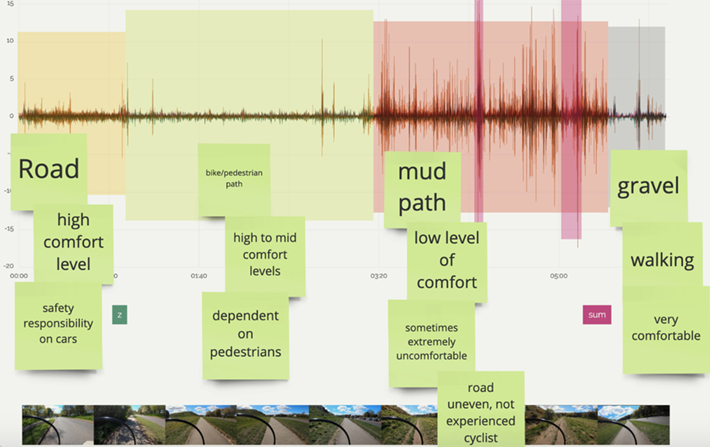
Figure 4. Graph of accelerometer data annotated by P17, showing segmentation of the ride based on visual inspection of the data traces and highlighting of particular events of interest. Qualitative annotations have been added to each segment based on elicitation from the video subject, to talk about physical features of the environment (surfaces), the immediate comfort level of the rider, and the social factors around the ride.
The participants reported that through exploring the data they aimed to challenge their assumptions about the meaning of the data. For example, P11 speculated that less wind resistance contributed to a faster evening cycle, but when exploring the graphs concluded that it “is not necessarily the wind, but the surface of the road” [P11], challenging their initial hypothesis. This process of making sense of the data often involved a discussion with the researcher about ways of reading the graphs, or contextualizing what was happening at each point from the researcher’s perspective on the bike ride:
“I think it would always be valuable to have this conversation with another person, so that you can have new point of views you can question yourself. Our conversation I think brought me to a different end point from where I started.” [P5]
Participants annotated visualizations with notes and highlighted areas using shapes to indicate terrain, hypotheses, user experience, points of interest, and maximum and minimum data points. To develop the relationship between datasets, participants marked moments of interest using shapes and aligned them vertically across the different datasets. Whenever events were identified, they were annotated with sticky notes. A single annotation could at times be connected to multiple points of interest in the data. At times the participants required assistance from the researcher in matching up moments from the video onto the data visualizations, such as when the researcher passed by pedestrians or there was a transition in the road surface. Most participants found the initial experience of looking at the diverse data streams overwhelming and difficult. However, they often concluded that through triangulation and further data gathering they would be able to challenge their assumptions and explore their hypotheses.
Research at Scale
The data was seen as a useful starting point for further qualitative and quantitative research studies. Participants speculated on additional data streams they would require to gain more insight of the context. They also felt a need for a more accurate representation of the lived experiences of a cyclist.
Participants designed potential studies with: multiple bikes but a single rider to understand how different bikes perform compared to each other [P13]; multiple riders with a single bike to investigate different riding styles or personas [P12, P13, P14, P15, P17, P18, P19]; rides with variations in bike components and settings to identify how to optimize a bike’s performance [P6, P13, P18]. Participants identified that they require large amounts of telemetry data collection over extended periods of time—P3 was interested in a large-scale performance analysis: “if you have 10000 people at some point patterns start to emerge right, because you decrease the individual variance in different [cyclist] levels but you start to identify patterns.”
Investigations around the cyclist’s behavior were imagined to be researched through research methods familiar to the participants. Diary studies, contextual inquiry, and experience sampling could utilize telemetry data, while not being completely reliant on it. P4 felt there is potential to allow participants to annotate the data they generate themselves “for more qualitative insights on what happened then and then, perhaps even have some kind of communication channel between researchers and users, maybe even during activities.”
Ultimately, the participants felt that a data-driven research process would be an interdisciplinary task, requiring “designers and engineers and computer scientists to have a look and make sense out of it” [P1]. Participant 18, an engineering researcher, provided an in-depth description of their research process to investigate how confidence relates to the motion of the bike:
“I would ask people to ride this path initially whether or not it was their usual path if they fit into the [user] group. So it would be some sort of like research uh activity where they do the data collection and then we come in and we have a conversation about cycling in general and then getting down to the topic of confidence and then maybe looking over the video stream and like indexing moments where they believed that confidence was an issue. [...] I would need to decide how many riders and how many rides are going to be enough information. [...] How much data would we need to know that the detection of these moments is not by chance. [...] It would really be in conversation with uh the person that’s going to manage this algorithm who probably won’t be me.” [P18]
Computer Supported Sense Making
The process of analysis, although educational, proved difficult for many of the participants, leading many to imagine how visualization tools for design research should support them in making sense of the data. Some participants, like P2, P3, and P13, felt the line graphs were too abstract and disconnected from the activity of riding a bike. It forced them to think about the context of the product and user in a manner unfamiliar to themselves, with a participant stating:
“... honestly I was thinking of this as like maybe I’m missing something that’s really interesting and it’s just a lack of a certain sort of technical literacy that is [causing] me to miss data that’s in plain sight... expertise on certain signals in the data [is needed] and relying on those with true expertise to kind of check my work.” [P18]
The participants felt that the data visualizations need to be made more accessible. They saw opportunities to overlay graphs onto the video, “on top of each other” [P3], use more familiar speedometers, and allow for interactive features, such as being able to place a marker within the video which then appears in other visualizations. For spatially bound data, such as the camera orientation, P19 imagined “a visualization of the bike in 3D.”
Data-driven design tools could be made more accessible through computer aided analysis. Participants expressed an interest in seeing further statistical information overlaid onto the graphs, such as value ranges and the mean of a range of data, which could help them understand the quantitative data. P17 explained she wanted to see “some sort of calculation to show you average speed on that terrain, [...] it should help you with figuring out the math of it and pointing out [data] errors.”
The graphs from the scene classification model generated discussions around how machine learning (ML) can be incorporated into a research process. Participants, such as P1, found that ML can help automate the detection of people, cars, dogs, and other cyclists nearby, which could be helpful in aiding the researcher in identifying moments of interest. Meanwhile, P13 speculated that after building a training dataset, it can be continuously expanded and tested in order to identify data events of interest. Automating the highlighting of the data could help the design researcher save time and focus their investigation: “It could condense the footage to the moments I really want to see” [P3]. Filtering the data would require the researcher to set up queries based on predefined parameters: “Show me this and this set of data every time I decelerate” [P1].
“I think automating some of the highlighting moments for then a person to go in and look because the first thing that I would want to do is scrub through the video and place a little marker about all the interesting things I’m interested in [...] That’s just a visual reference for me to then go and look at see what’s happening with the line.” [P3]
Barriers and Concerns
When discussing privacy and ethics, participants were concerned about the implications of utilizing such a research approach at scale. If data capture became part of the design of products to support research, this may in turn limit people’s privacy. The participants questioned the acceptability of data gathering from a user perspective and some felt that it is “dystopian in nature” [P3]. P19 raised concerns that, given the context, there could be a need to remove certain events from the data gathered, such as when serious accidents occur. P4 felt that a way to mitigate unnecessary data gathering is to use targeted data collection in order to “design artefacts that are less invasive.”
“I can imagine a price banding between products that are collecting data in order to improve the product itself and you can opt out and pay for the more expensive one, that sound like a very Amazon way of designing a product, but then should it be a luxury to not have data regarding the use of a thing?” [P3]
Participants felt that there are further barriers and concerns to adopting telemetry data as part of design research. Quantitative data-driven design insights taken from telemetry data streams were seen to be potentially biased and misleading. When exploring the data the participants were mindful of the fact they made assumptions, which required cross-checking and discussions with the subject about what they think happened at certain points. They felt that data could be misinterpreted or that a label might be a misclassification of an event.
“The activity and the data representing the activity there is a difference between the lived experience and these graphs that get outputted in the end.” [P3]
The participants were able to observe discrepancies in the data. There were some indications that the GPS data is not accurate. For example, the elevation of the day cycle had a maximum elevation of 40 meters, while the evening cycle had a maximum elevation of 45 meters, despite the fact the cycles were done on the same route. This raised questions about how the GoPro was actually measuring elevation and if there are similar discrepancies in other parts of the dataset. P5 reflected: “this variations of 5 meters are ringing a bell that something is not quite right.” Similarly, the scene classification produced by the simple model in the GoPro looked very different for the day and evening cycles. During the day cycle the scene model classed the majority of the cycle as vegetation with about 40% to 65% certainty, however, in contrast the evening cycle, which had different lighting conditions with the sun visible within the shot, did not classify vegetation with a high probability. “I can say I might trust it more on a sunny day during the day time, rather than in the evening or in the morning” [P1]. This led to participants raising questions about the trustworthiness of the data and how to identify when data is inaccurate.
“The only difference is the lighting condition, so the question is given then the contrast in the colors, whether this causes the difference, although it seems the same. How do you prevent these types of misinterpretations?” [P1]
Utilizing Telemetry Data in Design Ideation
Participants identified that telemetry data exploration could support design ideation. P11 felt that the visualizations “helped me to think about the bike creatively in a very short period of time.” Other participants were keen to use the data in an experimental research approach in order to identify and solve problems around the product in a way that would allow for optimization and to enhance the user experience. For example, P3 felt that there is potential to match users with a bike that fits their needs and riding style, tuning the “suspension, the size of the wheels, the weight of it” for a better experience.
Participants identified that by examining user behaviors and user needs, they would be able to generate personas, or understand user needs across populations, which can lead to the development of a range of designs to fit variations in needs within user groups. “You might be able to see how to differentiate the bikes further based on how people are using them” [P3].
Most participants were easily able to envision how the data can become a key design feature in itself. For example, P1 and P9 saw potential for data to help identify dangerous situations and aid cyclists through various alerts; P7 saw that the data can be used to create bikes that autonomously react to their environment by intelligently changing their speed; P2 felt that data can help cyclists identify when the bike needs maintenance; and P4 saw potential to use the data to empower users to achieve training and performance goals.
“It would be more interesting if you could just empower users to be what they want to be, which might be to just have more fun” [P4].
Finally, telemetry data can have broader beneficial implications, such as to quantify the benefits of a greener city infrastructure [P12], or to encourage empathy between cyclists, pedestrians, and drivers from a “real emotional perspective” [P16].
Limitations
This study was conducted during a lockdown in response to the SARS-Cov2 virus, which limited the possibilities for face-to-face interaction—hence all interviews were conducted over a video link. There was only video data of a single subject (the lead researcher) in one area to explore. While the limited data focused the analysis and kept the study at a reasonable length, it would have been interesting to see the impact of other data sources. There were also a variety of participants who worked with the footage and their responses. The task was not strongly contextualized: it is likely that working around a clear process of redesign would have produced different results. Finally, there was a skew within the participants towards people with academic positions rather than industry practitioners.
Discussion
This study paints a picture of what can be carried out with multimodal data by designers, with little investment into data tooling and analysis. The participants developed and deployed quick, ad-hoc strategies, where data mediated between different spheres of knowledge. This is in line with Hinrichs’ ideas of sandcastles (Hinrichs et al., 2019), where visualizations provoke insight, interpretation, and speculation, and mediate between ideas and theories across disciplines. Of particular interest were the trajectories that participants took through the investigation, as they fluidly shifted between observation, reflection, analysis, critique, and theory building. Now, after noting limitations of the study, we start by discussing and contextualizing what happened as participants started their exploration, looking at the trajectories they took, and the practices of annotation and zooming in/out that emerged. We then go on to unpack implications for designers including video and telemetry data as a creative material within their design processes, and point to the avenues to connect to computational intelligence.
Designers Building Relations with Data
Uses of Telemetry Data within Design Research
Participants found the telemetry data both inspiring and a bit overwhelming. The presentation of the data allowed for a wide range of ideas about how to use data within bicycle design and redesign. Including traditional starting points such as ways to carry out predictive maintenance and design changes, but extended out to rethinking bicycles and their relations to society or recasting bikes as sensors to quantify the case for a greener city infrastructure. Working with telemetry data enabled participants to think about other potential telemetry configurations like adding sensors to multiple bikes and asking a single rider to ride them on the same terrain. Lack of expertise in telemetry meant that participants were not able to identify in detail what aspects of the telemetry data they would focus on to draw conclusions, but they did know they required large amounts of data over prolonged periods of time and help from data scientists. This self-awareness indicates that presenting an articulated set of possibilities for working with data, and a sense of what would be needed for each, would be helpful for designers and design researchers to develop relations with data-driven practices. This reflects previous research that designers find data overwhelming and collaboration across disciplines is required to make use of it (Lu et al., 2021).
Mediation and Synthesis between Datasets
Having multiple sources of data available allowed the participants to develop their own trajectories of investigation, carrying out synthesis across the datasets. Participants found the quantitative visualizations alone difficult to engage with. However, combining the video footage, sensor telemetry data, and conversation with the rider, provided multiple entry points into sense-making and exploring their research questions. Participants made use of multiple entry points for inquiry, starting with moments of interest in the video, points of change in the graph, curiosity about interpretations of the values displayed, and so on. They could then contextualize their question by moving to other data sources, including asking the subject as their investigation or conceptualization unfolded, creating a trajectory through the qualitative and quantitative space. Some of the richest moments of interaction in the study came from the participants creating bridges between these, whether P10 identifying when the bell was rung and pedestrians were passed using the video to explore how the speed of the rider was affected, or P3 using the spikes in the accelerometer data to investigate what happened contextually through the video. Figure 5 visualizes an illustrative subset of these trajectories. This is somewhat characteristic of design processes, that draw on tacit knowledge, situational understanding, and empirical practices in order to make changes in complex situations (Cross, 2001).
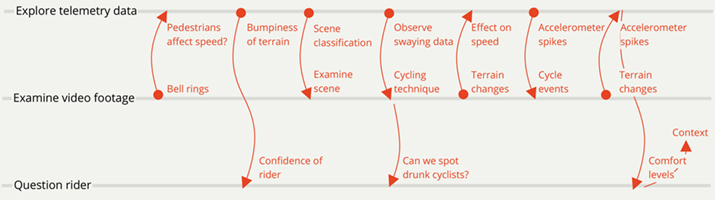
Figure 5. Selected trajectories of investigation. Each dot indicates the nucleation point of an investigation, with arrows pointing to sources of information to engage with.
Making Sense of the Data
It was encouraging to see participants not only using the data to understand the ride and generate follow-on ideas, but also using their knowledge of the world and insight into the situation to start to understand the data itself. Raw quantitative data is at heart just a collection of numbers—there may be a spike or a trough on a graph but those variations have very little intrinsic meaning. Presented without context behind them, they can easily lead to wild misunderstandings of what is really going on —for example, the moment when Google interpreted a flood of searchers for Michael Jackson as an automated attack, rather than a reaction to reports of his death (Pittman, 2009). The participants used a variety of approaches to knit the events together to better understand the context and from that gain a better understanding of what the shape of a line might actually mean in gyroscope data. While obvious, this observation has some important implications. Where in this case researchers were able to question the rider in detail, that would not necessarily be the case if testing was being done at scale. The process of understanding here unfolded between quantitative data, participant, video footage, and subject, and being able to access social and physical intuitions about the situation was a key way for the participants to get a better feel for what the data was describing.
Contextual Grounding
Participants tended to want the data to be contextually grounded and were not ready to just believe everything—even though they were happy to imagine building and training complex models on the telemetry data. Combining a variety of qualitative and quantitative data sources helped validate and challenge assumptions. Similar observations appear in the research of van Kollenburg and Bogers (2019), where combining data and participant knowledge from the use of a connected baby bottle helped reveal contexts, behaviors, and experiences. These results demonstrate that the quantitative data is seen as only part of the process, and while it is a useful seed or trigger, it does not need to be privileged over other kinds of knowledge work and research. There was a reluctance to see data as the only answer, as “even with the most rich of data different stories can be told” [P16], following the view that an understanding of the situation through empathetic imagining is emergent from the research encounter, rather than predetermined (Pink et al., 2017).
Data Use and Privacy
Any time data is collected about people, there are significant concerns about privacy, and more broadly the impacts of being part of data gathering and interpretation processes. In general, questions here are in line with a combination of IoT smart devices and video capture, which is a complex space due to factors such as lack of clarity (Rosner & Kenneally, 2018) and the difficulty of giving meaningful consent (Seymour, Cote, et al., 2022). When the scope of collection and the present and future uses of data are so complex, these factors can require new approaches to managing consent (Nissen et al., 2019). The privacy and consent issues depend heavily on the relation between participants and data collection: Oulasvirta et al. (2012) found that even people who oppose surveillance become accustomed to pervasive data capture in their homes over time; Gorkovenko et al. (2019) placed smart objects in people’s homes to understand daily routines and behaviors, and found that the activity of asking people about the data could create a sense of unease; following up, Gorkovenko and Murray-Rust (2022) investigated the acceptability of data capture specifically for redesign, and found that transparency and agency for users were important, but also their sense of the purpose of the data and relation to the organization that was capturing it. There are many configurations for this kind of work, each with their own implications for privacy and consent. The configuration here centers on a single user, who has given consent for purposeful data collection in a bounded time period, so their consent and privacy is somewhat taken care of—although the data capture in a public space presents other issues. The question of how limited the capture, processing, and interpretation of data are frames a complex privacy space. For real-time data from smart or instrumented products, we would suggest following recommendations from Gorkovenko and Murray-Rust (2022) and emphasizing agency, informed consent, transparency, and openness, with a minimal burden to participation, and well bounded scope of use for the data. We would also suggest that the lens of respect (Seymour, Van Kleek, et al., 2022) can help to avoid problems in the design of mixed human, data, and machine learning systems.
Annotation as a Source of Entanglements
Annotation was one of the key practices within this study, through the design of the materials but also through its usefulness in crossing boundaries and developing shared senses of meaning. Annotation tends to fit a designerly way of working—it allows for competing or conflicting interpretations, working through connection and the layering of multiple fields of knowledge. Early design work around the use of annotations (Li et al., 2009) looked at this last point, in particular the collaborative and communicative use of annotation, and the way that annotation can allow interaction between different specialist viewpoints.
Inconsistencies in interpretation and annotation can be the start of a process of questioning, leading to valuable insight—for example, understanding the causes behind discrepancies in elevation data that P5 observed. Several participants developed a practice of checking in about the meanings of various machine produced labels or visually observed data signatures, which prompted a rethinking and development of their understanding—not just looking at the graphs. This relates to practices emerging in the learning community, where the practice of annotation transforms static artefacts such as books into a context for discussion, analysis, and shared inquiry (Kalir, 2022).
Within this curiosity, there were different styles of investigation, where some designers started to think in terms of structured studies, others were more interested in the experiential aspects, balancing looking at the person who was the subject of the data and looking at the data itself. There is a power in the unstructured nature of the annotation process, and here participants could develop their own pathways of attention—as Annotations appear and interrelate without a preconceived order (Fernández Contreras, 2021), their creation can be motivated by detailed investigation or broad speculation as appropriate. Within this particular context, the annotations were not constrained by ontology (Kantorovitch et al., 2016) or placement on a timeline.
There is a connection here to the practice of video ethnography, which has also been used with cyclists as a means to generate and share empathetic encounters with participants (Pink et al., 2017), of feeling there when you can’t be there (Spinney, 2011). The style of investigation carried out here is in some ways more surface-level, as the participants could not drill down to the same level of, e.g., gaze and attention (Tuncer et al., 2020). The tradeoff is that participants could cast a wider net in thinking about what the data might imply, and more directly how to appropriate it into a design process. There is also a link here to entanglement theories (Frauenberger, 2020), that look at how understanding arises about fluid situations, where complex networks arise, and the objects under discussion are ontologically precarious, being to some extent constructed through the investigation (Barad, 2007).
Pragmatically, annotation has multiple possibilities that can be appropriated for use in early stage design and Research through Design research:
- Annotation provides a way to navigate multimodal complex datasets, and integrates viewpoints across different domains of knowledge (Badam et al., 2022; Cassidy & Schmidt, 2017; Chandrasegaran, 2016).
- Annotation can form the basis of collaboration patterns. This is already present in CAD models (Li et al., 2009) as a generic coordination tool, but can give rise to specific practices. These include critique, discussion, and feedback on what is happening, e.g., critical feedback in nursing contexts (Cattaneo et al., 2020), as well as collaborative annotations on shared material as a distance learning technique (Zhu et al., 2020).
- Annotation supports sensemaking in new fields—in particular, providing a way in for less data-literate designers working with telemetry data, as shown by the progression of annotations here from speeds to accelerations to thinking into terrain and vibration.
- Annotation connects humans and computational systems. This can include machine annotations for warnings and errors on code or digital models, but also extends to machine learning systems if annotations can be formalized as labels on which to build models, for example in education with multimodal machine learning analytics (Di Mitri et al., 2019). Connections can be seen to projects like the Thing Visualizer (Huang et al., 2021), where images are annotated with the presence of objects to create labels for understanding social relations.
Where annotations can connect between human and machine agencies, they create new possibilities within the messier, interconnected world of post-industrial design (Giaccardi & Redström, 2020). Curious annotation from designers can propagate to inform models built by data scientists, that change product functions or provide design insights.
Zooming In and Zooming Out
The scope of the design researchers’ vision moved between small scale physical phenomena and broader macro views, for example, going from seeing a spike on the graph to asking the subject what happened there, or using the graph of speed as a prompt to question the practice of rapid cycling and its effect on bystanders. This went in both directions, questioning how personal experiences of issues with bike maintenance or social regulations around speed might come through in the data traces. The initial focus on the physicality of the bicycle allowed a move towards thinking about the state of the rider, their experience and emotional connection, and from there to wider questions. This led to the generation of a wide range of research questions, from ways to carry out predictive maintenance and design changes out to rethinking bicycles and their relations to society. From the micro level data, participants developed possibilities around the implications of a bike that could sense a drunk rider to recasting bikes as sensors to quantify the case for a greener city infrastructure. Telemetry data appears to offer a useful space for imagination, as it bridges between direct physical concerns and the potential for working at scale and over time.
There is a relation here to the development of zooming in and zooming out (Nicolini, 2009b) as a technique within practice theory—a set of theories that look at socio-material practices as the central object of enquiry (Nicolini, 2012). Again, connecting to the way annotations work to create links across different datasets, in this work there was a fluid sense of moving between data and theory (Nicolini, 2009b), as participants moved from phenomenon to model to implications and back. As P4 put it: “There’s always this back and forth between the questions that emerged from data that you observed and your original kind of purpose of why did you start to research in the first place.” The data drew people into particular activities, for example using changes in speed to look into whether the cyclist was looking out at the view (P17), and then pivoting to ask about the others around in that moment, and whether directing attention away from the road was a safety concern. Some approaches differentiated and bound sections of practices to develop distinctions—segmenting graphs to find points of change and looking at the differences, finding particular moments in the video, and detailing happenings around them (P16); others moved from these segmentations out to how a rider relates to others on the road (P16) and the other actors in the space (P14) and the windows that could be found into their activities. Participants were particularly sensitive to the limits of zooming in, the idea that when pushed to an extreme, the ecological validity and interpretive capacity of the description diminish (Nicolini, 2009a).
Part of the impact of working with data in this study is the decentering of the rider. This gives space to understand the situations in terms of others in the space, the terrain, the bike, and society more generally—the stuff of Shove and Pantzar’s (2005) stuff, skills, and images (as interpreted by Kuijer, 2014, p. 26). Working with the abstract traces follows the Wittgensteinian pathway that it is the actions carried out, rather than the beliefs and goals around them, that are central to developing meaningful understandings of action (Nicolini, 2009a), but also gives space for the material things to become more present in an account of the situation. Participants’ journeys touched on all of these, e.g., P14 working between movement of the stuff in space (wobbling bicycle), out to images of drunken cycling as a practice, and back towards problems with the production of safe cycling. Multimodal data can function as a means to enlist material things into the co-understanding of the space (Giaccardi et al., 2016), and as a way to bring together the strands of practice theory in a manageable way.
Connections between Design and Machine Learning through Data Exploration
One of the main observations from participants was the importance of context and how different data streams lined up. While it is not clear from a visual inspection whether a peak on the gyroscope was likely to be caused by the bike tipping over, machine learning approaches allow the possibility of transforming annotated labels into classifiers. These observations are reflective of other work in the intersection of user experience (UX) designers and machine learning (ML) (Yang et al., 2018), highlighting the need to find just what levels of data literacy are required to work in conjunction with ML or data science colleagues. However, there was support for the idea of tools that could point to moments of interest through segmenting or pattern matching on the data, or systems that could allow users to explore hypotheses and relations through the data—machine learning that supports human agency in the process. Overall, the observations indicated that there is a strong potential for approaches that augment and assist human labelling, and can support research journeys and investigations, rather than providing black-box output.
Annotation, with open interpretations and connections, is a process distinct from the hard edged labelling required to train classification systems. There is a challenge in relating a common sense understanding of the world to the statistical view presented by ML algorithms (Dove et al., 2017), although, as ML becomes more ubiquitous and less mystical, there is the opportunity for design research to mediate with the intimate human experience of lifeworlds; and to productively engage with emerging personal, societal, and ethical issues (Benjamin et al., 2021). Presenting the automatic classification of scenes as vegetation, indoor, snow, and water, as provided by the GoPro, provoked confusion with the participants, who did not immediately have a way in to understand the thingly uncertainty of the camera’s operation (Benjamin et al., 2021). These observations are reflective of other work in the intersection of UX designers and ML (Yang et al., 2018), highlighting the need to find just what levels of data literacy are required to work in conjunction with ML or their data science colleagues within an industrial section. However, the use of annotation, of contextual grounding, and the investigative strategies available (Figure 5) point to ways to bring both the development and interpretation of ML models into the design process, in ways familiar to design researchers.
These links are not necessarily obvious or easy. Annotation typically works with somewhat fluid concepts, and allows connection at the level of interpretation, rather than the underlying data. However, the emerging field of Interactive Machine Learning (IML) offers possibilities for working between human expertise and ML models. See Dudley and Kristensson (2018) for an overview of these techniques through the lens of human computer interaction; this illustrates approaches where, e.g., supplying a set of initial examples is a useful input to structuring a model and the approaches needed to create useful tools. Rogers and Crisan (2023) provide a more detailed tracing approach to understanding how these processes unfold. Some deployments of AutoML—systems that automatically configure machine learning pipelines for non-expert users (Hutter et al., 2019)—offer easy ways in to using ML techniques. Of particular interest are approaches that focus on ways to bring in human domain knowledge in an interactive manner, using interpretable feedback to negotiate between model and human viewpoints (Arzani et al., 2021). Similarly, Active Learning (e.g., Biyik & Sadigh, 2018) sits in between supervised and unsupervised approaches, and can be used to bring human input in to points of maximum model uncertainty, making best use of human labelling effort. See Wang and Kim (2023) for an example where preferences are used to create individualized representations of news visualizations for blind and partially sighted users, or Hossain et al. (2017) applying this to activity recognition. All of these technical approaches illustrate ways in which processes can be set up that mediate between human understanding and model operation, working between annotation, labelling, and model creation. While it is difficult to put precise bounds on the possibilities of scaling these approaches, the model of Hossain et al. (2017) uses a manageable amount of data (2h video per participant) to train a model, as well as extending it to include previously unseen activities.
Key Implications and Takeaways
Synthesized from the previous findings and discussion, we offer a set of key takeaways and extrapolations for understanding the relations between designers and multimodal telemetry data in the fuzzy front end of the design process.
- Data can be used for design ideation and optimization. Following on from related work (Gorkovenko et al., 2020; e.g., Kun et al., 2019), in this study data offered a jumping off point for creative thought about a product. By forming hypotheses and studies that could test them, participants were able to identify opportunities for design ideation. Questioning what is really in the data allowed them to explore and engage with the data from a position of curiosity, bringing their existing practices.
- Annotation is a key practice for designers engaging with data. We saw that annotation allowed designers to question, model, and connect across various datasets. This practice of labelling appears to be a key means to engage with data, as it i) allows designers to use familiar practices; ii) supports multiple perspectives on the data; iii) combines human interpretation with the foundation of machine learning models; and iv) allows a combination of interpretation and critique that supports interdisciplinary practices.
- Data for design ideation should remain contextualized. Data science often proceeds by extracting data from situations and analyzing it into crisp, decontextualized results (McQuillan, 2018). The practices that designers reached for in this study pointed to a mode of working where a connection was maintained between the data and the situation it was captured in. Rather than acting as an abstract description, data became a way to ask questions about maintenance, social interaction, and user experience, maintaining thickness (Storey, 2016).
- Tools for engaging with data need to support fluid investigation. The key affordance of the simple static visualizations and videos used in this study was that they allowed multiple pathways through the exploration, with trajectories from data to video to questions and back again. Rather than linear analyses, tools need to support this kind of gradual weaving together of annotation, analysis, grounding, and contextualization. Participants took different pathways, some starting from phenomena of interest and moving towards the data, some investigating features of the data to discover the phenomena behind them. Allowing individual investigative routes would help engage a range of designers and processes.
- Data can be overwhelming at first; connecting to the world helps. Several participants noted that the initial sense of looking at data graphs took them outside their comfort zone, which felt challenging. A key strategy for dealing with this was working on the connection between the data and the world, using it as a prompt for investigation rather than a decontextualized material. The potential to explore hypotheses that arose in relation to the data was seen as comforting, to ground speculation in something familiar.
- There is space for simple analysis. Many designerly requests would be well satisfied not with complex models, but with tools that allowed simple statistical analysis to be run over the traces: trends, variation, thresholds, mean values, and so on would be useful responses to many enquiries. Providing a fluid and natural way to ask these simple questions of data would greatly lower barriers to entry.
- Uncertainty is not always a limiting factor. When data is used for creativity support, questions over model uncertainty or data robustness have a different weight; the data directs attention rather than providing answers. When it meets with the natural skepticism of design practitioners about models that provide perfect answers, and a sense of thingly uncertainty (Benjamin et al., 2021) about how things experience the world, the idea that model outputs and data summaries are not perfect maintains a sense of open investigation.
- Clustering and novelty are compelling. The more common requests from designers were for models that can help to cluster or stratify different populations, and for those that can help to spot novel moments worthy of further analysis. This may be because these are familiar practices: market analysis relies heavily on customer segmentation; most practices of video or participant analysis rely on somehow picking out moments of interest for detailed interrogation.
Conclusion
Through a data-exploration exercise with 20 designers, researchers, developers, and engineers, this paper contributes an exploration of the potential of low-cost telemetry data for design research around physical products, in this case a bicycle. The participants combined an exploration of visualized data traces with time-aligned video footage and direct interaction with the rider. Despite not being data scientists, the participants were able to make use of the telemetry data to initiate questions around physical characteristics and performance of the bike, user experience, and larger behavioral questions. The raw telemetry visualization supported several designerly strategies—mediating between different datasets and approaches, supporting creation and exploration of ad-hoc models, and connecting small scale behaviors to wider contexts. This suggested a rich set of ways designers can engage with this kind of data, from contextual grounding for concepts and hypotheses to a way to interact with machine learning systems. Of particular interest were the trajectories that designers took between looking at telemetry, video capture, and engaging with the research subject. They also used strategies of zooming in and out to mediate between micro-data, potential for analysis, and wider social questions. Overall, even this raw presentation of telemetry data, in combination with video footage and interview possibilities, was enough to stimulate creative thought, open design possibilities, and motivate a wide range of design research questions. This demonstrates both the possibility and the need for tools that help convert creative data analysis into functioning machine learning models or data-driven systems that can support new kinds of design processes.
Acknowledgments
This research was funded by the UK Research Councils / EPSRC under the New Industrial Systems theme through the Chatty Factories project (EP/R021031/1). Many thanks to all of our participants for joining in with research despite the pandemic, and to the Design Informatics community in Edinburgh for being a fantastic place to do interesting research.
References
- Abrahams, L. (2019, September). The ‘world’s safest’ bike helmet has its own airbag. Metro. https://metro.co.uk/2019/09/14/the-worlds-safest-bike-helmet-has-its-own-airbag-10742254/
- Anderson, K., Nafus, D., Rattenbury, T., & Aipperspach, R. (2009). Numbers have qualities too: Experiences with ethno-mining. In Proceedings of ethnographic praxis in industry conference (pp. 123-140). John Wiley & Sons. https://doi.org/10.1111/j.1559-8918.2009.tb00133.x
- Arzani, B., Hsieh, K., & Chen, H. (2021). Interpretable feedback for AutoML and a proposal for domain-customized AutoML for networking. In Proceedings of the 20th workshop on hot topics in networks (pp. 53-60). ACM. https://doi.org/10.1145/3484266.3487373
- Austin, J., Jackson, T., Fletcher, M., Jessop, M., Cowley, P., & Lobner, P. (2004). Predictive maintenance: Distributed aircraft engine diagnostics. In I. Foster & C. Kesselman (Eds.), The grid 2 (2nd Edition) (pp. 69-79). Morgan Kaufmann. https://doi.org/10.1016/B978-155860933-4/50009-2
- Badam, S. K., Chandrasegaran, S., & Elmqvist, N. (2022). Integrating annotations into multidimensional visual dashboards. Information Visualization, 21(3), 270-284. https://doi.org/10.1177/14738716221079591
- Bahirat, P., He, Y., Menon, A., & Knijnenburg, B. (2018). A data-driven approach to developing IoT privacy-setting interfaces. In Proceedings of the 23rd international conference on intelligent user interfaces (pp. 165-176). ACM. https://doi.org/10.1145/3172944.3172982
- Barad, K. M. (2007). Meeting the universe halfway quantum physics and the entanglement of matter and meaning. Duke University Press.
- Benjamin, J. J., Berger, A., Merrill, N., & Pierce, J. (2021). Machine learning uncertainty as a design material: A post-phenomenological inquiry. In Proceedings of the conference on human factors in computing systems (Article No. 171). ACM. https://doi.org/10.1145/3411764.3445481
- Bertoni, A. (2020). Data-driven design in concept development: Systematic review and missed opportunities. In Proceedings of the design conference on design society (pp. 101-110). Cambridge University Press. https://doi.org/10.1017/dsd.2020.4
- Bhavnani, Y., Rodden, K., Guarnotta, L. C., Lynn, M. T., Chizari, S., & Granka, L. (2017). Understanding mobile phone activities via retrospective review of visualizations of usage data. In Proceedings of the 19th international conference on human-computer interaction with mobile devices and services (pp. 1-10). ACM. https://doi.org/10.1145/3098279.3119841
- Biyik, E., & Sadigh, D. (2018). Batch active preference-based learning of reward functions. In Proceedings of the 2nd conference on robot learning (pp. 519-528). arXiv. https://doi.org/10.48550/arXiv.1810.04303
- Bogers, S., Frens, J., van Kollenburg, J., Deckers, E., & Hummels, C. (2016). Connected baby bottle: A design case study towards a framework for data-enabled design. In Proceedings of the conference on designing interactive systems (pp. 301-311). ACM. https://doi.org/10.1145/2901790.2901855
- Bourgeois, J., & Kleinsmann, M. (2023). AIEDAM thematic collection: A perspective on data-enabled design – design meet data science. AI EDAM, 37, e7. https://doi.org/10.1017/S0890060422000221
- Bourgeois, J., van der Linden, J., Kortuem, G., Price, B. A., & Rimmer, C. (2014). Conversations with my washing machine: An in-the-wild study of demand shifting with self-generated energy. In Proceedings of the international joint conference on pervasive and ubiquitous computing (pp. 459-470). ACM. https://doi.org/10.1145/2632048.2632106
- Braun, V., & Clarke, V. (2006). Using thematic analysis in psychology. Qualitative Research in Psychology, 3(2), 77-101. https://doi.org/10.1191/1478088706qp063oa
- Briard, T., Jean, C., Aoussat, A., Véron, P., Le Cardinal, J., & Wartzack, S. (2021). Data-driven design challenges in the early stages of the product development process. Proceedings of the Design Society, 1, 851-860. https://doi.org/10.1017/pds.2021.85
- Burnett, D., Thorp, J., Richards, D., Gorkovenko, K., & Murray-Rust, D. (2019). Digital twins as a resource for design research. In Proceedings of the 8th international symposium on pervasive displays (Article No. 37). ACM. https://doi.org/10.1145/3321335.3329685
- Cassidy, S., & Schmidt, T. (2017). Tools for multimodal annotation. In N. Ide & J. Pustejovsky (Eds.), Handbook of linguistic annotation (pp. 209-227). Springer. https://doi.org/10.1007/978-94-024-0881-2_7
- Cattaneo, A. A. P., Boldrini, E., & Lubinu, F. (2020). “Take a look at this!”. Video annotation as a means to foster evidence-based and reflective external and self-given feedback: A preliminary study in operation room technician training. Nurse Education in Practice, 44, 102770. https://doi.org/10.1016/j.nepr.2020.102770
- Chamberlain, A., Crabtree, A., Rodden, T., Jones, M., & Rogers, Y. (2012). Research in the wild: Understanding ‘in the wild’ approaches to design and development. In Proceedings of the designing interactive systems conference (pp. 795-796). ACM. https://doi.org/10.1145/2317956.2318078
- Chandrasegaran, R. S. K. (2016). Tools and methods to analyze multimodal data in collaborative design ideation. Retrieved from https://docs.lib.purdue.edu/cgi/viewcontent.cgi?article=2623&context=open_access_dissertations
- Chang, W.-W., Giaccardi, E., Chen, L.-L., & Liang, R.-H. (2017). “Interview with things”: A First-thing perspective to understand the scooter’s everyday socio-material network in Taiwan. In Proceedings of the conference on designing interactive systems (pp. 1001-1012). ACM. https://doi.org/10.1145/3064663.3064717
- Churchill, E. F. (2017). Data, design, and ethnography. Interactions, 25(1), 22-23. https://doi.org/10.1145/3172893
- Coulton, P., & Lindley, J. G. (2019). More-than human centred design: Considering other things. The Design Journal, 22(4), 463-481. https://doi.org/10.1080/14606925.2019.1614320
- Cross, N. (2001). Designerly ways of knowing: Design discipline versus design science. Design Issues, 17(3), 49-55. https://www.jstor.org/stable/1511801
- Daily, J., & Peterson, J. (2017). Predictive maintenance: How big data analysis can improve maintenance. In K. Richter & J. Walther (Eds.), Supply chain integration challenges in commercial aerospace: A comprehensive perspective on the aviation value chain (pp. 267-278). Springer. https://doi.org/10.1007/978-3-319-46155-7_18
- Deka, B., Huang, Z., & Kumar, R. (2016). ERICA: Interaction mining mobile apps. In Proceedings of the 29th annual symposium on user interface software and technology (pp. 767-776). ACM. https://doi.org/10.1145/2984511.2984581
- Di Mitri, D., Schneider, J., Klemke, R., Specht, M., & Drachsler, H. (2019). Read between the lines: An annotation tool for multimodal data for learning. In Proceedings of the 9th international conference on learning analytics & knowledge (pp. 51-60). ACM. https://doi.org/10.1145/3303772.3303776
- Dove, G., Halskov, K., Forlizzi, J., & Zimmerman, J. (2017). UX design innovation: Challenges for working with machine learning as a design material. In Proceedings of the conference on human factors in computing systems (pp. 278-288). ACM. https://doi.org/10.1145/3025453.3025739
- Drachen, A., & Schubert, M. (2013). Spatial game analytics and visualization. In Proceedings of the conference on computational intelligence in games (Article No. 13850560). IEEE. https://doi.org/10.1109/CIG.2013.6633629
- Droumeva, M. (2015, June). Sensory postcards: Using mobile media for digital ethnographies. Ethnography Matters. https://ethnographymatters.net/blog/2015/06/29/sensory-postcards-using-mobile-media-for-digital-ethnographies/
- Dubois, E., & Ford, H. (2015). Trace interviews: An actor-centered approach. International Journal of Communication, 9, 2067-2091.
- Dudley, J. J., & Kristensson, P. O. (2018). A review of user interface design for interactive machine learning. ACM Transactions on Interactive Intelligent Systems, 8(2), Article No. 8. https://doi.org/10.1145/3185517
- Edu, J. S., Such, J. M., & Suarez-Tangil, G. (2020). Smart home personal assistants: A security and privacy review. ACM Computing Surveys, 53(6), Article No. 116. https://doi.org/10.1145/3412383
- Evans, B. (2016). Paco to scale qualitative methods. In Proceedings of the ethnographic praxis in industry conference (pp. 348-368). John Wiley & Sons. https://doi.org/10.1111/1559-8918.2016.01095
- Evi-Colombo, A., Cattaneo, A., & Bétrancourt, M. (2020). Technical and pedagogical affordances of video annotation: A literature review. Journal of Educational Multimedia and Hypermedia, 29(3), 193-226.
- Feinberg, M. (2017). A design perspective on data. In Proceedings of the conference on human factors in computing systems (pp. 2952-2963). ACM. https://doi.org/10.1145/3025453.3025837
- Fernández Contreras, J. (2021). Annotation as review: Graphic thinking in Enric Miralles’ Ph.D. thesis. Architecture and Culture, 10(2), 272-283. https://doi.org/10.1080/20507828.2021.1946746
- Fischer, J. E., Crabtree, A., Colley, J. A., Rodden, T., & Costanza, E. (2017). Data work: How energy advisors and clients make IoT data accountable. Computer supported cooperative work, 26(4), 597-626. https://doi.org/10.1007/s10606-017-9293-x
- Frauenberger, C. (2020). Entanglement HCI the next wave? ACM Transactions on Computer-Human Interaction, 27(1), Article No. 2. https://doi.org/10.1145/3364998
- Gasevic, D., Rose, C., Siemens, G., Wolff, A., & Zdrahal, Z. (2014). Learning analytics and machine learning. In Proceedings of the 4th international conference on learning analytics and knowledge (pp. 287-288). ACM. https://doi.org/10.1145/2567574.2567633
- Gaver, W., Boucher, A., Jarvis, N., Cameron, D., Hauenstein, M., Pennington, S., Bowers, J., Pike, J., Beitra, R., & Ovalle, L. (2016). The datacatcher: Batch deployment and documentation of 130 location-aware, mobile devices that put sociopolitically-relevant big data in people’s hands: Polyphonic interpretation at scale. In Proceedings of the conference on human factors in computing systems (pp. 1597-1607). ACM. https://doi.org/10.1145/2858036.2858472
- Giaccardi, E. (2019). Histories and futures of research through design: From prototypes to connected things. International Journal of Design, 13(3), 139-155.
- Giaccardi, E., Cila, N., Speed, C., & Caldwell, M. (2016). Thing ethnography: Doing design research with non-humans. In Proceedings of the conference on designing interactive systems (pp. 377-387). ACM. https://doi.org/10.1145/2901790.2901905
- Giaccardi, E., & Redström, J. (2020). Technology and more-than-human design. Design Issues, 36(4), 33-44. https://doi.org/10.1162/desi_a_00612
- Giaccardi, E., Speed, C., Cila, N., & Caldwell, M. L. (2020). Things as co-ethnographers: Implications of a thing perspective for design and anthropology. In R. C. Smith, K. T. Vangkilde, M. G. Kjaersgaard, T. Otto, Y. Halse, & T. Binder (Eds.), Design anthropological futures (Chapter 15). Bloomsbury. https://doi.org/10.4324/9781003085188
- Gorkovenko, K., Burnett, D. J., Thorp, J. K., Richards, D., & Murray-Rust, D. (2020). Exploring the future of data-driven product design. In Proceedings of the conference on human factors in computing systems (pp. 1-14). ACM. https://doi.org/10.1145/3313831.3376560
- Gorkovenko, K., Burnett, D., Thorp, J., Richards, D., & Murray-Rust, D. (2019). Supporting real-time contextual inquiry through sensor data. In Proceedings of the ethnographic praxis in industry conference (pp. 554-581). John Wiley & Sons. https://doi.org/10.1111/1559-8918.2019.01307
- Gorkovenko, K., & Murray-Rust, D. (2022). User Perspectives on the acceptability of realtime data capture for design research by connected products. In G. Bruyns & H. Wei (Eds.), With design: Reinventing design modes (pp. 2201-2221). Springer. https://doi.org/10.1007/978-981-19-4472-7_144
- Grieves, M. (2014). Digital twin: Manufacturing excellence through virtual factory replication. Retrieved from https://www.3ds.com/fileadmin/PRODUCTS-SERVICES/DELMIA/PDF/Whitepaper/DELMIA-APRISO-Digital-Twin-Whitepaper.pdf
- Grieves, M., & Vickers, J. (2017). Digital twin: Mitigating unpredictable, undesirable emergent behavior in complex systems. In F.-J. Kahlen, S. Flumerfelt, & A. Alves (Eds.), Transdisciplinary perspectives on complex systems: New findings and approaches (pp. 85-113). Springer. https://doi.org/10.1007/978-3-319-38756-7_4
- Haines, J. K. (2017). Towards multi-dimensional ethnography. In Proceedings of the ethnographic praxis in industry conference (pp. 127-141). John Wiley & Sons. https://doi.org/10.1111/1559-8918.2017.01143
- Hinrichs, U., Forlini, S., & Moynihan, B. (2019). In defense of sandcastles: Research thinking through visualization in digital humanities. Digital Scholarship in the Humanities, 34(Supplement 1), i80-i99. https://doi.org/10.1093/llc/fqy051
- Hossain, H. M. S., Khan, M. A. A. H., & Roy, N. (2017). Active learning enabled activity recognition. Pervasive and Mobile Computing, 38, 312-330. https://doi.org/10.1016/j.pmcj.2016.08.017
- Houben, S., Golsteijn, C., Gallacher, S., Johnson, R., Bakker, S., Marquardt, N., Capra, L., & Rogers, Y. (2016). Physikit: Data engagement through physical ambient visualizations in the home. In Proceedings of the conference on human factors in computing systems (pp. 1608-1619). ACM. https://doi.org/10.1145/2858036.2858059
- Huang, Y.-C. (Janet), Cheng, Y.-T., Liang, R.-H., Hsu, J. Y., & Chen, L.-L. (2021). Thing constellation visualizer: Exploring emergent relationships of everyday objects. Proceedings of the ACM on Human-Computer Interaction, 5(CSCW2), Article No. 479. https://doi.org/10.1145/3479866
- Hutter, F., Kotthoff, L., & Vanschoren, J. (2019). Automated machine learning: Methods, systems, challenges. Springer.
- Kalir, J. H. (2022). Designing a social learning analytics tool for open annotation and collaborative learning. In P. Prinsloo, S. Slade, & M. Khalil (Eds.), Learning analytics in open and distributed learning: Potential and challenges (pp. 77-89). Springer. https://doi.org/10.1007/978-981-19-0786-9_6
- Kantorovitch, J., Niskanen, I., Zafeiropoulos, A., Liapis, A., Gonzalez, J. M. G., Didaskalou, A., & Motta, E. (2016). Knowledge extraction and annotation tools to support creativity at the initial stage of product design: Requirements and assessment. In S. Kunifuji, G. A. Papadopoulos, A. M. J. Skulimowski, & J. Kacprzyk (Eds.), Knowledge, information and creativity support systems (pp. 145-159). Springer. https://doi.org/10.1007/978-3-319-27478-2_11
- Kim, H. H. M., Liu, Y., Wang, C. C. L., & Wang, Y. (2017). Special issue: Data-driven design (D3). Journal of Mechanical Design, 139(11), 110301. https://doi.org/10.1115/1.4037943
- Koesten, L., Gregory, K., Groth, P., & Simperl, E. (2021). Talking datasets – Understanding data sensemaking behaviors. International Journal of Human-Computer Studies, 146, 102562. https://doi.org/https://doi.org/10.1016/j.ijhcs.2020.102562
- Kohavi, R., Deng, A., Frasca, B., Walker, T., Xu, Y., & Pohlmann, N. (2013). Online controlled experiments at large scale. In Proceedings of the 19th international conference on knowledge discovery and data mining (pp. 1168-1176). ACM. https://doi.org/10.1145/2487575.2488217
- Kohavi, R., Deng, A., Longbotham, R., & Xu, Y. (2014). Seven rules of thumb for web site experimenters. In Proceedings of the 20th international conference on knowledge discovery and data mining (pp. 1857-1866). ACM. https://doi.org/10.1145/2623330.2623341
- Kohavi, R., Longbotham, R., Sommerfield, D., & Henne, R. M. (2009). Controlled experiments on the web: Survey and practical guide. Data Mining and Knowledge Discovery, 18(1), 140-181. https://doi.org/10.1007/s10618-008-0114-1
- Kothe, C., Grivich, M., Brunner, C., & Medine, D. (2018). Lab streaming layer. Swartz Center for Computational Neuroscience.
- Kuijer, L. (2014). Implications of social practice theory for sustainable design (Doctoral dissertation). Delft University of Technology, Delft, the Netherlands.
- Kun, P., Mulder, I., de Götzen, A., & Kortuem, G. (2019). Creative data work in the design process. In Proceedings of the conference on creativity and cognition (pp. 346-358). ACM. https://doi.org/10.1145/3325480.3325500
- Kun, P., Mulder, I., & Kortuem, G. (2018a). Data exploration for generative design research. In Proceedings of the conference on design as a catalyst for change (pp. 1342-1356). Design Research Society.
- Kun, P., Mulder, I., & Kortuem, G. (2018b). Design enquiry through data: Appropriating a data science workflow for the design process. In Proceedings of the 32nd international BCS human computer interaction conference (Article No. 32). ACM. https://doi.org/10.14236/ewic/HCI2018.32
- Li, C., McMahon, C., & Newnes, L. (2009). Annotation in design processes: Classification of approaches. In Proceedings of the 17th international conference on engineering design (pp. 251-262). The Design society.
- Liikkanen, L. A. (2017). The data-driven design era in professional web design. Interactions, 24(5), 52-57. https://doi.org/10.1145/3121355
- Lomas, J. D., Forlizzi, J., Poonwala, N., Patel, N., Shodhan, S., Patel, K., Koedinger, K., & Brunskill, E. (2016). Interface design optimization as a multi-armed bandit problem. In Proceedings of the conference on human factors in computing systems (pp. 4142-4153). ACM. https://doi.org/10.1145/2858036.2858425
- Lu, J., Gomez Ortega, A., Gonçalves, M., & Bourgeois, J. (2021). The impact of data on the role of designers and their process. Proceedings of the Design Society, 1(ICED21), 3021-3030. https://doi.org/10.1017/pds.2021.563
- Martinez-Maldonado, R., Kay, J., Buckingham Shum, S., & Yacef, K. (2019). Collocated collaboration analytics: Principles and dilemmas for mining multimodal interaction data. Human-Computer Interaction, 34(1), 1-50. https://doi.org/10.1080/07370024.2017.1338956
- McQuillan, D. (2018). Data science as machinic neoplatonism. Philosophy & Technology, 31(2), 253-272. https://doi.org/10.1007/s13347-017-0273-3
- Mortier, R., Haddadi, H., Henderson, T., McAuley, D., & Crowcroft, J. (2014, October). Human-data interaction: The human face of the data-driven society. SSRN. https://doi.org/10.2139/ssrn.2508051
- Murray-Rust, D., Gorkovenko, K., Burnett, D., & Richards, D. (2019). Entangled Ethnography: Towards a collective future understanding. In Proceedings of the halfway to the future symposium (Article No. 21). ACM. https://doi.org/10.1145/3363384.3363405
- Nicolini, D. (2009a). Zooming in and out: Studying practices by switching theoretical lenses and trailing connections. Organization Studies, 30(12), 1391-1418. https://doi.org/10.1177/0170840609349875
- Nicolini, D. (2009b). Zooming in and zooming out: A package of method and theory to study work practices. In M. Worline (Ed.), Organizational ethnography: Studying the complexities of everyday life (pp. 120-138). SAGE.
- Nicolini, D. (2012). Practice theory, work, and organization: An introduction. Oxford University Press.
- Nissen, B., Neumann, V., Mikusz, M., Gianni, R., Clinch, S., Speed, C., & Davies, N. (2019). Should I agree?: Delegating consent decisions beyond the individual. In Proceedings of the conference on human factors in computing systems (Article No. 515). ACM. https://doi.org/10.1145/3290605.3300745
- Nourbakhsh, N., Chen, F., Wang, Y., & Calvo, R. A. (2017). Detecting users’ cognitive load by galvanic skin response with affective interference. ACM Transactions on Interactive Intelligent Systems, 7(3), Article No. 12. https://doi.org/10.1145/2960413
- Oulasvirta, A., Pihlajamaa, A., Perkiö, J., Ray, D., Vähäkangas, T., Hasu, T., Vainio, N., & Myllymäki, P. (2012). Long-term effects of ubiquitous surveillance in the home. In Proceedings of the conference on ubiquitous computing (pp. 41-50). ACM. https://doi.org/10.1145/2370216.2370224
- Pink, S., Sumartojo, S., Lupton, D., & LaBond, C. H. (2017). Empathetic technologies: Digital materiality and video ethnography. Visual Studies, 32(4), 371-381. https://doi.org/10.1080/1472586X.2017.1396192
- Pirolli, P., & Russell, D. M. (2011). Introduction to this special issue on sensemaking. Human-Computer Interaction, 26(1-2), 1-8. https://doi.org/10.1080/07370024.2011.556557
- Pittman, R. J. (2009, June). Outpouring of searches for the late Michael Jackson. Official Google Blog. https://googleblog.blogspot.com/2009/06/outpouring-of-searches-for-late-michael.html
- Pschetz, L., Tallyn, E., Gianni, R., & Speed, C. (2017). Bitbarista: Exploring perceptions of data transactions in the internet of things. In Proceedings of the conference on human factors in computing systems (pp. 2964-2975). ACM. https://doi.org/10.1145/3025453.3025878
- Robinson, R., Isbister, K., & Rubin, Z. (2016). All the feels: Introducing biometric data to online gameplay streams. In Proceedings of the annual symposium on computer-human interaction in play companion extended abstracts (pp. 261-267). ACM. https://doi.org/10.1145/2968120.2987732
- Rodrigues, R., Madeira, R. N., & Correia, N. (2022). Exploring the user interaction with a multimodal web-based video annotator. In Z. Lv & H. Song (Eds.), Intelligent technologies for interactive entertainment (pp. 13-22). Springer. https://doi.org/10.1007/978-3-030-99188-3_2
- Rogers, J., & Crisan, A. (2023). Tracing and visualizing human-ML/AI collaborative processes through artifacts of data work. In Proceedings of the conference on human factors in computing systems (Article No. 837). ACM. https://doi.org/10.1145/3544548.3580819
- Romat, H., Henry Riche, N., Hinckley, K., Lee, B., Appert, C., Pietriga, E., & Collins, C. (2019). ActiveInk: (Th)inking with data. In Proceedings of the conference on human factors in computing systems (Article No. 42). ACM. https://doi.org/10.1145/3290605.3300272
- Rosner, G., & Kenneally, E. (2018, May). Clearly opaque: Privacy risks of the internet of things. SSRN. https://ssrn.com/abstract=3320656
- Russell, D. M., Stefik, M. J., Pirolli, P., & Card, S. K. (1993). The cost structure of sensemaking. In Proceedings of the conference on human factors in computing systems (pp. 269-276). ACM. https://doi.org/10.1145/169059.169209
- Salvador, T., Bell, G., & Anderson, K. (1999). Design ethnography. Design Management Journal (Former Series), 10(4), 35-41. https://doi.org/10.1111/j.1948-7169.1999.tb00274.x
- Sanders, E. B.-N., & Stappers, P. J. (2008). Co-creation and the new landscapes of design. Co-Design, 4(1), 5-18. https://doi.org/10.1080/15710880701875068
- Sanders, L., & Stappers, P. J. (2014). From designing to co-designing to collective dreaming: Three slices in time. Interactions, 21(6), 24-33. https://doi.org/10.1145/2670616
- Seidelin, C., Dittrich, Y., & Grönvall, E. (2020a). Co-designing data experiments: Domain experts’ exploration and experimentation with self-selected data sources. In Proceedings of the 11th Nordic conference on human-computer interaction (Article No. 20). ACM. https://doi.org/10.1145/3419249.3420152
- Seidelin, C., Dittrich, Y., & Grönvall, E. (2020b). Foregrounding data in co-design: An exploration of how data may become an object of design. International Journal of Human-Computer Studies, 143, 102505. https://doi.org/10.1016/j.ijhcs.2020.102505
- Seymour, W., Cote, M., & Such, J. (2022). Can you meaningfully consent in eight seconds? Identifying ethical issues with verbal consent for voice assistants. In Proceedings of the 4th conference on conversational user interfaces (Article No. 15). ACM. https://doi.org/10.1145/3543829.3544521
- Seymour, W., Van Kleek, M., Binns, R., & Murray-Rust, D. (2022). Respect as a lens for the design of AI systems. In Proceedings of the conference on AI, ethics, and society (pp. 641-652). ACM. https://doi.org/10.1145/3514094.3534186
- Shove, E., & Pantzar, M. (2005). Consumers, producers and practices: Understanding the invention and reinvention of Nordic walking. Journal of Consumer Culture, 5(1), 43-64. https://doi.org/10.1177/1469540505049846
- Sipos, R., Fradkin, D., Moerchen, F., & Wang, Z. (2014). Log-based predictive maintenance. In Proceedings of the 20th international conference on knowledge discovery and data mining (pp. 1867-1876). ACM. https://doi.org/10.1145/2623330.2623340
- Smets, A., & Lievens, B. (2018). Human sensemaking in the smart city: A research approach merging big and thick data. In Proceedings of the ethnographic praxis in industry conference (pp. 179-194). John Wiley & Sons. https://doi.org/10.1111/1559-8918.2018.01203
- Speed, C., & Oberlander, J. (2016). Designing from, with and by data: Introducing the ablative framework. In Proceedings of the design research society conference (pp. 2992-3003). DRS. https://doi.org/10.21606/drs.2016.433
- Spinney, J. (2011). A chance to catch a breath: Using mobile video ethnography in cycling research. Mobilities, 6(2), 161-182. https://doi.org/10.1080/17450101.2011.552771
- Storey, M.-A. (2016). Lies, damned lies, and analytics: Why big data needs thick data. In T. Menzies, L. Williams, & T. Zimmermann (Eds.), Perspectives on data science for software engineering (pp. 369-374). Morgan Kaufmann. https://doi.org/10.1016/B978-0-12-804206-9.00068-4
- Tallyn, E., Pschetz, L., Gianni, R., Speed, C., & Elsden, C. (2018). Exploring machine autonomy and provenance data in coffee consumption. Proceedings of the ACM on Human-Computer Interaction, 2(CSCW), Article No. 170. https://doi.org/10.1145/3274439
- Tao, F., Sui, F., Liu, A., Qi, Q., Zhang, M., Song, B., Guo, Z., Lu, S. C.-Y., & Nee, A. Y. C. (2019). Digital twin-driven product design framework. International Journal of Production Research, 57(12), 3935-3953. https://doi.org/10.1080/00207543.2018.1443229
- Tomei, M., Schwing, A., Narayanasamy, S., & Kumar, R. (2019). Sensor training data reduction for autonomous vehicles. In Proceedings of the workshop on hot topics in video analytics and intelligent edges (pp. 45-50). ACM. https://doi.org/10.1145/3349614.3356028
- Tuncer, S., Laurier, E., Brown, B., & Licoppe, C. (2020). Notes on the practices and appearances of e-scooter users in public space. Journal of Transport Geography, 85, 102702. https://doi.org/10.1016/j.jtrangeo.2020.102702
- van Kollenburg, J., & Bogers, S. (2019). Data-enabled design: A situated design approach that uses data as creative material when designing for intelligent ecosystems (Doctoral dissertation). Eindhoven University of Technology, Eindhoven, the Netherlands.
- Wagner, J., Lingenfelser, F., Baur, T., Damian, I., Kistler, F., & André, E. (2013). The social signal interpretation (SSI) framework: Multimodal signal processing and recognition in real-time. In Proceedings of the 21st international conference on multimedia (pp. 831-834). ACM. https://doi.org/10.1145/2502081.2502223
- Wallner, G., Kriglstein, S., Gnadlinger, F., Heiml, M., & Kranzer, J. (2014). Game user telemetry in practice: A case study. In Proceedings of the 11th conference on advances in computer entertainment technology (Article No. 45). ACM. https://doi.org/10.1145/2663806.2663859
- Wang, Y., & Kim, Y.-S. (2023). Making data-driven articles more accessible: An active preference learning approach to data fact personalization. In Proceedings of the designing interactive systems conference (pp. 1353-1366). ACM. https://doi.org/10.1145/3563657.3595986
- Wolff, A., Seffah, A., Kortuem, G., & van der Linden, J. (2018). Designing for effective interactions with data in the internet of things. In Proceedings of the conference companion publication on designing interactive systems (pp. 415-418). ACM. https://doi.org/10.1145/3197391.3197402
- Xu, Y., Chen, N., Fernandez, A., Sinno, O., & Bhasin, A. (2015). From infrastructure to culture: A/B testing challenges in large scale social networks. In Proceedings of the 21th international conference on knowledge discovery and data mining (pp. 2227-2236). ACM. https://doi.org/10.1145/2783258.2788602
- Yang, Q., Scuito, A., Zimmerman, J., Forlizzi, J., & Steinfeld, A. (2018). Investigating how experienced UX designers effectively work with machine learning. In Proceedings of the designing interactive systems conference (pp. 585-596). ACM. https://doi.org/10.1145/3196709.3196730
- Yang, Q., Steinfeld, A., Rosé, C., & Zimmerman, J. (2020). Re-examining whether, why, and how human-AI interaction is uniquely difficult to design. In Proceedings of the conference on human factors in computing systems (pp. 1-13). ACM. https://doi.org/10.1145/3313831.3376301
- Yao, L., Liu, Y., Li, W., Zhou, L., Ge, Y., Chai, J., & Sun, X. (2014). Using physiological measures to evaluate user experience of mobile applications. In D. Harris (Ed.), Engineering psychology and cognitive ergonomics (pp. 301-310). Springer. https://doi.org/10.1007/978-3-319-07515-0_31
- Yarosh, S., & Zave, P. (2017). Locked or not? Mental models of IoT feature interaction. In Proceedings of the conference on human factors in computing systems (pp. 2993-2997). ACM. https://doi.org/10.1145/3025453.3025617
- Zhang, X., Brown, H.-F., & Shankar, A. (2016). Data-driven personas: Constructing archetypal users with clickstreams and user telemetry. In Proceedings of the conference on human factors in computing systems (pp. 5350-5359). ACM. https://doi.org/10.1145/2858036.2858523
- Zheng, P., Xu, X., & Chen, C.-H. (2020). A data-driven cyber-physical approach for personalised smart, connected product co-development in a cloud-based environment. Journal of Intelligent Manufacturing, 31(1), 3-18. https://doi.org/10.1007/s10845-018-1430-y
- Zhu, X., Chen, B., Avadhanam, R. M., Shui, H., & Zhang, R. Z. (2020). Reading and connecting: Using social annotation in online classes. Information and Learning Sciences, 121(5/6), 261-271. https://doi.org/10.1108/ILS-04-2020-0117
Appendix — Examples of Annotation Outputs
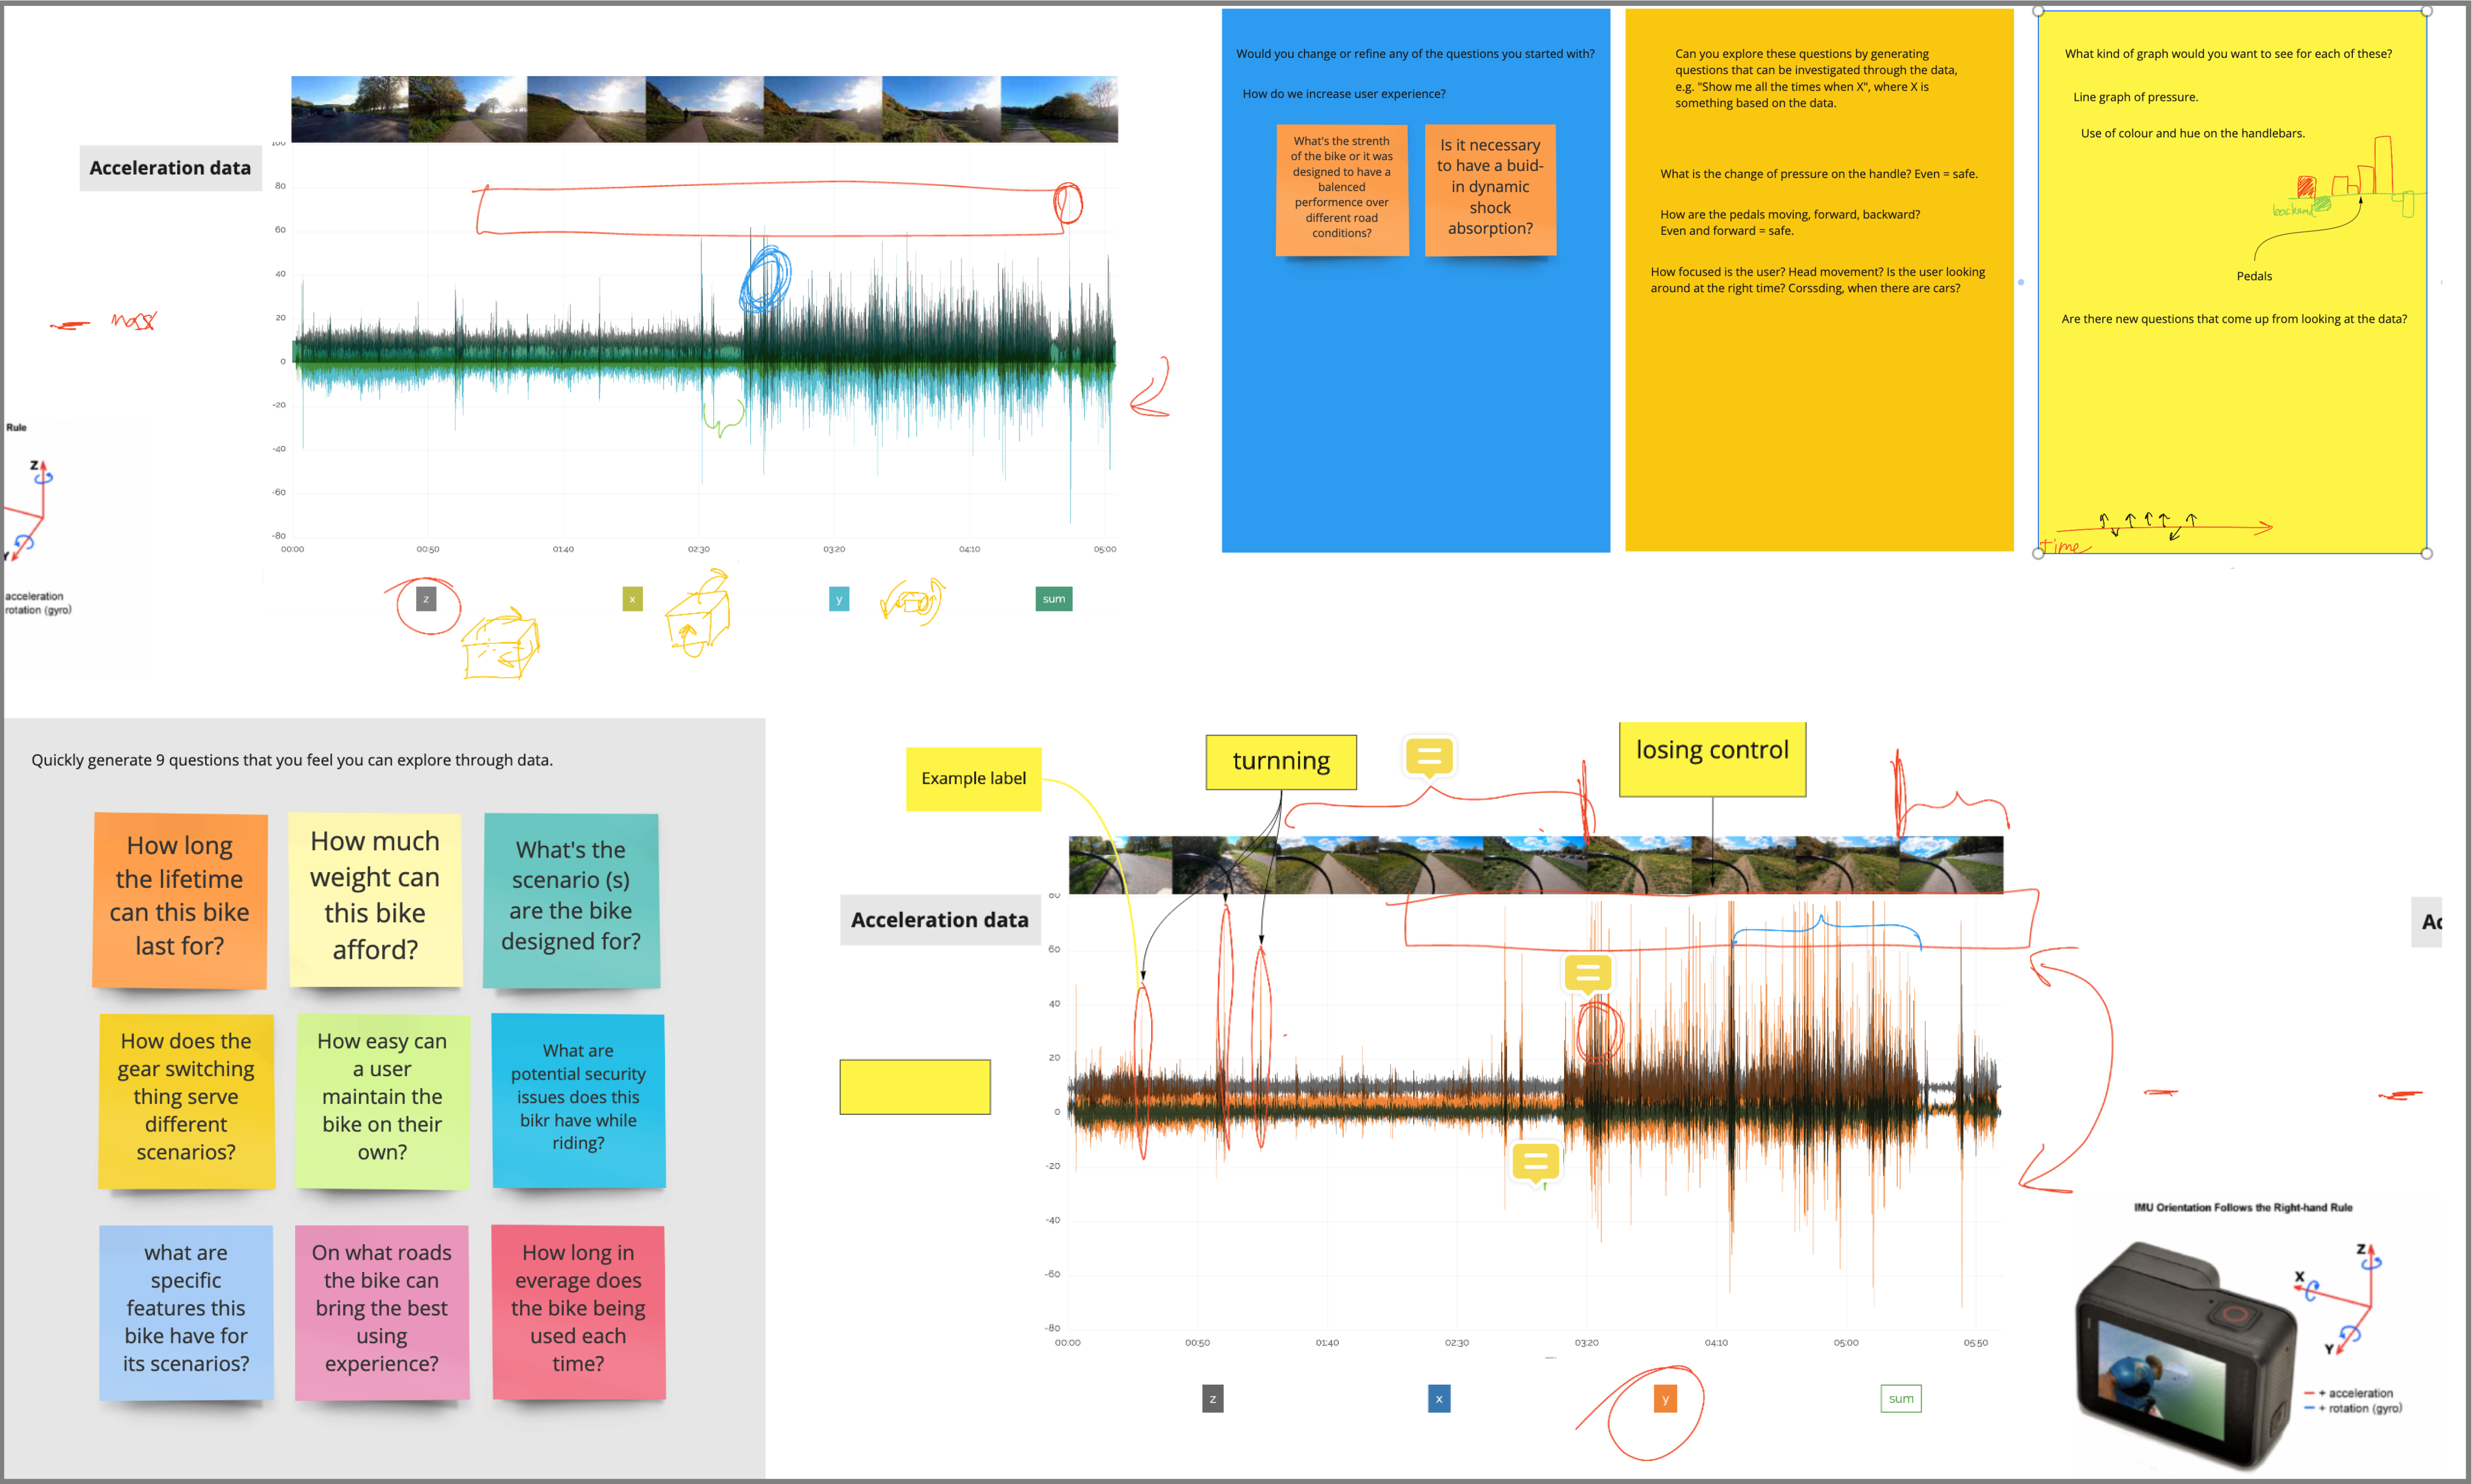
Figure 6. Selected work from P7, showing engagement with the time series graphs, interpretation and linking of axes, and a process of attaching meaning to the data and using that annotation to develop design oriented research questions. (Click on the figure to see a larger version.)
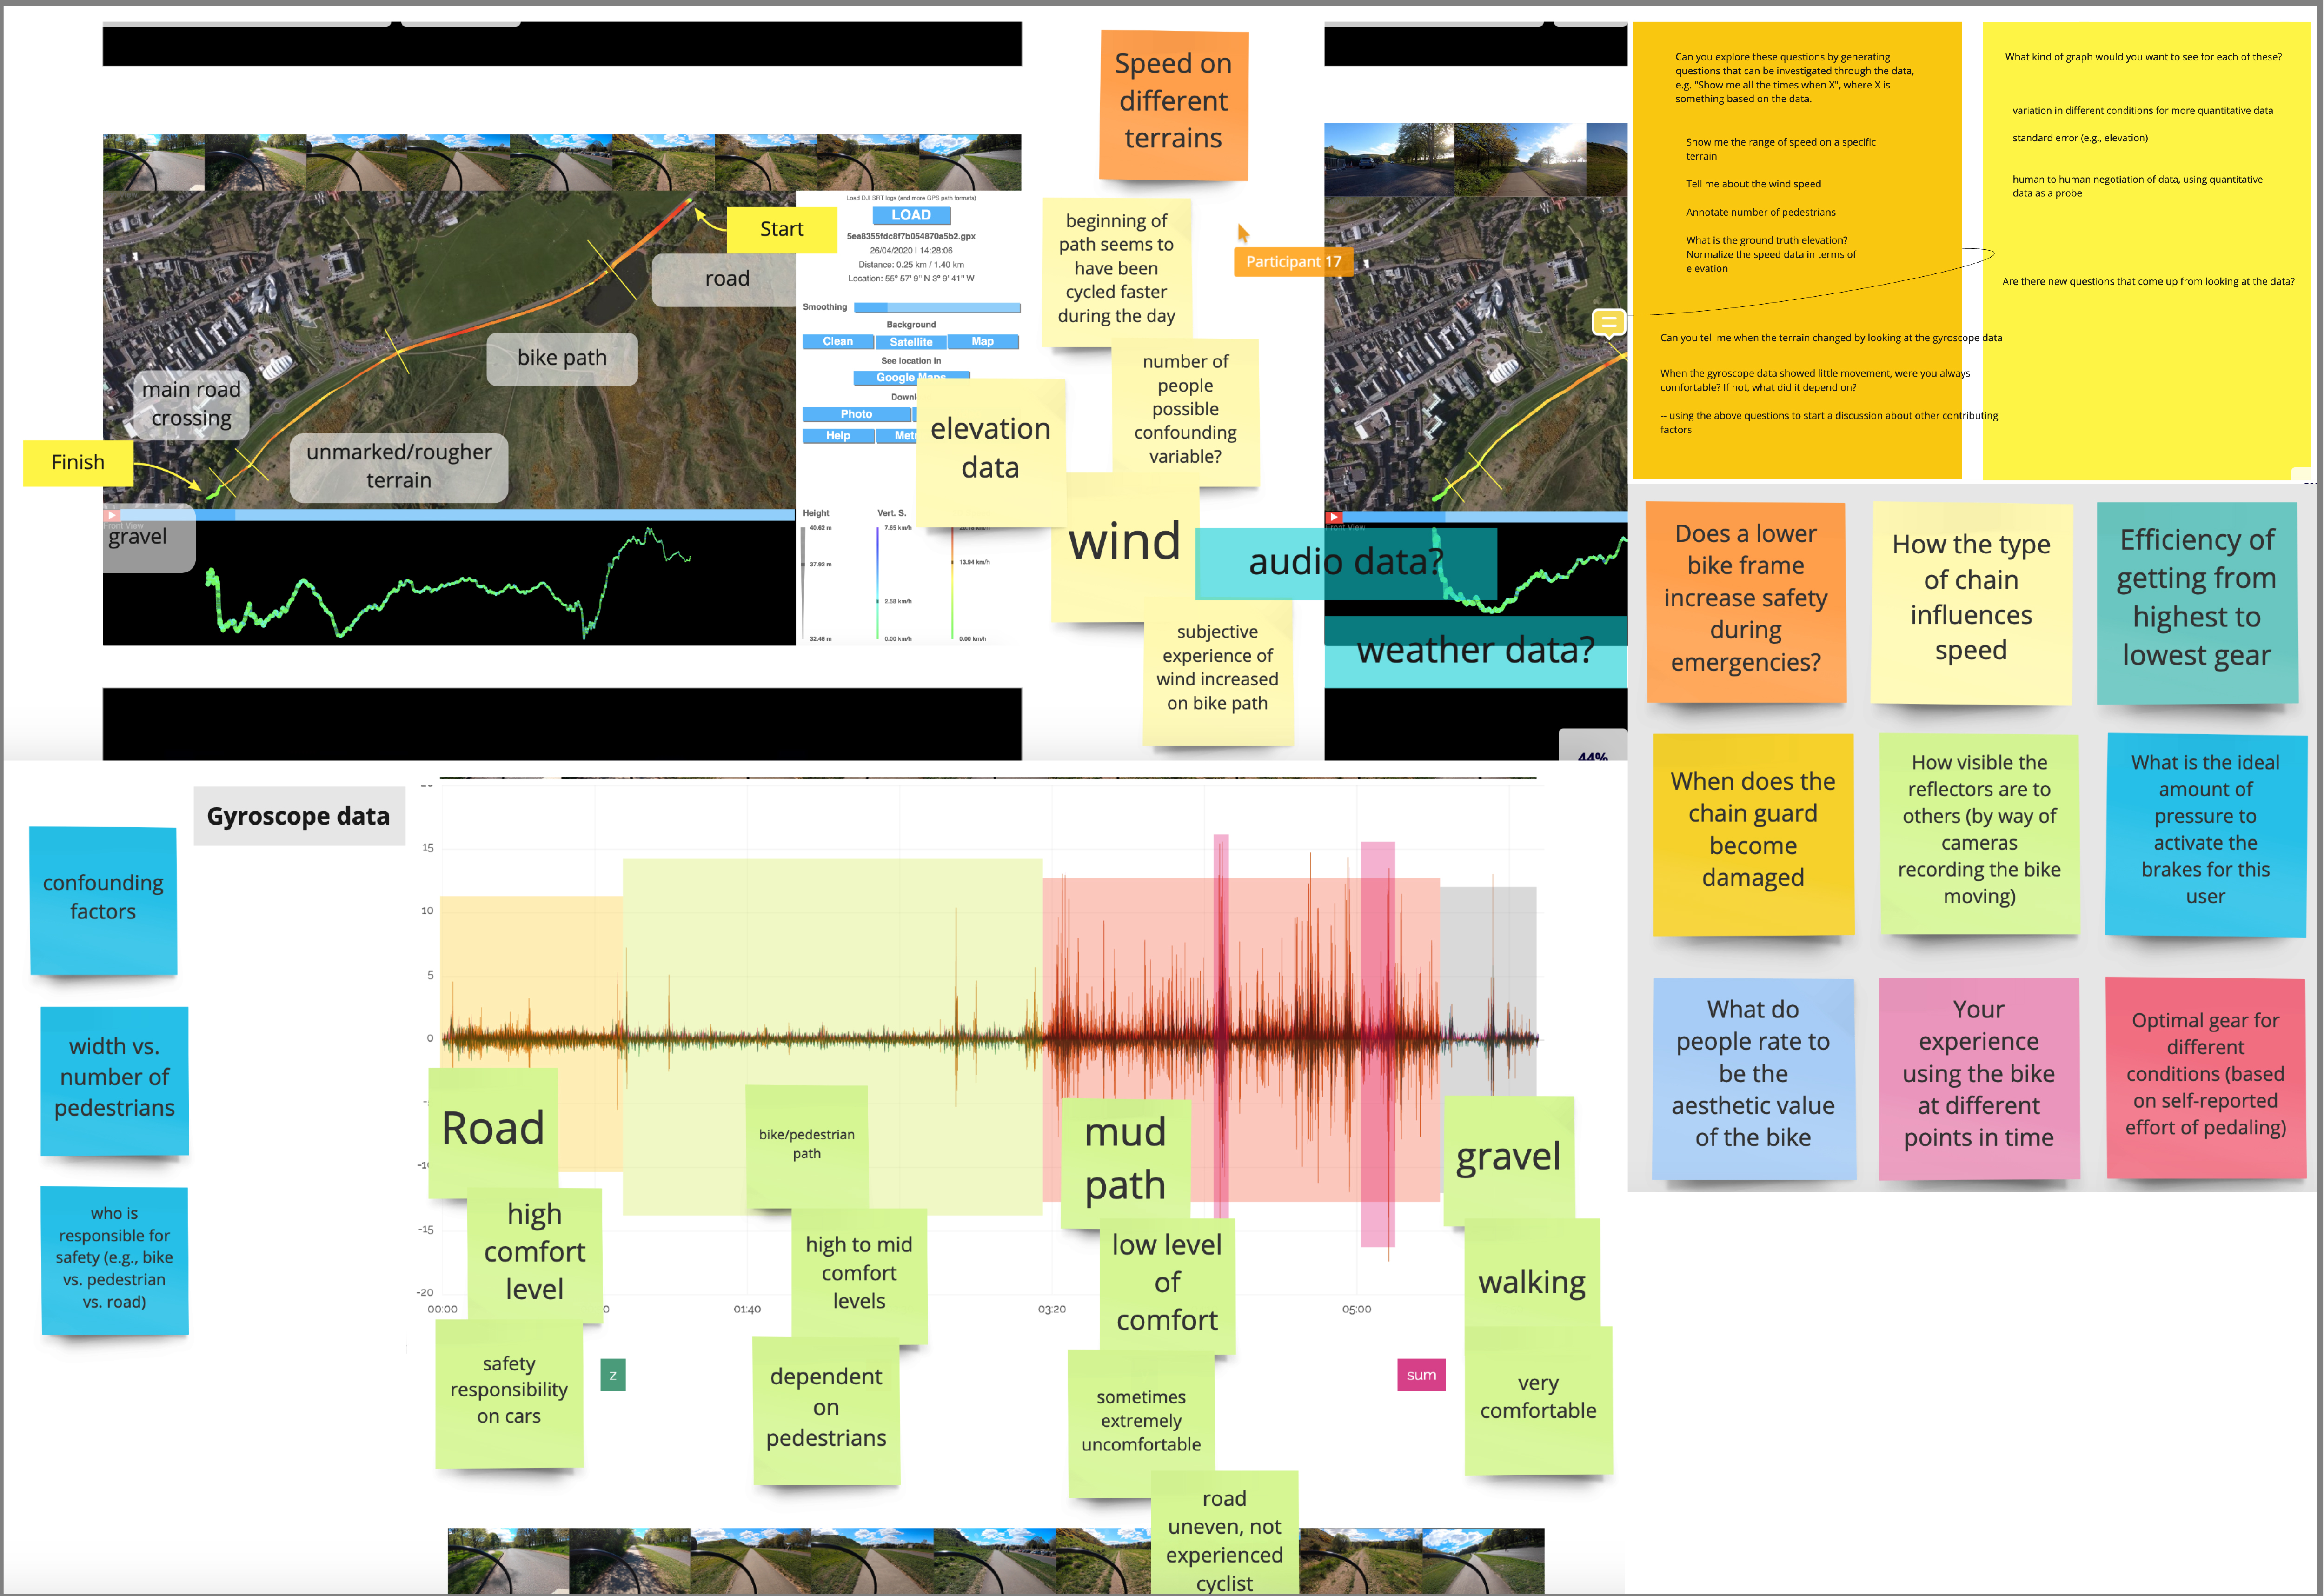
Figure 7. Selected work from P17, showing links made between geospatial overview and the time series accelerometer data, enhanced with responses from the rider around comfort. This is connected to the research questions on the right that shaped discussion. (Click on the figure to see a larger version.)
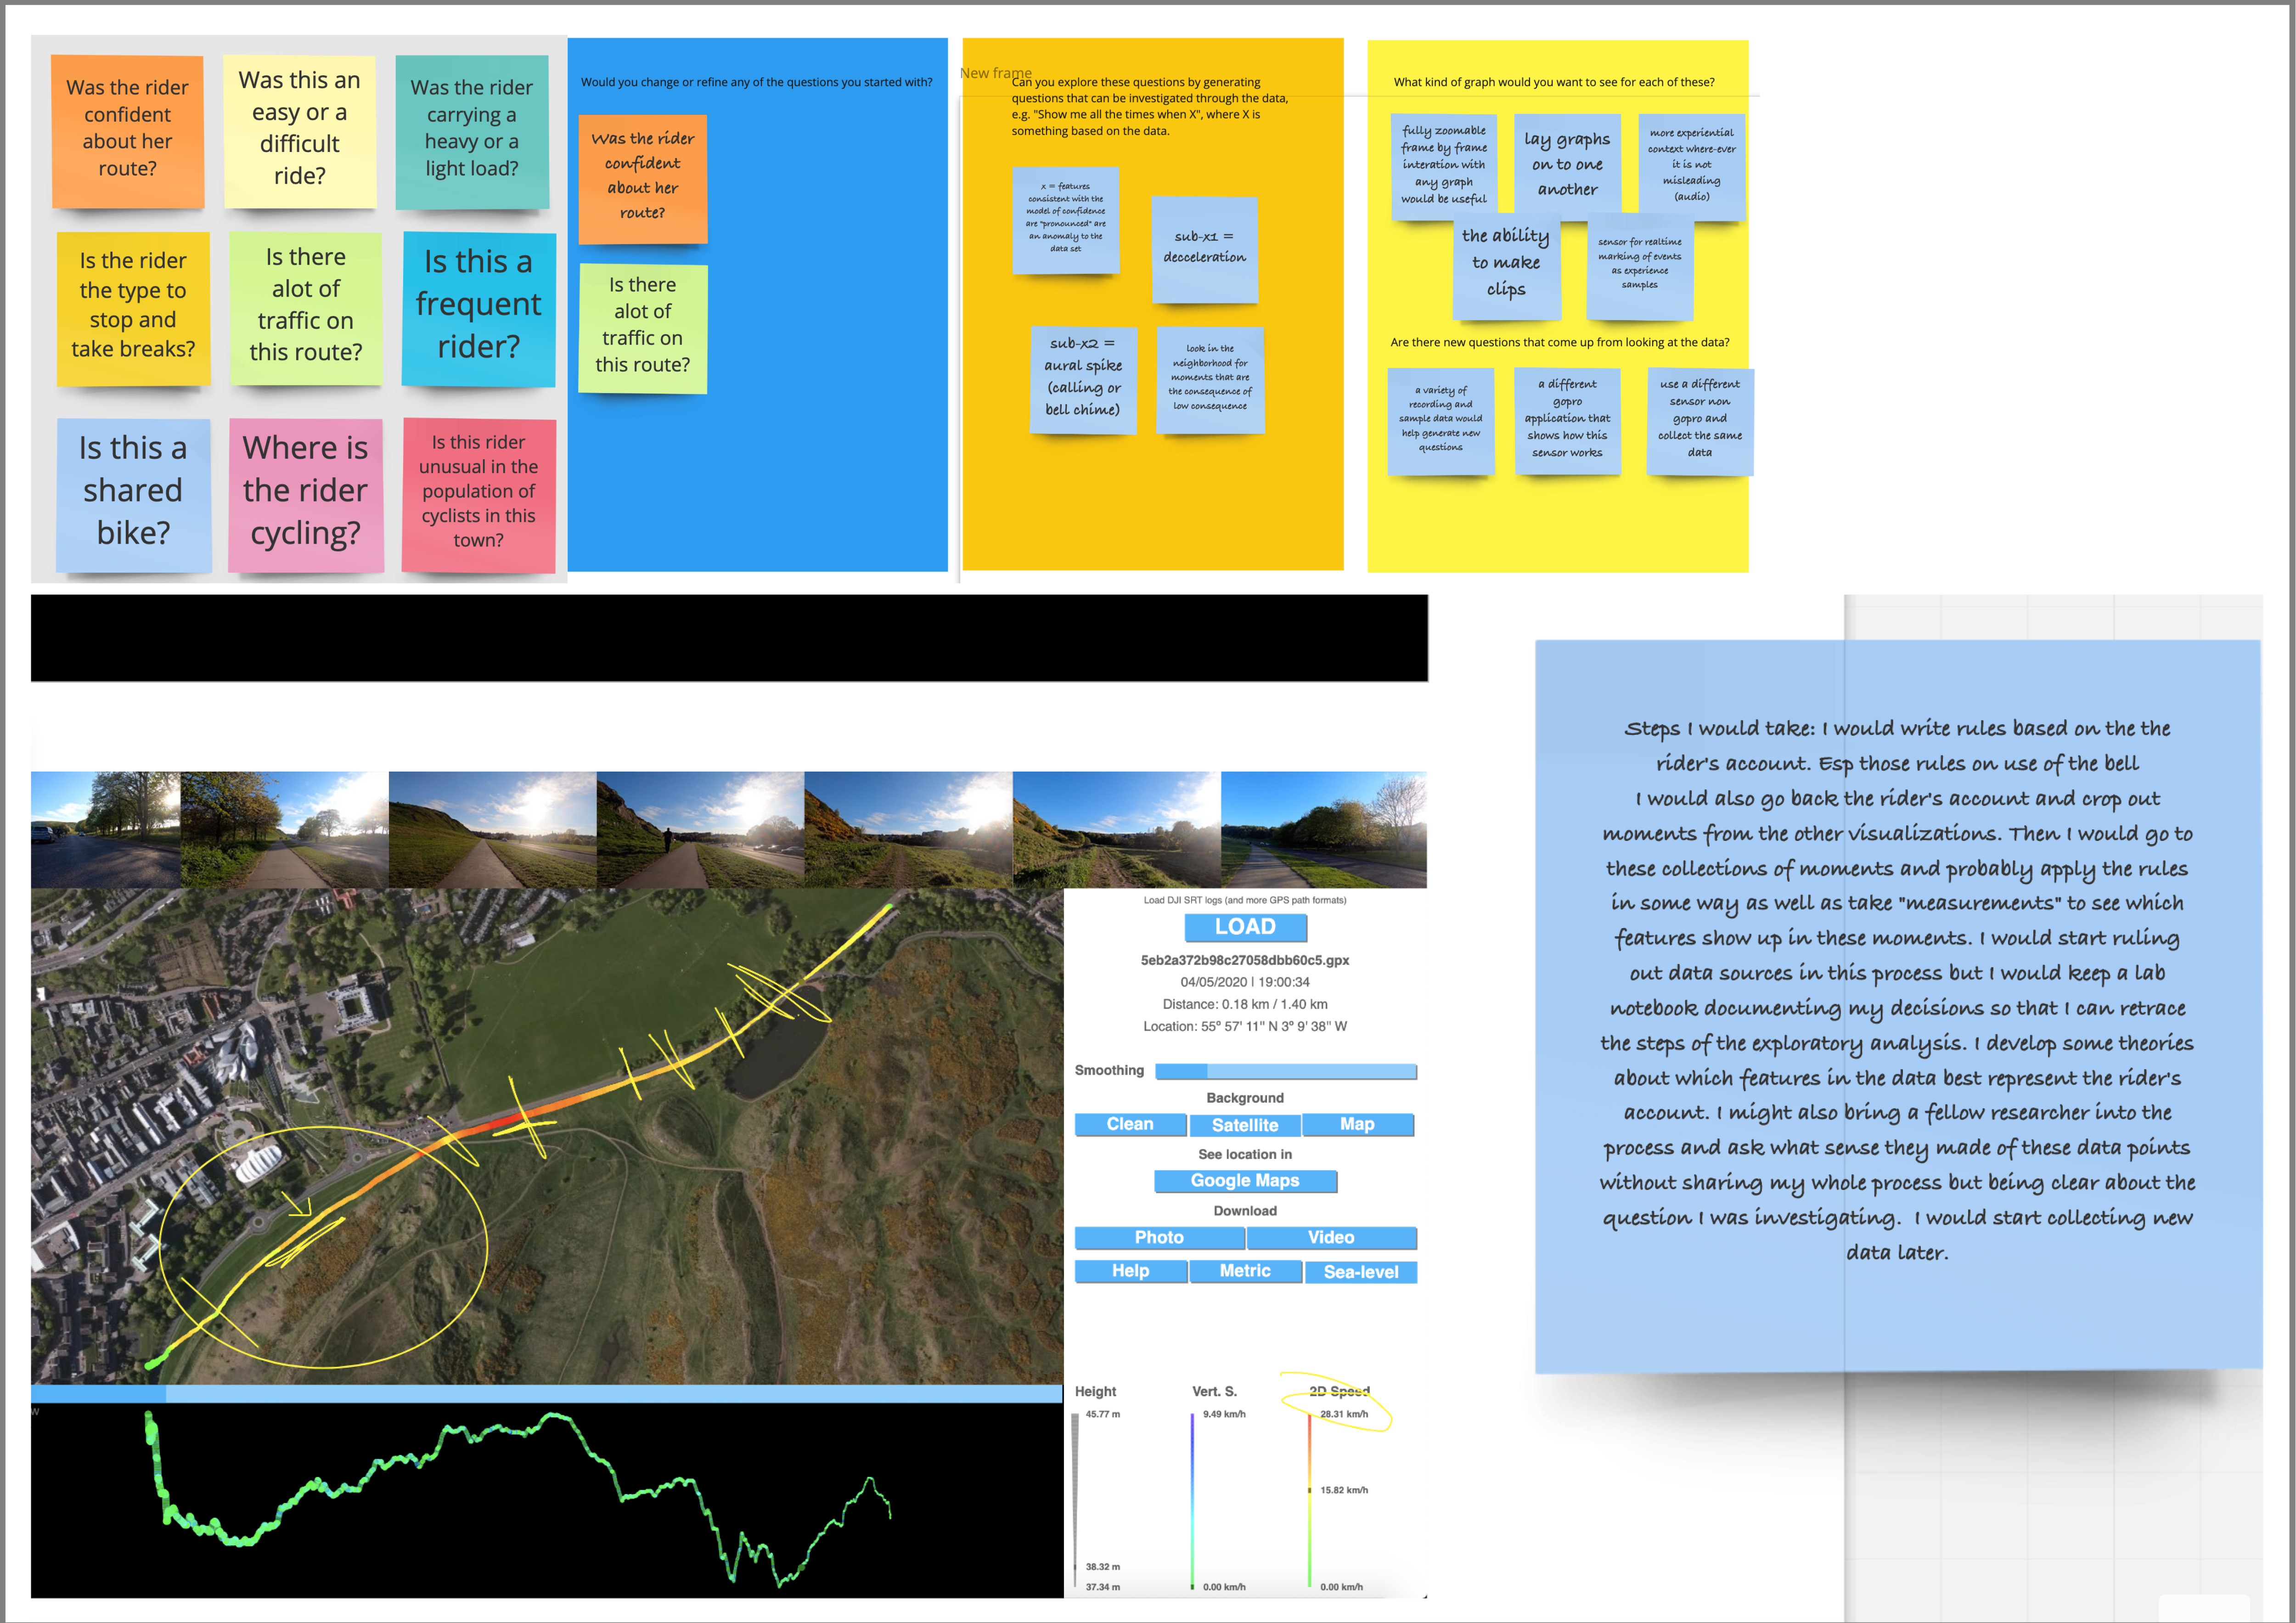
Figure 8. Selected work from P18, showing research questions and links between geospatial and telemetry data, accompanied with speculation about ways to make sense of the data and potential interface affordances. (Click on the figure to see a larger version.)
