Enhancing Desirable Food Behaviors by Increasing or Decreasing Disgust: Designing and Testing Infographics
Hendrik N. J. Schifferstein*, Mailin Lemke, and Niko J. H. Vegt
Department of Human Centered Design, Delft University of Technology, Delft, the Netherlands
For health and environmental reasons, humanity should reduce the consumption of animal-based products, whereas vegetable consumption should be increased. We created stimuli (drawings with texts) that may be able to increase or decrease the purchasing of mushrooms, cheese, and meat. During the design process, we identified four aspect categories (sensory, health, environment, moral) and we generated positive and negative examples for all products. In Study 1 we determined the familiarity, credibility and relevance of each aspect and measured emotional responses to them. In Study 2, we investigated to what extent four aspects combined in an infographic on a poster lessened or strengthened the emotional responses, purchase intention, and tendency to adapt behavior for the three products. Regression analyses showed that the emotional responses to the posters were well predicted by the responses to the product aspects. Purchase intentions were mainly affected by negative affect, while positive and negative affect seemed equally important for people’s intention to change behavior.
Keywords – Communication Design, Health Intervention, Design for Emotion, Research through Design, Experimental Research.
Relevance to Design Practice – The research sketches a new role for design as part of experimental research, thereby contributing to the external validity of psychological research.
Citation: Schifferstein, H. N. J., Lemke, M., & Vegt, N. J. H. (2023) Enhancing desirable food behaviors by increasing or decreasing disgust: Designing and testing infographics. International Journal of Design, 17(3). 41-61. https://doi.org/10.57698/v17i3.03
Received May 31, 2023; Accepted November 21, 2023; Published December 31, 2023.
Copyright: © 2023 Schifferstein, Lemke, & Vegt. Copyright for this article is retained by the authors, with first publication rights granted to the International Journal of Design. All journal content is open-accessed and allowed to be shared and adapted in accordance with the Creative Commons Attribution 4.0 International (CC BY 4.0) License.
*Corresponding Author: h.n.j.schifferstein@tudelft.nl
Rick (H.N.J.) Schifferstein obtained an MSc in human nutrition and a Ph.D. on taste psychophysics in 1988 from Wageningen University. Subsequently, he worked on sensory perception and consumer behavior at Wageningen University and TNO Food and Nutrition Research. In 2000, he transferred to Delft University of Technology, where he holds a position as Associate Professor. His interests include (multi)sensory perception, food design, and experience-driven innovation. He contributed to 100+ papers in international scientific journals, including Acta Psychologica, Food Quality and Preference, Materials & Design, and International Journal of Design. He is principal editor of the International Journal of Food Design and co-editor of 4 books. He is the founder and director of the Food & Eating Design Lab https://delftdesignlabs.org/food-design/, in which staff members and design students work together to improve people’s interactions with their daily foods.
Mailin Lemke was trained as a designer at the Universities of Applied Sciences in Dortmund and Mainz (Germany), where she specialized in graphic design and scenography. She worked as a communication designer in Cologne, followed by a Ph.D. (2018) and postdoc at the School of Design, Victoria University of Wellington, New Zealand. In 2019, she started a postdoc at Delft University of Technology in the Netherlands. Her work as design researcher focuses on behavior change design applications in the intersection of physical and digital user experiences. Her academic work encompasses designing products and media design solutions for vulnerable users and users with specific health requirements. In Delft she explored the role of disgust in behaviour change designs and studied the role of electronic devices among people who eat alone. She currently works for design agency dreiform in Cologne as a project manager and user experience designer focusing on the intersection of spatial and graphical design applications.
Niko Vegt graduated with an MSc in Industrial Design from Eindhoven University of Technology, the Netherlands. In June 2018, Niko received a Ph.D. on the design and application of game elements in teamwork at Delft University of Technology. After obtaining his Ph.D., he contributed to several research projects on obesity stigma, healthy lifestyle education, and eHealth. He currently holds a double postdoctoral position at the faculty of Industrial Design Engineering of Delft University of Technology and at the Erasmus School of Social and Behavioral Sciences of Erasmus University Rotterdam. His research typically follows a participatory research-through-design approach on the intersection of social sciences and design practice. His design interest focuses on co-creation through gaming and interactive storytelling. In his current work, he develops methods and tools that enable youth participation in research and development projects.
Introduction
The current food system in developed countries is under criticism, as it leads to welfare diseases and is unsustainable on the long term (Willett et al., 2019). Therefore, we see more and more initiatives that try to discourage the consumption of some food products (e.g., meat, dairy) while promoting the use of others (e.g., insects, vegetables, plant-based meat alternatives, mushrooms, algae). And although we can already see a shift in the consumption of animal products to vegetable products, there is still a long way to go to achieve sustainability goals.
Although much attention has been dedicated to the content of the information that is communicated to the public, less attention has been given to the form in which it is communicated. Information is available either in text or photos and videos, but what is the most effective way of convincing people to change their habits? Besides educating the public in order to persuade them to change their behavior, the emotional impact also needs to be addressed (Dijkstra & Buunk, 2008; Strömmer et al., 2020). Several negative emotions have shown potential as triggers for behavioral change, such as guilt, shame (Kranzbühler & Schifferstein, 2023), and disgust (Schifferstein et al., 2023) because people will try to avoid the negative feelings associated with these emotions.
Disgust
In the present study, we focused on disgust as a target for changing the appreciation for different food products as an incentive for behavior change. Disgust is a food-related emotion that entails the “revulsion at the prospect of oral incorporation of an offensive object. The offensive objects are contaminants; that is if they even briefly contact an acceptable food, they tend to render that food unacceptable” (Rozin & Fallon, 1987, p. 23). We chose disgust as it can be evoked by more cognitive ethical/moral deliberations as well as more instantaneous bodily responses (Kelly, 2011; Rozin & Fallon, 1987), and, thereby, it could become a powerful basis for developing interventions that reduce undesirable food behaviors.
Disgust can vary from mild dislike to loathing (Paul Ekman Group, 2022). Disgust can be triggered by sensory properties of an object, ideational concerns because of what the object is, where it has been and what it has touched, and an anticipation of harm following consumption (e.g., social or bodily harm) (Haidt et al., 1997; Rozin & Fallon, 1987). The effect of encountering a disgusting stimulus is commonly followed by rejection and is explained as a disease avoidance system (Curtis et al., 2011). However, there are also stimuli that evoke a level of disgust that attracts attention rather than resulting in rejection. This includes the domains of art and literature as well as food (Korsmeyer, 2011; Lemke & de Boer, 2022). For example, consumers can enjoy eating cheese with a strong and pungent smell as part of cultivating their taste (Korsmeyer, 2011).
Although researchers have tried to unravel the determinants of disgust and the mechanisms by which it may be elicited (Haidt et al., 1994; Hartmann & Siegrist, 2018; Olatunji et al., 2008; Strohminger, 2014; Tybur et al., 2009), this knowledge is only of limited use to designers who want to create concrete interventions. The insights revealed in academic studies tend to be of a general nature, while the quality of design is determined to a large extent by the way in which details are shaped (Gaver, 2014; Schifferstein, 2023). Designers need insights that are specific to a context or product, and concrete examples can be more insightful than abstract theories (Cross, 1982). In the current paper, we explore how designers can systematically create interventions that elicit specific degrees of disgust that may assist people in eating healthier or more sustainably, and we determine how the public evaluates them.
Intervention Design
When designing behavioral interventions, the form in which information is presented is an important determinant of whether the intervention has a good chance of becoming successful. An exploratory study using realistic packaging designs (Schifferstein et al., 2022) suggested that the optimal medium for communicating messages on sensory appeal, health aspects, environmental impact, worker conditions, and production location differed substantially between topics. While sensory aspects were best communicated through stylistic elements, worker conditions preferentially used images, while health and environmental aspects were best communicated through verbal claims. Even after the team had dismissed the use of images of body parts to communicate perceived healthiness because they were judged offensive, the use of other images with a positive connotation (e.g., active athletes, healthy bacteria) was also found to have a negative effect on the perceived healthiness of products.
Currently, we see a trend towards more visual ways of presenting information (Siricharoen, 2013; Siricharoen, W. & Siricharoen, N., 2015). For instance, we see more and more meetings in which drawing artists are involved in making visual summaries instead of or next to making minutes (Dean-Coffey, 2013; Mitchell & Nørgaard, 2011). Analogously, drawing artists may make infographics instead of textual summaries that visualize a whole problem to facilitate knowledge transfer (Dunlap & Lowenthal, 2016; Hilderink et al., 2021). Also, some conferences now allow for visual papers as a separate category for submissions (e.g., https://epde.info/2023/visual-papers-track/), and some publishers stimulate the inclusion of graphical abstracts with research papers (Hendges & Florek, 2019; Yoon & Chung, 2017). Therefore, we chose a visual presentation format to see how such presentations could be designed and how the visual format would affect the perception and evaluation of disgusting aspects. In this respect, both designer and researcher observations would be interesting, together with participant evaluations and responses.
The current article is part of a plea to use more realistic experimental materials in psychological studies (Schifferstein, 2023). Psychological theories usually try to reveal mechanisms by describing the relationships between theoretical constructs. These relationships are investigated and tested in experiments for which stimuli that embody these constructs are developed. However, because the constructs are theoretical and stem from reasoning, the stimuli are often verbal, and sometimes little attention is paid to the way these constructs are operationalized when they take physical form. Consequently, stimuli may be unrealistic, even though the operationalizations are crucial to the external validity of the study. Often, the creation of stimuli is regarded as preparation for the main experiment, and the creation process is only briefly described, with reference to an expert involved or software used, possibly with additional information on the criteria used in the selection process. Some studies do not include examples of stimuli in their reports, even though image attributes, such as style, quality, color palette, and viewing angle, can all influence participant experience. Therefore, we propose that psychologists involve designers more in their research to improve the validity of their findings and gain additional insights into how people perceive their stimulus materials.
The Present Study
Below, we describe our design process for infographics and the test procedure we used to evaluate stimuli. Our approach differs from the typical research paper by considering the design process as an integral part of the research. Following the ideas of research-through-design (Stappers & Giaccardi, 2014), we assume that the design process itself can generate information that is useful for understanding the mechanisms investigated, i.e., using disgust to increase or decrease the popularity of foods. The defining characteristic of research-through-design is the idea that a creative process, by its very nature and through its various activities, can generate new knowledge and insights. Besides using empirical research (surveys, interviews, observations) to investigate specific experiences from stakeholder groups as input for design, important insights may appear through the activities of a design team. Because designers are trained in human communication and may be part of the stakeholder group or can empathize with them, the design team can generate important insights through the process of creation, not only for the next steps in the design process but also for understanding the phenomenon the team would like to investigate and influence (Dalsgaard, 2017). Therefore, we describe the creative process that we went through as authors, as researchers who designed the stimuli and setup of the study, as an integral part of the research process. We first followed an exploratory design process in which we brainstormed for different design stimuli. Subsequently, we created and refined the different drawings that were used as stimuli in this study (Krogh et al., 2015). Because this creative process adds to our understanding of the phenomenon, we integrate and describe the design process in our deliberation rather than performing a strict pretest commonly used in controlled studies to select stimuli that must meet a set of predetermined theoretical criteria.
Method
We first describe the design process, followed by the empirical evaluation of the materials. The evaluation process consisted of two studies focusing on the perception of individual product aspects (Study 1) and the evaluation of posters containing four aspects (Study 2).
Design Process
The team of design researchers who set up the study, performed the brainstorming, and designed the stimuli consisted of a senior researcher and two postdocs. As shown in the authors’ biographies, the team has ample expertise in the fields of food product experience, product design, and the emotion of disgust. The senior researcher has over 30 years of experience in the food realm and over 20 years working with designers. The postdocs were trained as designers; both obtained a Ph.D. in design research in 2018 and have worked on design research projects ever since. Furthermore, the group has published five academic papers on the role of disgust in food experience in recent years (De Boer & Lemke, 2021, 2023; Lemke et al., 2021; Lemke & de Boer, 2022; Schifferstein et al., 2023). Therefore, the team seems well equipped to design a new study—including the stimulus materials—on how people respond to events that may evoke disgust in food experiences to varying degrees.
The team performed four different activities as part of the design process. Activity 1 was aimed at generating an extensive set of disgust aspects to get the most complete situational understanding of disgust elicitation. In Activity 2, this comprehensive set was clustered in themes, which led to the feasible goal of visualizing four aspects that increase disgust and four that reduce disgust. In Activity 3, we used an iterative process to develop visuals. In the research team, we discussed whether all elements on the drawings were clearly depicted, whether more details were needed, and whether colors had to be added to increase the meaning of the drawing. In Activity 4, the positive and negative visualizations were combined in food product infographics to serve as stimuli for our study on disgust elicitation and the resulting behavioral intentions.
Activity 1: Generating Disgusting Aspects for Different Food Products
For various products for which society would like to increase or decrease consumption for sustainability or health reasons (e.g., bean sprouts, mushrooms, insects, red meat, cheese, lobster), we brainstormed aspects that can be disgusting or reduce disgust. We selected three products (mushrooms, cheese, and meat) for which a diversity of aspects could be connected to disgust positively or negatively and differed in their relationships to sustainability and health. We aimed to have one product for which we wanted to increase and one for which we wanted to reduce disgust. Red meat is seen as polluting and unhealthy, cheese as a dairy product was in the middle, and mushrooms were included because they are seen as a healthy and sustainable alternative to meat (Pérez-Montes et al., 2021).
We observed that it was hard to distinguish between aspects that enhanced or decreased disgust and aspects that were just evaluated as pleasurable, purposeful, and hopeful. Therefore, we wondered whether we could manipulate the degree of disgust or whether we were manipulating negative and positive affect as broader, overall encompassing constructs. For positive aspects, it would be difficult to distinguish between decreasing disgust and evoking positive affect because disgust does not have a well-defined positive counterpart (Rozin & Fallon, 1987). Although some positive emotions, like fascination, may have something in common with disgust (Schifferstein et al., 2023), such overlaps may only be partial. Because many emotional responses tend to be correlated (e.g., Cardello et al., 2012), the connection between disgust and negative affect is probably close. To determine whether our manipulations affect disgust or affect in general, we will compare the effects on all these dependent variables (disgust, positive affect, negative affect) in our analyses.
Activity 2: Structuring Information and Adding Opposites
Based on the initial set of positive and negative aspects, we explored answers to the following questions in a more structured fashion: “What makes the product disgusting/delicious?”; “How can we make the product more disgusting/delicious?” After making an overview of all aspects of each product, we looked for thematic categories that would apply to all three products. Defining specific thematic categories allowed us to make comparisons over products and determine how these themes work out for different products. This eventually led to the following four categories: sensory experiential, hygiene & health, environmental, and moral. We clustered these into two basic categories of bodily disgust (sensory and health-related) and cognitive disgust (environmental and moral). The bodily disgust categories have a link with someone’s body, either in terms of pleasure/displeasure (sensory experiential) or consequences for one’s physical health and potential bodily suffering. For the cognitive disgust categories, the main implications lie outside the personal human body and require reasoning. It addresses the support or distress of other people, animals, or plants and may also involve a bigger perspective on society or the planet. For each category, we brainstormed one or more disgust increasing and reducing aspects for each product.
We have selected four themes due to the lack of a generally agreed framework of disgust elicitors with clear boundaries (Strohminger, 2014). The four categories were sourced from common theories of disgust (Kelly, 2011; Rozin & Fallon, 1987; Rozin et al., 1999; Tybur et al., 2009), conceptual frameworks of disgust stimuli (Lemke et al., 2021; Strohminger, 2014), together with considering the factors that people find important when purchasing food products (e.g., Furst et al., 1996; Lappalainen et al., 1998; Prescott et al., 2002; Rana & Paul, 2017). First, sensory characteristics have often been identified as one of the main drivers of consumer preferences for food (e.g., Furst et al., 1996; Glanz et al., 1998). Any food that does not taste good is unlikely to become a success in the market. Disgust is closely related to the experience of distaste, and many sensory stimuli have been found to elicit disgust responses (Strohminger, 2014). Second, hygiene considerations are essential in food production as they are a primary determinant of food quality, food safety, and product shelf life. Analogously, potential sources of disease (e.g., microorganisms, insects, rodents) are powerful elicitors of disgust. Not only the short-term effects of becoming ill but also the consequences of human nutrition in the long term are important factors for food purchasing (Furst et al., 1996; Lappalainen et al., 1998; Rana & Paul, 2017; Schifferstein & Oude Ophuis, 1998), and images of bodies or body parts with signs of disease or overeating are known to elicit disgust (De Boer & Lemke, 2021; Kelly, 2011). While sensory preferences are partly based on an innate factor (Steiner, 1973) and have determined food consumption since time immemorial, and while food hygiene and health considerations have been a major concern for public health for over 70 years (Breedveld & Bast, 2014), a relatively new factor that has emerged in food considerations with rising concerns about the effects of industrial production and human life in general on the planet’s ecosystem is sustainability (Willett et al., 2019). When considering sustainability issues, consumers not only consider the environmental impact of food products, but also the consequences for animal welfare (Izmirli & Phillips, 2011; Statista Research Department, 2016) and the social and economic impact on worker conditions and local communities (Basiago, 1998; Pullman et al., 2009). The rise in sales of organic products (Willer et al., 2023) and plant-based alternatives (Ethical Consumer, 2021) and the increasing number of people who adhere to a vegetarian or vegan diet in affluent Western countries (Saari et al., 2021) underlines the rising importance of these considerations. For the present study, we have considered the environmental impact apart from the other consequences, which we designate here as moral consequences. Morality implies that some behaviors are considered proper while others are wrong. Moral disgust occurs when people experience or even think about moral violation. Such moral violations can include condemned behavior like animal cruelty (Giner-Sorolla & Chapman, 2017) and seemingly unharmful behavior of being treated unfairly (Chapman et al., 2009). Events that clash with what is considered as good taste in a specific culture can also elicit disgust (De Boer & Lemke, 2021).
Activity 3: Visualizing Aspects
To explore the effects of different types of triggers, we decided to develop a set of drawings that could be combined in an infographic. We used drawings to communicate all product aspects, because visual explorations in a previous study had shown that more abstract, cartoonlike drawings can be acceptable to consumers in cases where realistic pictures are not (Schifferstein et al., 2022). Illustrations are more abstract than photographs, and this may affect their suitability for promoting specific products (Septiantoet al., 2019). Abstraction reduces the degree of realism and tends to coincide with an increased perceived psychological distance between the person and the object in the drawing (Trope & Liberman, 2010). That is why the use of a more abstract visual style might provide a protective frame that makes the connection less confronting (see Fokkinga & Desmet, 2012). As a result, drawings of insects on the packaging of insect foods more often lead to favorable evaluations than photographs (Nicolas-Hemar et al., 2023). Other studies have shown that using black and white instead of colors encouraged people to focus on the abstract, essential features of a stimulus instead of the concrete characteristics (Lee et al., 2016). Moreover, using illustrations can have an extra positive advantage because they are seen as more creative and more distinctive than photographs in advertising (Heiser et al., 2008). Line drawings usually are more ambiguous and allow more diverse interpretations than realistic pictures. For instance, drawings of people may not specify the gender or race of a person and may, therefore, allow more people to identify with the character in the image. Furthermore, contextual elements can be omitted, so that the image can apply to multiple cultures. Septianto et al. (2019) found that illustrations were more effective in promoting organic foods, while advertisements with photographs yielded higher purchase intentions for conventional foods, probably because both illustrations and organic food made participants think more abstractly and focus on the essential. Photographs, on the other hand, are more compelling and effective than illustrations in situations that require detailed representations, for instance when trying to evoke vivid mental simulation (Wu et al., 2021). Overall, as changing behavior requires more abstract deliberations, we think drawings provide a more suitable medium to persuade people to re-evaluate their food habits than detailed photographs.
Our designer created a drawing for each aspect within a category for each product. She looked for aspects that could be visualized within the constraints of a poster that could be used in a public campaign. In combination with the line drawings, we used handwritten text to establish visual unity with the line drawing. Handwriting humanizes communication and can be part of a strategy to create an emotional connection with consumers to enhance attachment to the product (Schroll et al., 2018). The text element consisted of two to six words to allow a similar height of the words on the infographic. We avoided adjectives and adverbs that potentially biased the viewer in a positive/negative way (e.g., mentioning aspects to be dirty or clean). Parts of the drawing were colored in blue, white, dark grey, dark brown, light brown, and lime shade to clarify the meaning and emphasize certain elements. The drawing was closely related to the text and reiterated the intended meaning by concretizing and exemplifying its meaning (Marsh & White, 2003).
Activity 4: Creating Infographics
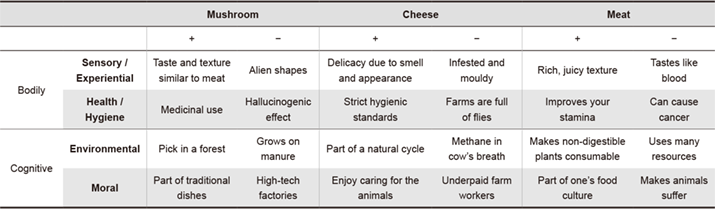
The infographics consisted of a drawing of the food product in the center and drawings expressing either a positive or negative aspect for each of the four aspect categories. We made four infographics for each food product: one with 4 positive aspects, one with 4 negative aspects and two infographics with 2 positive and 2 negative aspects. Combinations were a) bodily and cognitively pleasant, b) bodily disgusting and cognitively pleasant, c) bodily pleasant and cognitively disgusting, d) bodily and cognitively disgusting. For the infographics with 2 positive and 2 negative aspects, we made sure that the 4 aspects did not produce a potential conflict (e.g., high tech production and used in traditional dishes). In addition, we made sure that aspects that could apply to multiple food products (e.g., caring for animals for meat and cheese) were used only once. Elements with the same valence were always presented in opposite corners, not on the same side of a panel. The background of the infographic included a grey area to create sufficient contrast with the drawings and text elements. The 24 aspects we used can be found in Table 1.
Table 1. Description of product aspects used in the studies.
Design Evaluation
We wanted to determine whether people are likely to change the way they perceive different products and change their behavior after seeing a poster that highlights several product aspects. In Study 1, we assessed how people perceived each of the 24 aspects we generated (2 valence levels × 4 themes × 3 products). Given the aim to increase or decrease the amount of disgust associated with products, ideally, a product aspect should either rate very high or very low in disgust and be convincing to participants. Hence, in the first study, we asked participants to indicate which emotions the product aspects evoked and to evaluate whether the aspects were familiar, credible, and relevant. In Study 2, we determined the effect of a set of aspects (combined in an infographic) on its potential impact on eliciting disgust and people’s motivation to change consumption behaviors. An overview of the studies is provided in Figure 1.
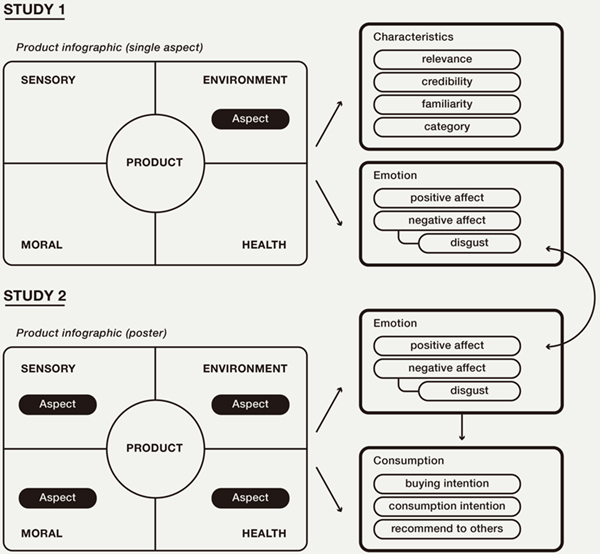
Figure 1. Contents of the studies and their relationships.
Study 1: Perception of Individual Product Aspects
Participants
The study was completed by 429 participants who were born and lived in the U.S., who did not follow any diet, and who were recruited through the Prolific panel. The sample consisted of 45.9% women, 51.5% men, and 2.6% unknown, of whom the majority (77%) were Caucasian. As we were interested in the effects on the consumption of mushrooms, cheese, and meat, we only used responses from people who consumed all these products at least once a month.
Stimuli
For each product (mushroom, cheese, meat), we created one drawing with a positive and one with a negative aspect for each of the four categories (sensory experiential, hygiene & health, environmental, and moral), yielding eight images per product. In the stimulus, a drawing of the product was in the center, and a product aspect was presented in one of the four corners of the drawing (see Figure 2). An overview of all 24 aspects can be found in Appendix A. Although in the study setup we mainly had red meat in mind, in the materials we only used the term meat. Each participant evaluated one aspect per product, hence three aspects in total. This generated 50-54 responses per product aspect.
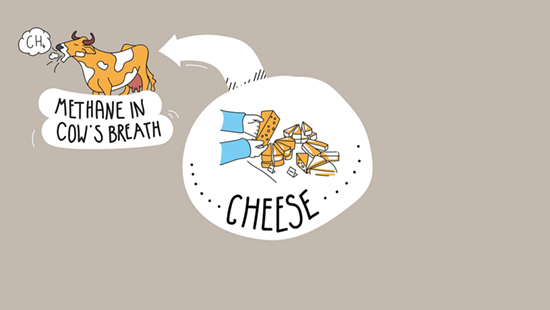
Figure 2. Example of one of the stimuli used in Study 1. The figure shows an aspect aiming to increase the perception of disgust in the context of purchasing cheese and highlights methane released into the air as the side product of cheese production due to the cow’s breath.
Procedure
A questionnaire was constructed in Qualtrics. After reading instructions and providing informed consent, participants indicated their consumption frequency of the three target products on a scale with 5 categories (never, about 1-2 times a month, about 1-2 times a week, about 4-5 times a week, daily). Participants who indicated never for one or more of the three products were removed from the study. Then, they saw a drawing with the text, “In this image you see a food product in the center and an aspect that is highlighted in one of the corners. To what extent does the product aspect in the corner make you feel the following emotions? This product aspect makes me feel...” They rated their response for the following 14 emotions (Laurens & Desmet, 2017): pride, shame, admiration, contempt, joy, sadness, hope, fear, anger, satisfaction, desire, disgust, boredom, and fascination on a 7-point scale with end anchors 1 = not at all to 7 = very much.
Then, they indicated whether they agreed with several statements regarding familiarity, relevance, and credibility of the aspects. They rated whether the image depicted a product aspect that “I am familiar with / I am aware of / Surprises me” (familiarity), “Is important to me / May have a large impact on people’s lives / I find irrelevant” (relevance), “I can easily imagine / I find believable / Is untrue” (credibility). In addition, we assessed the contribution to the four aspect categories: “This aspect makes the product tasty / healthy / environment-friendly / matches with my moral standards.” Subsequently, they evaluated whether the product aspect evoked a bodily response (Makes me feel sick) or a cognitive response (Evokes a lot of thoughts). Responses were recorded on a 7-point scale with categories “strongly disagree, disagree, somewhat disagree, neither agree nor disagree, somewhat agree, agree, strongly agree.” The presentation sequence of the three products (mushroom, cheese, meat) was randomized, and the selection of the product aspect was determined by chance. At the end of the questionnaire, participants could add any comments before they submitted their answers.
Study 2: Impact of Posters
Participants
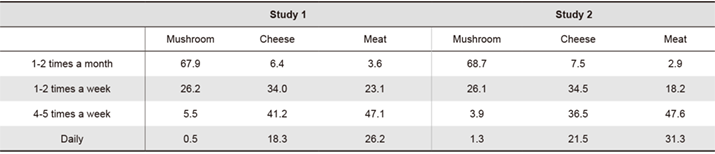
The study was completed by 307 participants who were born and lived in the US, who did not follow any diet, and who were recruited through the Prolific panel. None of these had participated in the previous study. The sample consisted of 45% women and 55% men, of whom 84% were Caucasian. We only used responses from people who consumed mushrooms, cheese, and meat at least once a month. Table 2 shows that the consumption frequencies in the two samples were highly similar: Participants often ate meat and cheese, but mushrooms were only eaten occasionally.
Table 2. Consumption frequencies of mushroom, cheese, and meat in the two samples.
Stimuli
We made 4 infographics for each product, showing the product in the middle surrounded by 4 drawings with product aspects. There were 4 conditions: 4 positive aspects, 2 positive (sensory & health) and 2 negative (environment & moral) aspects, 2 negative (sensory & health) and 2 positive (environment & moral) aspects, or 4 negative aspects. The infographics were presented in an image on a billboard, to enhance the realism of the scenario (Figure 3). Each participant evaluated one poster for each product, yielding 75-78 responses per poster.
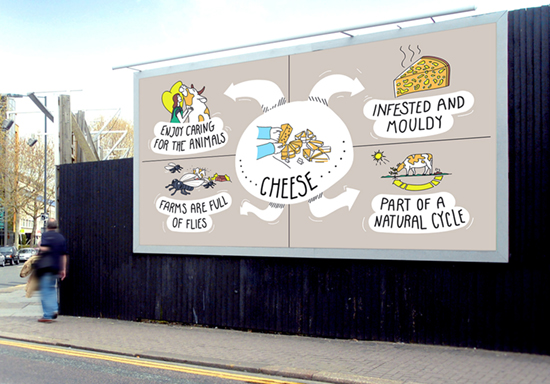
Figure 3. An example of a stimulus for cheese. It consists of two aspects that aim to enhance the disgust response (top right and bottom left quadrant) and two that aim to decrease it (top left and bottom right quadrant).
Procedure
Because the procedure and questionnaire were very similar to Study 1, equivalent details will not be repeated here. After indicating their consumption frequency of the three target products, participants were presented with the following scenario “You are planning a dinner for your family or friends. You obviously chose to make your favorite recipe. For this recipe you need mushrooms/cheese/meat. You go to the (super)market to buy it. On your way to the (super)market, you see this poster hanging.” Then they started with an open question: “In maximum 3 words, how would you describe your thoughts on this product, after seeing this poster?” To measure emotional responses, we presented the 14 emotions with the text “To what extent does the poster make you feel the following emotions?” Then we assessed possible effects on their behavior. First, they answered “Would you still buy mushrooms/cheese/meat for your recipe?” on a 7-point scale with 1 = highly unlikely, 4 = neither likely nor unlikely, and 7 = highly likely. Then “Do you think that seeing the poster is likely to increase or decrease your consumption of mushrooms/cheese/meat?” with 7-point scale 1 = eat much less, 4 = eat exactly as I did before, 7 = eat much more. “What would be the reasons for you to recommend this product to others (multiple answers possible): I think it is healthy / I think the product is environment-friendly / I like the taste / It matches with my moral convictions / other reasons, please specify / none of the above,” followed by the opposite question “What would be the reasons for you NOT to recommend it to others (multiple answers possible): I think it is not healthy / I think the product is not environment-friendly / I don’t like the taste / It clashes with my moral convictions / other reasons, please specify / none of the above.” Then they were asked “Overall, would you recommend others to buy the product?” with 5 categories “definitely not, probably not, maybe, probably yes, definitely yes.”
Data Analysis
In Study 1, we included multi-item measures of familiarity (3 items, Cronbach’s α = 0.73), relevance (3 items, α = 0.70), and credibility (3 items, α = 0.81), in addition to single items that characterized the categories of the different product aspects. In both studies we created a measure of positive affect (the mean of the 7 positive emotions, α = 0.95 in Study 1 and α = 0.93 in Study 2) and a measure of negative affect (the mean of the 7 negative emotions, α = 0.84 in Study 1 and α = 0.82 in Study 2). Furthermore, we performed analyses for the responses on the separate disgust item.
For all measures of emotional responses, we used regression analyses to determine the extent to which responses to the individual aspects (Study 1) can predict the response to the complete poster with 4 panels (Study 2). Because we did not present participants with all possible combinations of the 4 panels in Study 2, we always combined responses on the bodily categories (sensory and health) and the responses on the cognitive categories (environment and moral). These analyses were performed on group means because participants contributed only to one of the studies. For Study 2, we also used regression analyses to investigate whether emotional responses to the posters could predict the three behaviors connected to consumption. As these variables were measured for each participant, these analyses took individual variation into account (Figure 1).
To compare conditions, in some cases we used multivariate analyses of variance (MANOVA), followed by univariate analyses (ANOVA) per dependent variable. For the multivariate tests, we used F-tests for Wilks’ lambda. In the univariate ANOVA, we used Bonferroni correction to compare means in post-hoc paired comparisons. We used p < 0.05 as the critical value in all tests. To enable comparisons between products in Study 2, we disregarded that each participant had rated one panel for each product, and we assumed that responses for the three products were independent (between-participants design).
Results
Study 1: Product Aspects
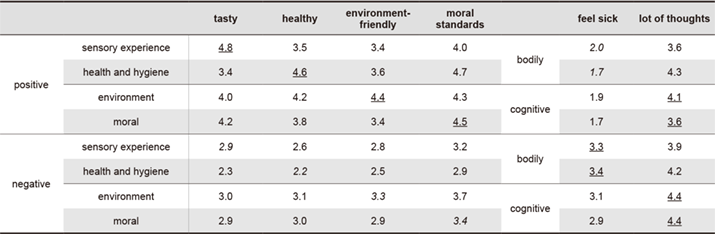
Manipulation Check
While we succeeded in defining an aspect for each product, valence, and theme, this was more difficult in some cases than in others. As a result, some aspects may be better representatives of the four thematic categories than others (Appendix B). The positive aspects followed our predictions quite well about the product being tasty, healthy, environmentally friendly and matching with their moral standards. The negative aspects, on the other hand, followed the predictions for eliciting a more bodily (makes me feel sick) or cognitive response (evokes a lot of thoughts) more closely. As neither type showed the expected responses for all items, we supplemented our analyses of thematic categories with analyses of individual aspects.
Figure 4 shows the mean ratings of the 24 product aspects for disgust, the mean of the 7 positive emotions (positive affect) and the mean of the 7 negative emotions (negative affect). We see that differences in ratings are somewhat more extreme for disgust than for the general positive and negative affect measures. Aspects that rate quite high on disgust seem to compromise hygiene (the presence of insects, mold, or the bacteria in manure), make people aware of their own animalness (blood), or involve the suffering of others (farm workers or animals).

Figure 4. Mean emotion ratings (disgust, negative affect, and positive affect) for the 24 product aspects (Mu = mushroom, Ch = cheese, Me = meat). Responses varied from 1 = not at all to 7 = very much.
We used ANOVAs to check whether the 24 product aspects differed in disgust, and negative or positive affect as expected (see Appendix B). These analyses showed that we successfully created panels that were either positive or negative in valence, which could be distinguished in terms of the level of disgust elicited. However, the degrees of affect and disgust were dependent on the four themes and the products involved. For instance, the evaluations of the mushrooms tend to be consistently more favorable than those for cheese and meat. For the disgust ratings, we observed that sensory aspects [both positive and negative aspects] tend to be perceived as more disgusting than the other categories. Another observation is that the environmental aspects for the 12 negative panels rate lowest on disgust and negative affect, and highest on positive affect. Hence, they are evaluated quite favorably overall. Also, theme and product type do not seem to influence the affect ratings for the positive panels but only for the negative panels. Although these dependencies may influence the other results, we will not try to isolate or control their effect. However, we regard them as random variations in the remainder of the study.
Familiarity, Relevance, and Credibility
Means for the 24 product aspects on the three scales for familiarity, relevance, and credibility can be found in Figure 5. Means on the familiarity scale varied from 3.93 [underpaid farm workers, cheese] to 5.65 [rich, juicy texture, meat] on a 7-point scale, showing that all aspects were at least moderately familiar. For credibility, ratings were relatively low for [can cause cancer, meat] (3.86), but otherwise ranged from 4.16 [hallucinogenic effect, mushroom] to 5.72 [pick in a forest, mushroom], which also shows moderate to good credibility. For relevance, we found an extremely low value of 2.81 for [alien shapes, mushroom], but otherwise means varied from 3.58 [tastes like blood, meat] to 4.99 [medicinal use, mushroom].
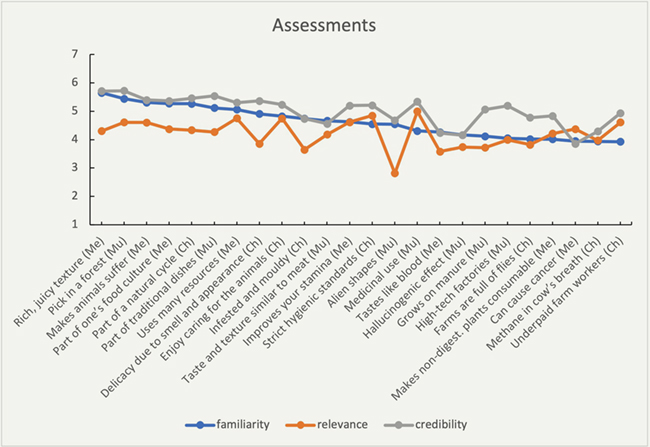
Figure 5. Mean familiarity, relevance, and credibility ratings for the 24 product aspects (Mu = mushroom, Ch = cheese, Me = meat). Responses varied from 1 = strongly disagree to 7 = strongly agree.
To facilitate comparisons over products, we analyzed the data in MANOVA with three dependent variables (familiarity, relevance, and credibility) and three independent variables (valence, theme, and product) as if we used a 2 × 4 × 3 between-participants design. In this analysis most main effects and interactions were significant. To simplify the discussion, we will mainly focus on the main effects found, while keeping in mind that the size of these effects likely depends on the other independent variables.
The significant main effects of valence for each dependent variable showed that positive product aspects were generally judged more familiar, more relevant, and more credible than negative aspects [p < 0.001]. As regards familiarity of the themes, participants were less familiar with the hygienic and health aspects (4.3) than with the other aspects [4.6-4.8, p < 0.01]. Furthermore, participants found the sensory experiential aspects less relevant (3.7) than the other aspects [4.3-4.4, p < 0.001]. For credibility, moral aspects were rated highest (5.3), followed by environmental aspects (5.1), sensory experiential aspects (4.9), and hygiene and health aspects (4.8). In this case, moral aspects were rated significantly higher than sensory and health aspects [p < 0.001], and environmental aspects were rated significantly higher than health aspects [p < 0.01].
We also found some differences between the three products, with the product aspects of meat (4.8) being judged more familiar than those for mushroom (4.6) or cheese (4.5), with the difference between meat and cheese being significant [p < 0.05]. For relevance, the product aspects of meat (4.4) were judged highest, followed by cheese (4.2) and mushrooms (4.0), with the difference between meat and mushrooms being significant [p < 0.01]. For credibility, no differences were found between products [p > 0.20].
Overall, these analyses identified only one or perhaps two cases out of 24 aspects that might raise some concern (2.81 for the relevance of [alien shapes, mushroom]; 3.86 for the credibility of [can cause cancer, meat]). Therefore, these are unlikely to interfere with the remainder of the analyses.
Study 2: Impact of Posters
Disgust, Negative Affect, and Positive Affect
The primary aim of our study was to determine whether we could create posters that would evoke low or high disgust and motivate people to change their behavior. We started our statistical analyses by performing a MANOVA with disgust, positive affect, and negative affect as the three dependent variables and the product (mushroom, cheese, meat) and the four types of panels as independent variables. Because all effects were significant in MANOVA [p < 0.001], we continued with univariate analyses per dependent variable.
In the analysis of the disgust responses, we found significant effects of product, type of panel, and their interaction [all p < 0.001]. Figure 6A shows that disgust responses for mushroom (1.82) were significantly lower than those for cheese (2.55) and meat (2.49) [p < 0.001]. The all-negative (NN) posters evoked more disgust than the all-positive (PP) posters for all three products [2.88 versus 1.32, p < 0.001]. The mixed posters [positive sensory and health panels and negative environment and moral panels (PN) or negative sensory and health panels and positive environment and moral panels (NP)], however, showed a mixed pattern. The ratings for the PN posters were close to each other, but the NP posters showed low disgust for mushrooms and high disgust for meat and cheese. This may be because not all aspects generated the degree of disgust that we expected. In fact, the NP panel for mushroom included the aspects [alien shapes, mu] and [hallucinogenic effect, mu] that both received relatively low disgust ratings among the negative aspects (Figure 4), and of which the first was also rated as low in relevance (Figure 5).
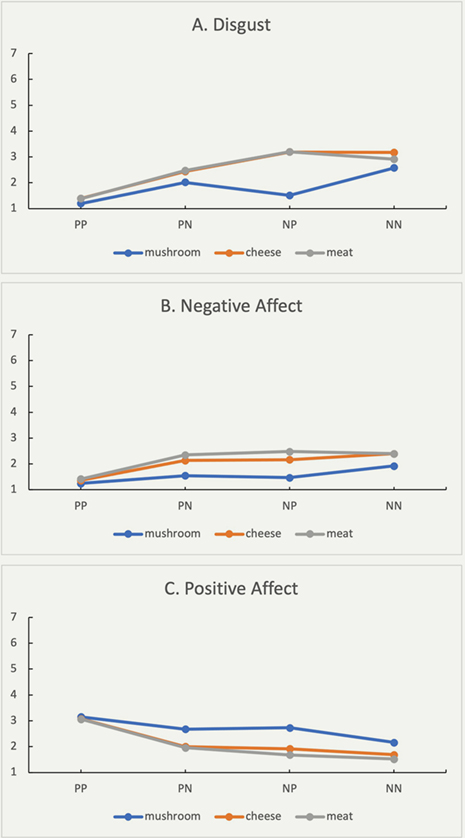
Figure 6. Mean ratings for disgust, negative affect, and positive affect for the posters with 4 positive panels (PP), positive Sensory & Health panels and negative Environment and Moral panels (PN), negative Sensory & Health panels and positive Environment and Moral panels (NP), and 4 negative panels (NN). Responses varied from 1 = not at all to 7 = very much.
The ANOVAs for negative and positive affect also showed main significant effects of products and panel [all p < 0.001]. While the two-way interaction was significant for the negative affect [p < 0.01], it just failed to reach significance for the positive affect [p = 0.056]. We can observe again that mushrooms are evaluated more favorably than cheese or meat [p < 0.001]. For negative affect (Figure 6B), the NN panels obtained significantly higher ratings than the other three panels [p < 0.001]. For positive affect (Figure 6C), the PP panels were rated significantly higher than all other panels, while the NN panels were rated significantly lower than all other panels [p < 0.001].
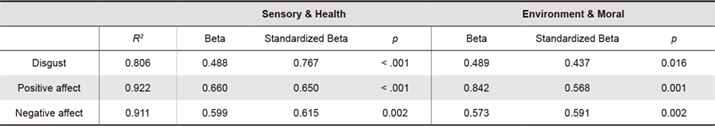
Regression analyses on the group mean responses to the 12 poster presentations show that they were well predicted by the mean emotional responses to the 24 product aspects (R2 > 0.80). Standardized coefficients for sensory and health aspects seem to be a little bigger than those for environment and moral aspects, especially for the prediction of disgust (Table 3).
Table 3. Regression analyses connecting the ratings for posters (N = 12, Study 2) to the individual aspects (N = 24, Study 1). In the posters, the Sensory & Health aspects were always combined, just like the Environmental & Moral aspects.
Effects on Intention to Purchase, Recommend, or Change Behavior
MANOVA on the intentions to purchase the product, recommend the product, or change their consumption as dependent variables and the 3 products and the 4 types of panels as independent variables showed significant main effects for product and panel [p < 0.001]. However, the two-way interaction just failed to reach significance [p = 0.068]. For all three graphs in Figure 7, meat seems the least popular product, while mushrooms tend to get the highest ratings. The difference between meat and mushrooms is significant for all three variables [p < 0.05]. The difference between meat and cheese is significant only for recommendations [p < 0.01], while the difference between cheese and mushrooms is only significant for the intention to change [p < 0.05]
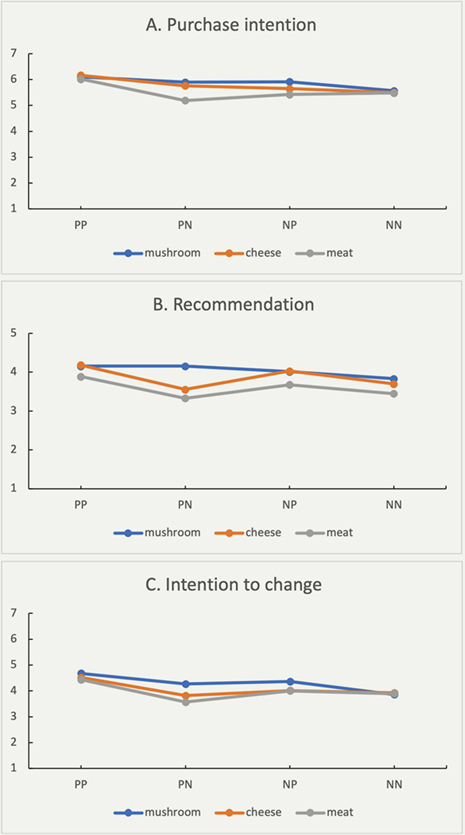
Figure 7. Mean ratings for Purchase intention (panel A; from 1 = highly unlikely to 7 = highly likely), Recommendation (Panel B; from 1 = definitely not to 5 = definitely yes), and Intention to change consumption behavior (Panel C; from 1 = eat much less to 7 = eat much more) for the posters with 4 positive panels (PP), positive Sensory & Health panels and negative Environment and Moral panels (PN), negative Sensory & Health panels and positive Environment and Moral panels (NP), and 4 negative panels (NN).
Responses for the PP panels tend to be consistently higher than for all other three panels [p < 0.01]. Only the difference with the NP panels for recommendations is not significant [p > 0.15]. Differences among NN, NP, and PN panels all failed to reach significance. Please note that a low rating on intention to change behavior implies that people say they will eat less of the product.
If we look at the number and type of recommendations given, Figure 8 shows that substantial differences occur between products, with mushrooms receiving the most positive and the least negative recommendations. In contrast, meat receives the most negative recommendations and the least positive ones. This is confirmed by Chi2 goodness-of-fit tests for both types of recommendations [p < 0.001]. While the positive recommendations mainly relate to taste or health, the negative recommendations mainly concern environmental effects. In addition, for meat, the reference to moral concerns is more frequent in the negative than in the positive recommendations. [Chi2 independence tests for all products combined and per product, p < 0.001].
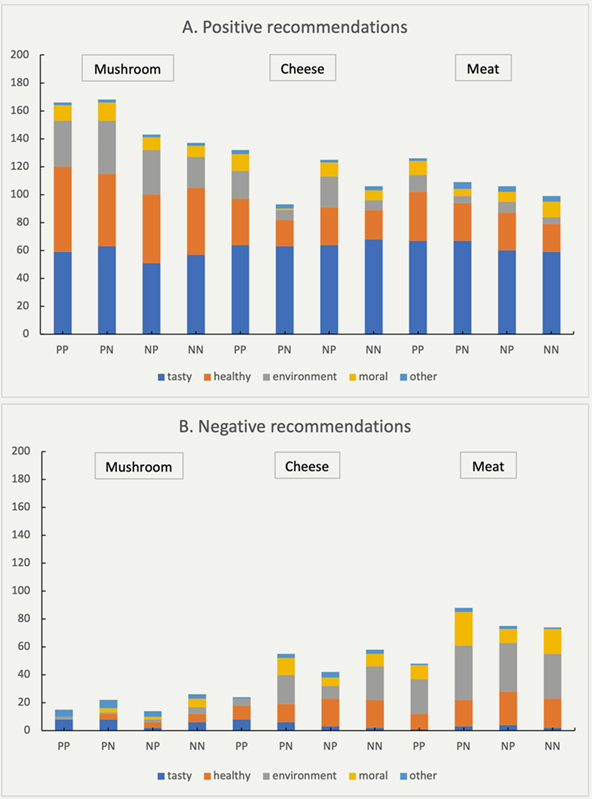
Figure 8. Number of positive (panel A) and negative (panel B) recommendations given for mushrooms, cheese, and meat, after seeing one of the posters (N = 307). The posters have 4 positive panels (PP), positive Sensory & Health panels and negative Environment and Moral panels (PN), negative Sensory & Health panels and positive Environment and Moral panels (NP), or 4 negative panels (NN).
Figure 8 consistently shows that after seeing the NN posters, participants will give less positive and more negative recommendations than after seeing PP posters. For the mixed posters, the PN posters generate more negative comments than the NP posters. This suggests that negative environmental or moral aspects generate more negative recommendations than negative sensory or potential health effects. However, PN posters do not seem to result in less positive recommendations than NP posters, at least not for mushrooms and meat (Figure 8A). We performed Chi2 independence tests to substantiate that the 4 different panels generated different frequency distributions of the recommendations. However, these tests were significant only for cheese [for negative [χ2(12) = 30.0, p < 0.01] and for positive [χ2(12) = 21.0, p = 0.05] recommendations].
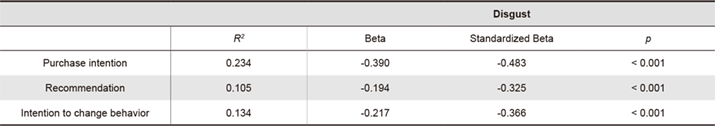
The various intentions can also be related to the positive and negative affect that the infographics evoke. Regression analyses (Table 4) show that purchase intentions are mainly affected by negative and less by positive affect, although both explanatory variables are significant. For recommendations to others, we see that the contributions of the beta weights are more balanced, although negative affect is still weighted more heavily than positive affect. For the intention to change behavior, the coefficient for positive affect is similar to negative affect. If we use disgust as a predictor (Table 5), we observe a pattern similar to the one for negative affect, with the largest negative coefficient for purchase intention.
Table 4. Predicting changes in intention to purchase, recommend or change behavior based on positive and negative affect using individual data (N = 921).
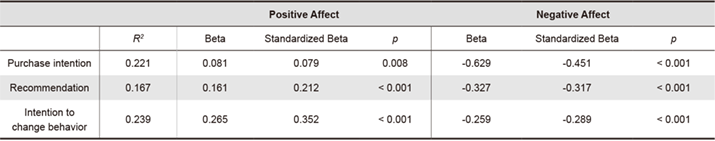
Table 5. Predicting changes in intention to purchase, recommend or change behavior based on perceived disgust using individual data (N = 921).
Discussion
Design Approach
We set out to design stimuli that could be used to increase or decrease the disgust for several food products. In the design stage, four main themes came up that we considered relevant for all three products. We used these themes to make aspects more comparable over products. Although we see a distinction between aspects that increase or decrease disgust, the aspects did not always follow our expectations and predictions regarding the four themes (Figure 4 and Appendix B). Participants may perceive, interpret, and value the aspects differently from the researchers, as they may differ in background from the research team. Also, the context in which the researchers generated the items differed from the questionnaire context in which the respondents evaluated the aspects.
Furthermore, some themes may have fitted better than others in individual cases. An ill-fitting theme may demand more from the creative abilities of the research team and require them to stretch the theme. It is also possible that the current drawings and texts do not clearly represent the aspect they intended to portray. Possibly, the level of abstraction, including the line characteristics and reduced color scheme, may not have been optimal to portray some aspects. Alternatively, the underlying reasoning might differ. For instance, participants evaluated produced in high tech factories quite positively, probably because it suggests a high level of expertise, while the researchers expected it to be valued negatively, because it makes food production artificial.
The search for encompassing themes occurred intuitively and naturally during our creative process, as it is part of structuring and making sense of spontaneous associations. Going back and forth between everyday examples and cognitive constructs is typical for design processes, where curious observation, sense-making, and coming up with solutions go hand in hand (Taura & Nagai, 2017). Any cognitive associations can give rise to new ideas as designers go through their associative networks during creative processes (e.g., Casakin, 2011). Defining themes may support creativity by introducing specific viewpoints during brainstorming, but its success depends on the ability of the research team to find examples that fit well in the different themes. As many items are product-specific, they cannot be used for multiple products. Our analyses show that some aspects rate insufficient either in terms of the expected disgust response or on the other assessment criteria like credibility (Figures 4 & 5). But even though not all our product aspects generated the expected response, many did, suggesting that this theme-based approach works quite well in design practice for developing campaigns that increase or decrease food aversions.
Evaluations of the Product Aspects and Posters
Our outcomes suggest that presenting people with infographics that show positive or negative aspects can affect people’s intentions to buy, consume, or recommend the products. Such graphical representations may enrich current information campaigns that use posters, brochures, or web page banners. It would be interesting to test the influence of the style and quality of images in combination with text format on the intensity of the disgust response. In addition, it could be motivating to see how people are influenced by such messages when they are displayed on product packages, which allow people to interact directly with the food product. Inspiration can be sought, for instance, from studies on health warnings on tobacco products, which suggest that images elicit a stronger emotional response than just text warnings (Hammond, 2011).
Figure 4 suggests that the most disgusting aspects connect to the human body, either by reminding people of their own body parts and fluids (blood), highlighting aspects that could threaten personal health because they are unsanitary (insects, mold, bacteria), or raising empathy with the suffering of others (farm workers or animals). Possibly, designers can explore more ways to enhance this personal connection in other media, for instance, by enhancing vividness by suggesting or including movement (Schifferstein et al., 2023) or by using the sense of touch to introduce sensations like stickiness, wetness, and coldness (Saluja & Stevenson, 2019).
Our results revealed many differences between products. For instance, the stimuli with negative aspects for meat and cheese yielded more disgust and negative affect than those for mushrooms. Accordingly, the purchase intention was highest for mushrooms (Figure 7), even though participants consume mushrooms less frequently than cheese or meat (Table 2). People are possibly aware that their consumption of cheese and meat needs to be discouraged for environmental and health reasons, whereas for vegetable products like mushrooms, the consumption should be increased. We also see this with the many people who try to positively recommend mushrooms, while meat and—to a lesser degree—cheese consumption is more often criticized (Figure 8). However, their actual consumption still deviates substantially from the desired pattern (Table 2).
The regression analyses in Table 3 show that the mean emotional responses to the 12 posters could be well predicted by the mean emotional responses to the 24 product aspects. Interestingly, the impact of the sensory and health aspects seems to be bigger than those for environmental and moral topics, especially for disgust. This may occur because disgust involves a large experiential component: Disgust is felt internally and can evoke a bodily response, like feeling nauseous. In addition, sensory and health aspects are more direct, concrete, and tangible. On the contrary, environmental and moral aspects are more abstract and cognitive and might relate to societal issues rather than have personal and immediate consequences. More knowledge about the determinants of disgust can help us grasp phenomenological differences between different types of disgust reactions.
Most consumer studies either focus on factors that promote product purchase (e.g., in marketing) or reduce product use (e.g., studies on alcohol or smoking in public health). Our research examines promotion and discouragement in a single study. Interestingly, regression analyses in Table 4 show that purchase intentions are mainly influenced by negative affect and less by positive affect, suggesting that people may try to avoid mistakes when buying food products. There may be a connection with studies that investigate trade-offs between potential gains and losses. These have generally shown asymmetry because people tend to let potential losses (negative affect) outweigh potential gains (positive affect) (e.g., Luce et al., 1999; Tversky & Kahneman, 1992). For the intention to change behavior, however, effect sizes are similar, suggesting that both directions are equally important. Probably positive aspects fulfill a clear role in behavior change because they give direction on where to go instead of just avoiding negative consequences.
Limitations
In our study, we have generated many aspects that could increase or decrease disgust, but other aspects may have a greater effect. It is always a challenge to be creative and develop more topics that might affect behavior. In our aim to cover four thematic categories, not only did we come up with some items that people might not find particularly relevant or credible for some products, but we also left out many other options because we had already found a good candidate in that category. Hence, it might be easier to enhance the persuasiveness of our infographics by including other, more salient aspects that we have not covered. On the other hand, by using a thematic approach, we may have included a more varied range of aspects, addressing a broader and more varied audience than an unstructured approach would have provided.
Our study was limited by the small design research team, the three products, the aspects we visualized, our way of visualizing, and the participant sample (US inhabitants) we used. Even though the authors may be considered experts in the field, we cannot rule out that our ideas may be somewhat biased. We defined four different themes to generate the stimuli, but the design process was not strictly controlled, and the stimuli may contain confounds. The context in which we presented the poster (the billboard on the street) may also have influenced the perception of the infographic. By including multiple analyses, including ordinal comparisons between product aspects (Figures 4 & 5), regression analyses (Tables 3-5), and analyses of variance, we tried to obtain a rich overview of the factors of interest, highlighting different perspectives to overcome biases. Replicating these results with other products and images in other cultures will probably offer additional insights. Moreover, the measurement of some dependent variables could be improved if validated scales were used.
Building on the current insights, future studies could use a more controlled setup to confirm some of the current findings (e.g., sensory aspects elicit more disgust but are judged less relevant than other aspects). Furthermore, it would be interesting to include actual measures of behavior, possibly over the long term, rather than the intentions assessed in the current study.
Endnote
- Data availability: The data and stimulus materials will be made publicly available after the publication of the paper through the TU Delft repository at DOI 10.4121/21740024.
- Ethical statement: The human research ethics of Delft University of Technology approved this study. Participants provided informed written consent before any data collection and received monetary compensation through Prolific for their participation.
- Funding: This research was supported by the Pride and Prejudice project by the 4TU Federation under Grant No. 4TU-UIT-346.
- Conflict of interest: The authors declare that the study was conducted without any commercial or financial relationships that could be construed as a potential conflict of interest.
References
- Basiago, A. D. (1998). Economic, social, and environmental sustainability in development theory and urban planning practice. Environmentalist, 19(2), 145-161. https://doi.org/10.1023/A:1006697118620
- Breedveld, B., & Bast, T. (2014). Van schaarste naar overvloed–70 jaar voedingsvoorlichting in Nederland [From scarcity to abundance–70 years of nutrition education in the Netherlands]. Voedingscentrum.
- Cardello, A.V., Meiselman, H.L., Schutz, H.G., Craig, C., Given, Z., Lesher, L. L., & Eicher, S. (2012). Measuring emotional responses to foods and food names using questionnaires. Food Quality and Preference, 24(2), 243-250.
- Casakin, H. (2011). Associative thinking as a design strategy and its relation to creativity. In Proceedings of the 18th international conference on engineering design (pp. 1-10). The Design Society.
- Chapman, H. A., Kim, D. A., Susskind, J. M., & Anderson, A. K. (2009). In bad taste: Evidence for the oral origins of moral disgust. Science, 323(5918), 1222-1226. https://doi.org/10.1126/science.1165565
- Cross, N. (1982). Designerly ways of knowing. Design Studies, 3(4), 221-227. https://doi.org/10.1016/0142-694X(82)90040-0
- Curtis, V., de Barra, M., & Aunger, R. (2011). Disgust as an adaptive system for disease avoidance behaviour. Philosophical Transactions of the Royal Society B: Biological Sciences, 366(1563), 389-401. https://doi.org/10.1098/rstb.2010.0117
- Dalsgaard, P. (2017). Instruments of inquiry: Understanding the nature and role of tools in design. International Journal of Design, 11(1), 21-33.
- De Boer, B., & Lemke, M. (2021). Bringing disgust in through the backdoor in healthy food promotion: A phenomenological perspective. Medicine, Health Care and Philosophy, 24(4), 731-743. https://doi.org/10.1007/s11019-021-10037-0
- De Boer, B., & Lemke, M. (2023). Insect consumption and aesthetic disgust: Using design fiction to imagine novel food experiences. International Journal of Food Design, 9. https://doi.org/10.1386/ijfd_00065_1
- Dean-Coffey, J. (2013). Graphic recording. New Directions for Evaluation, 2013(140), 47-67. https://doi.org/10.1002/ev.20073
- Dijkstra, A., & Buunk, A. P. (2008). Self-evaluative emotions and expectations about self-evaluative emotions in health-behaviour change. British Journal of Social Psychology, 47(1), 119-137. https://doi.org/10.1348/014466607X216133
- Dunlap, J. C., & Lowenthal, P. R. (2016). Getting graphic about infographics: Design lessons learned from popular infographics. Journal of Visual Literacy, 35(1), 42-59. https://doi.org/10.1080/1051144X.2016.1205832
- Ethical Consumer. (2021, July). Ethical consumerism in the pandemic. Retrieved from https://www.ethicalconsumer.org/research-hub/uk-ethical-consumer-markets-report
- Fokkinga, S., & Desmet, P. M. A. (2012). Darker shades of joy: The role of negative emotion in rich product experiences. Design Issues, 28(4), 42-56. https://doi.org/10.1162/DESI_a_00174
- Furst, T., Connors, M., Bisogni, C. A., Sobal, J., & Falk, L. W. (1996). Food choice: A conceptual model of the process. Appetite, 26(3), 247-266. https://doi.org/10.1006/appe.1996.0019
- Gaver, W. (2014). Science and design: The implications of different forms of accountability. In J. Olson & W. Kellogg (Eds.), Ways of knowing in HCI (pp. 143-165). Springer.
- Giner-Sorolla, R., & Chapman, H. A. (2017). Beyond purity: Moral disgust toward bad character. Psychological Science, 28(1), 80-91. https://doi.org/10.1177/0956797616673193
- Glanz, K., Basil, M., Maibach, E., Goldberg, J., & Snyder, D. A. N. (1998). Why Americans eat what they do: Taste, nutrition, cost, convenience, and weight control concerns as influences on food consumption. Journal of the American Dietetic Association, 98(10), 1118-1126. https://doi.org/10.1016/S0002-8223(98)00260-0
- Haidt, J., McCauley, C., & Rozin, P. (1994). Individual differences in sensitivity to disgust: A scale sampling seven domains of disgust elicitors. Personality and Individual Differences, 16(5), 701-713. https://doi.org/10.1016/0191-8869(94)90212-7
- Haidt, J., Rozin, P., McCauley, C., & Imada, S. (1997). Body, psyche, and culture: The relationship between disgust and morality. Psychology and Developing Societies, 9(1), 107-131. https://doi.org/10.1177/097133369700900105
- Hammond, D. (2011). Health warning messages on tobacco products: A review. Tobacco Control, 20(5), 327-337. https://doi.org/10.1136/tc.2010.037630
- Hartmann, C., & Siegrist, M. (2018). Development and validation of the food disgust scale. Food Quality and Preference, 63, 38-50. https://doi.org/10.1016/j.foodqual.2017.07.013
- Heiser, R. S., Sierra, J. J., & Torres, I. M. (2008). Creativity via cartoon spokespeople in print ads: Capitalizing on the distinctiveness effect. Journal of Advertising, 37(4), 75-84. https://doi.org/10.2753/JOA0091-3367370406
- Hendges, G. R., & Florek, C. S. (2019). The graphical abstract as a new genre in the promotion of science. In M.J. Luzón & C. Pérez-Llantada (Eds.), Science communication on the internet: Old genres meet new genres (pp. 59-79). John Benjamins.
- Hilderink, H., Deuning, C., & van der Wilk, E. (2021). Infographics and the knowledge translation framework. European Journal of Public Health, 31(3), Article ckab164.282. https://doi.org/10.1093/eurpub/ckab164.282
- Izmirli, S., & Phillips, C. J. C. (2011). The relationship between student consumption of animal products and attitudes to animals in Europe and Asia. British Food Journal, 113(3), 436-450. https://doi.org/10.1108/00070701111116482
- Kelly, D. (2011). Yuck! The nature and moral significance of disgust. MIT press.
- Korsmeyer, C. (2011). Savoring disgust: The foul and the fair in aesthetics. Oxford University Press.
- Kranzbühler, A. M., & Schifferstein, H. N. J. (2023). The effect of meat-shaming on meat eaters’ emotions and intentions to adapt behavior. Food Quality and Preference, 107, Article 104831. https://doi.org/10.1016/j.foodqual.2023.104831
- Krogh, P. G., Markussen, T. L., & Bang, A. L. (2015). Ways of drifting–Five methods of experimentation in research through design. In A. Chakrabarti (Ed.), Proceeding of the 5th international conference on research into design–Research into design across boundaries (Vol. 1, pp. 39-50). Springer. https://doi.org/10.1007/978-81-322-2232-3
- Lappalainen, R., Kearney, J., & Gibney, M. (1998). A pan EU survey of consumer attitudes to food, nutrition and health: An overview. Food Quality and Preference, 9(6), 467-478. https://doi.org/10.1016/S0950-3293(98)00018-4
- Laurans, G., & Desmet, P. M. A. (2017). Developing 14 animated characters for non-verbal self-report of categorical emotions. Journal of Design Research, 15(3-4), 214-233. https://doi.org/10.1504/JDR.2017.089903
- Lee, H., Fujita, K., Deng, X., & Unnava, H. R. (2016). The role of temporal distance on the color of future-directed imagery: A construal-level perspective. Journal of Consumer Research, 43(5), 707-725. https://doi.org/10.1093/jcr/ucw051
- Lemke, M., Boon, B., & Schifferstein, H. N. J. (2021). Between attraction and aversion: How designers can use the concept of disgust to influence food consumption. International Journal of Food Design, 6(1), 67-102.
- Lemke, M., & de Boer, B. (2022). Setting the stage: Disgust as an aesthetic food experience. Design Issues, 38(3), 20-33. https://doi.org/10.1162/desi_a_00689
- Luce, M. F., Payne, J. W., & Bettman, J. R. (1999). Emotional trade-off difficulty and choice. Journal of Marketing Research, 36(2), 143-159. https://doi.org/10.1177/002224379903600201
- Marsh, E. E., & White, M. D. (2003). A taxonomy of relationships between images and text. Journal of Documentation, 59(6), 647-672. https://doi.org/10.1108/00220410310506303
- Mitchell, R., & Nørgaard, M. (2011). Using DIY cartoon storyboards, live sketching and co-sketching to involve young and older users in participatory design. In Proceedings of the conference of IASDR. Delft University of Technology.
- Nicolas-Hemar, V., Gallen, C., Thomas, F., & Pantin-Sohier, G. (2023). Realistic or not? The influence of insect depiction to promote entomophagy. Paper presented at the 15th Pangborn Sensory Science Symposium, Nantes, France.
- Olatunji, B. O., Haidt, J., McKay, D., & David, B. (2008). Core, animal reminder, and contamination disgust: Three kinds of disgust with distinct personality, behavioral, physiological, and clinical correlates. Journal of Research in Personality, 42(5), 1243-1259. https://doi.org/10.1016/j.jrp.2008.03.009
- Paul Ekman Group. (2022). Disgust. https://www.paulekman.com/universal-emotions/what-is-disgust/
- Pérez-Montes, A., Rangel-Vargas, E., Lorenzo, J. M., Romero, L., & Santos, E.M. (2021) Edible mushrooms as a novel trend in the development of healthier meat products. Current Opinion in Food Science, 37, 118-124.
- Prescott, J., Young, O., O’Neill, L., Yau, N. J. N., & Stevens, R. (2002). Motives for food choice: A comparison of consumers from Japan, Taiwan, Malaysia and New Zealand. Food Quality and Preference, 13(7-8), 489-495. https://doi.org/10.1016/S0950-3293(02)00010-1
- Pullman, M. E., Maloni, M. J., & Carter, C. R. (2009). Food for thought: Social versus environmental sustainability practices and performance outcomes. Journal of Supply Chain Management, 45(4), 38-54. https://doi.org/10.1111/j.1745-493X.2009.03175.x
- Rana, J., & Paul, J. (2017). Consumer behavior and purchase intention for organic food: A review and research agenda. Journal of Retailing and Consumer Services, 38, 157-165. https://doi.org/10.1016/j.jretconser.2017.06.004
- Rozin, P., & Fallon, A. E. (1987). A perspective on disgust. Psychological Review, 94(1), 23-41. https://doi.org/10.1037/0033-295X.94.1.23
- Rozin, P., Haidt, J., & McCauley, C. R. (1999). Disgust: The body and soul emotion. In T. Dalgleish & M. J. Power (Eds). Handbook of cognition and emotion (pp. 429-445). Wiley.
- Saari, U. A., Herstatt, C., Tiwari, R., Dedehayir, O., & Mäkinen, S. J. (2021). The vegan trend and the microfoundations of institutional change: A commentary on food producers’ sustainable innovation journeys in Europe. Trends in Food Science & Technology, 107, 161-167. https://doi.org/10.1016/j.tifs.2020.10.003
- Saluja, S., & Stevenson, R. J. (2019). Perceptual and cognitive determinants of tactile disgust. Quarterly Journal of Experimental Psychology, 72(11), 2705-2716. https://doi.org/10.1177/1747021819862500
- Schifferstein, H. N. J. (2023). Supporting food design with consumer research: From inspiration and validation to participation and integration. Current Opinion in Food Science, 51, Article 101020. https://doi.org/10.1016/j.cofs.2023.101020
- Schifferstein, H. N. J., Lemke, M., & de Boer, A. (2022). An exploratory study using graphic design to communicate consumer benefits on food packaging. Food Quality and Preference, 97, Article 104458. https://doi.org/10.1016/j.foodqual.2021.104458
- Schifferstein, H. N. J., Lemke, M., & Huisman, G. (2023). Food in motion: Lively display of freshness or last spasms of living beings? Food & Humanity, 1, 391-403. https://doi.org/10.1016/j.foohum.2023.06.002
- Schifferstein, H. N. J., & Oude Ophuis, P. A. M. (1998). Health-related determinants of organic food consumption in the Netherlands. Food Quality and Preference, 9(3), 119-133. https://doi.org/10.1016/S0950-3293(97)00044-X
- Schroll, R., Schnurr, B., & Grewal, D. (2018). Humanizing products with handwritten typefaces. Journal of Consumer Research, 45(3), 648-672. https://doi.org/10.1093/jcr/ucy014
- Septianto, F., Kemper, J., & Paramita, W. (2019). The role of imagery in promoting organic food. Journal of Business Research, 101, 104-115. https://doi.org/10.1016/j.jbusres.2019.04.016
- Siricharoen, W. V. (2013). Infographics: The new communication tools in digital age. In Proceedings of the international conference on e-technologies and business on the web (pp. 169-174). University of the Thai Chamber of Commerce.
- Siricharoen, W. V., & Siricharoen, N. (2015). How infographic should be evaluated. In Proceedings of the 7th international conference on industrial technology (pp. 558-564). Al-Zaytoonah University of Jordan. https://doi.org/10.15849/icit.2015.0100
- Stappers, P. J., & Giaccardi, E. (2014). Research through design. In The encyclopedia of human-computer interaction (Ch. 43). Interaction Design Funcation. https://www.interaction-design.org/literature/book/the-encyclopedia-of-human-computer-interaction-2nd-ed/research-through-design
- Steiner, J. E. (1973). The gustofacial response: Observation on normal and anencephalic newborn infants. In Proceedings of the 4th symposium on oral sensation and perception (pp. 254-278). U.S. Government Printing Office.
- Strohminger, N. (2014). Disgust talked about. Philosophy Compass, 9(7), 478-493. https://doi.org/10.1111/phc3.12137
- Strömmer, S., Lawrence, W., Shaw, S., Correia Simao, S., Jenner, S., Barrett, M., Christina Vogel, C., Hardy-Johnson, P., Farrell, D., Woods-Townsend, K., Baird, J., Morrison, L., Sloboda, D. M., Inskip, H., & Barker, M. (2020). Behaviour change interventions: Getting in touch with individual differences, values and emotions. Journal of Developmental Origins of Health and Disease, 11(6), 589-598. https://doi.org/10.1017/S2040174420000604
- Taura, T., & Nagai, Y. (2017). Creativity in innovation design: The roles of intuition, synthesis, and hypothesis. International Journal of Design Creativity and Innovation, 5(3-4), 131-148. https://doi.org/10.1080/21650349.2017.1313132
- Trope, Y., & Liberman, N. (2010). Construal-level theory of psychological distance. Psychological Review, 117(2), 440-463. https://doi.org/10.1037/a0018963
- Tversky, A., & Kahneman, D. (1992). Advances in prospect theory: Cumulative representation of uncertainty. Journal of Risk and Uncertainty, 5(4), 297-323. https://doi.org/10.1007/BF00122574
- Tybur, J., Lieberman, D., & Griskevicius, V. (2009). Microbes, mating, and morality: Individual differences in three functional domains of disgust. Journal of Personality and Social Psychology, 97(1), 103-122. https://doi.org/10.1037/a0015474
- Willer, H., Schlatter, B., & Trávníček, J. (Eds.) (2023). The world of organic agriculture 2023. https://www.fibl.org/en/shop-en/1254-organic-world-2023
- Willett, W., Rockström, J., Loken, B., Springmann, M., Lang, T., Vermeulen, S., Garnett, T., Tilman, D., DeClerck, F., Wood, A., Jonell, M., Clark, M., Gordon, L. J., Fanzo, J., Hawkes, C., Zurayk, R., Rivera, J. A., De Vries, W., ... Murray C. J. L. (2019). Food in the anthropocene: The EAT-Lancet Commission on healthy diets from sustainable food systems. The Lancet, 393(10170), 447-492. https://doi.org/10.1016/S0140-6736(18)31788-4
- Wu, L. L., Liu, S. Q., Huang, H., & Yu, X. (2021). Photo vs. art? The design of consumption guidance in cultural food consumption. International Journal of Hospitality Management, 97, Article 103008. https://doi.org/10.1016/j.ijhm.2021.103008
- Yoon, J., & Chung, E. (2017). An investigation on graphical abstracts use in scholarly articles. International Journal of Information Management, 37(1, Part A), 1371-1379. https://doi.org/10.1016/j.ijinfomgt.2016.09.005
- Statista Research Department. (2016, April). Reasons for eating less meat and fish in Sweden 2015. https://www.statista.com/statistics/563831/reasons-for-eating-less-meat-and-fish-in-sweden/
Appendix A: Overview of the 24 Panels Used in the Two Studies
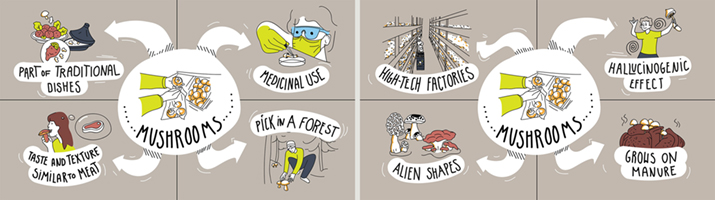
Aspects for mushrooms: 4 positive aspects (left) and 4 negative aspects (right).
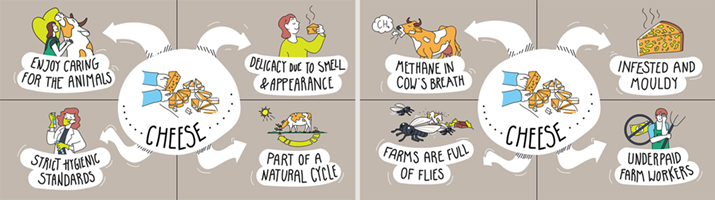
Aspects for cheese: 4 positive aspects (left) and 4 negative aspects (right).
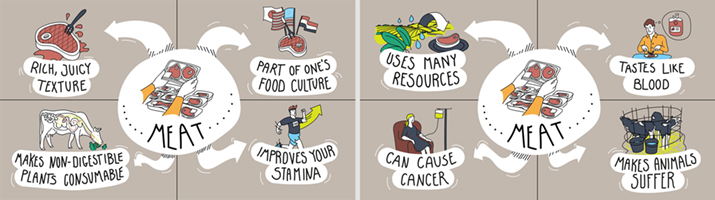
Aspects for meat: 4 positive aspects ((left) and 4 negative aspects (right).
Appendix B: Manipulation Checks
Confirmation of Thematic Categories
During our design process we differentiated between aspect categories to generate approximately equivalent product aspects that could increase or decrease the disgust for the product, and we included six items in the questionnaire that could be linked to these categories. Table B.1. shows the mean ratings for the different valence levels within the thematic categories. The aspects we expected to rate highest in each column are underlined, and the items we expected to rate lowest are in italics.
For the positive items, we see that the predictions for the statements referring to the four categories were followed quite well, with the highest means for tasty, healthy, and environment-friendly in the respective columns. Only for the match with moral standards, the health and hygiene aspects rated comparably high. For the meta categories bodily (feel sick) versus cognitive (lot of thoughts), the responses were quite similar in the two groups and expectations were not confirmed.
For the negative items, the characterization of the meta categories bodily versus cognitive responses seems to work slightly better. In contrast, for the statements referring to the four separate themes, only the mean for healthy is the lowest for all four themes.
Table B.1. shows that our assumptions during the design process were only partially confirmed, and such deviations can be even greater when looking at the reactions to an individual product aspect. We used the distinctions between thematic categories as input for our brainstorming, but they are not critical for the tests we would like to perform. Therefore, we continued the analyses as planned.
Analyses of Disgust, Negative Affect and Positive Affect Responses Elicited by the 24 Product Aspects
In an overall univariate 2 × 4 × 3 ANOVA of the disgust ratings, we found significant effects for valence, theme, and product, and all two-way and three-way interactions [all p < 0.05]. As expected, the negative aspects were found more disgusting (2.97) than the positive aspects (1.49) [p < 0.001]. As the difference in valence is central to the study, we followed up by doing separate ANOVAs for the stimuli with the positive and the negative aspects, respectively. For the 12 negative panels ANOVA showed that the effects of theme, product, and the two-way interaction were all significant [p < 0.01]. The aspects were perceived as most disgusting for the sensory experiential aspects (3.35), followed by health and hygiene (3.02), moral (2.81) and environmental (2.69). The difference between sensory versus moral and environmental was significant [p < 0.05]. Overall, the negative aspects for cheese (3.68) were found most disgusting, followed by meat (3.05) and mushrooms (2.19). All these differences were significant [p < 0.05]. In the ANOVA of the 12 positive panels, only the theme main effect was significant [p < 0.01]. For the panels with the positive aspects, the moral aspects (1.32) and health and hygiene aspects (1.36) were the least disgusting, followed by the environmental aspects (1.60), while the sensory experiential aspects were the most disgusting (1.67). The differences between sensory versus moral and health were significant [p < 0.05].
For the dependent variable negative affect, we found significant effects for valence, theme, and product, and all two-way and three-way interactions [all p < 0.05] in the overall univariate 2 × 4 × 3 ANOVA. As expected, the negative aspects yielded more negative affect (2.28) than the positive aspects (1.50) [p < 0.001]. In the separate ANOVA for the 12 negative panels, we found that the effects of theme, product, and the two-way interaction were all significant [p < 0.001]. The aspects for moral (2.55) were perceived as most negative, followed by health and hygiene (2.27), sensory experiential aspects (2.22), and environmental (2.07). Only the difference between moral and sensory was significant [p < 0.05]. Overall, the negative aspects for cheese (2.50) and meat (2.50) evoked more negative affect than mushrooms (1.81). Only the mushrooms differed significantly from the other two products [p < 0.001]. In the ANOVA of the 12 positive panels, none of the effects reached significance [p > 0.05].
For the dependent variable positive affect, we found significant main effects for valence [p < 0.001] and product [p < 0.001], a significant two-way interaction between theme and valence [p < 0.01], and a significant three-way interaction [p < 0.05] in the overall univariate ANOVA. As expected, the negative aspects yielded less positive affect (1.96) than the positive aspects (2.82) [p < 0.001]. In the separate ANOVA for the 12 negative panels, we found that the effects of theme, product, and the two-way interaction were all significant [p < 0.01]. The aspects were perceived as least positive for health and hygiene (1.72) and sensory experiential (1.84), followed by moral (2.04) and environment friendly (2.22). Only the difference between health versus environment was significant [p < 0.01]. Overall, the negative aspects for cheese (1.77) and meat (1.83) evoked less positive affect than mushrooms (2.27). Only the mushrooms differed significantly from the other two products [p < 0.01]. In the ANOVA of the 12 positive panels, none of the effects reached significance [p > 0.05].
Table B.1. Mean ratings for statements defining the thematic categories. Responses varied from 1 = strongly disagree to 7 = strongly agree.