
Advancing Design Approaches through Data-Driven Techniques: Patient Community Journey Mapping Using Online Stories and Machine Learning
Jiwon Jung *,1,2, Ki-Hun Kim 1,3, Tess Peters 1, Dirk Snelders 1, and Maaike Kleinsmann 1,4
1 Delft University of Technology (TU Delft), Delft, the Netherlands
2 Erasmus MC, University Medical Center Rotterdam, Rotterdam, the Netherlands
3 Pusan National University, Busan, South Korea
4 Leiden University Medical Center (LUMC), Leiden, the Netherlands
Designers are increasingly collaborating with data scientists to apply smart data technologies to understand large-scale user behavior during their design research. This is useful in specific impact domains with vulnerable users and unfamiliar contexts, such as healthcare design. Patient journey mapping is the most common design tool for developing and communicating patient-centred perspectives in healthcare design. However, creating a traditional patient journey map is labor intensive. Consequently, they often represent the experiences of a limited number of patients and, therefore, have limitations in including an extensive group patient experience. To overcome these challenges, we present a new data-driven and hybrid intelligent design approach that utilizes tens of thousands of online patient stories and machine-learning techniques through collaboration with data scientists. We set up two studies in the field of oncology and demonstrate that combining the two machine-learning techniques allows for quantifying the experiences of a wide range of patients, detecting relationships between co-occurring experiences within the journey, and detecting new design opportunities/directions. In these studies, designers gained a large-scale, yet qualitative and inspiring, understanding of a complex context in healthcare with reduced time and cost investments.
Keywords – Patient Journey Mapping, Machine Learning, Hybrid Intelligence, Patient Stories, Healthcare Design.
Relevance to Design Practice – Analyzing the experiences of tens of thousands of patients supports designers to understand and respond to an extensive and collective user group experience at a level that, previously, was practically unfeasible. Hence, we showcase the potential of collaborations between designers and data scientists, both within and beyond healthcare design.
Citation: Jung, J., Kim, K., Peter, T., Snelders, D., & Kleinsmann, M. (2023). Advancing design approaches through data-driven techniques: Patient community journey mapping using online stories and machine learning. International Journal of Design, 17(2), 19-44. https://doi.org/10.57698/v17i2.02
Received March 25, 2022; Accepted May 4, 2023; Published August 31, 2023.
Copyright: © 2023 Jung, Kim, Peters, Snelders, & Kleinsmann. Copyright for this article is retained by the authors, with first publication rights granted to the International Journal of Design. All journal content is open-accessed and allowed to be shared and adapted in accordance with the Creative Commons Attribution 4.0 International (CC BY 4.0) License.
* Corresponding Author: j.jung-1@tudelft.nl; Jung and Kim contributed equally to this work (co-first authors).
Jiwon Jung is an assistant professor at the Faculty of Industrial Design Engineering (IDE) at Delft University of Technology (TU Delft). She is also affiliated with the Surgery Department, Erasmus MC, University Medical Center Rotterdam. She did her Ph.D. in industrial design engineering (CardioLab, TU Delft) with a doctoral thesis titled Developing Data-enabled Design in the Field of Digital Health. She obtained M.Sc. in industrial design from KAIST, Korea. Her research focuses on the future impact of design in digital health, given the rise of data collection and analysis technologies.
Ki-Hun Kim received B.S. and Ph.D. degrees from the Department of Industrial and Management Engineering, Pohang University of Science and Technology (POSTECH), Korea. He worked as a Postdoctoral Researcher at UNIST( Korea) and TU Delft (the Netherlands). He is currently an assistant professor in the Department of Industrial Engineering at Pusan National University in Korea. His research interest includes industrial data analytics to address industrial problems. His work has been applied in various areas, such as healthcare, transportation, and manufacturing.
Tess Peters is an entrepreneur of a start-up called Qaring that initiated the patient community journey mapping tool introduced in this paper. She did her Msc. in Design for Interaction with a Medisign specialization at CardioLab in IDE at TU Delft.
Dirk Snelder is a full professor at IDE in TU Delft. His current research interest is in service design, particularly how new service propositions can redefine relations between people in a service setting. Dirk has a background in the social sciences, yet for most of his academic career, he has taught and carried out research at design schools, at TU Delft, TU Eindhoven, and Aalto University. Over the years, his research interest has moved from the function of design in relation to aesthetics and branding to the organization of design for new service development.
Maaike Kleinsmann is a full professor in Design for Digital Transformation at IDE in TU Delft. Also, she serves as a professor of Medical Delta—a joint professorship at Leiden University Medical Center (LUMC). She currently studies how design could support the development of smart product-service systems, particularly in healthcare. She founded a field lab called CardioLab together with Philips Experience Design and Dutch Heart Foundations (De Hartstichting). Moreover, she is one of the founders of an international Special Interest Group on Healthcare Systems Design Research.
Introduction
Design research is currently exploring collaborations with data scientists. It is to develop new data-driven design approaches for understanding user needs and prototyping design outcomes by using large-scale data and analyzing them using smart technologies such as machine learning (Bourgeois & Kleinsmann, 2023; Cooper, 2019; Giaccardi et al., 2016; Speed & Oberlander, 2016; Verganti et al., 2020). This new development builds on an emerging need for designers who work more and more on societal challenges. Moreover, this type of collaboration builds on a rich tradition in design (Andreasen, 2011; Cross, 2018) in improving design research and practice through innovations in technology-driven design approaches. Such data-driven design approach through data scientist collaboration is a hybrid intelligence approach, that uses the complementary strengths of human (in our case, designers, and data scientists) and machine intelligence (Dellermann et al., 2019; Kamar, 2016), that uses machine learning to analyze a large scale user dataset, and uses human’s competences to interpret the analysis outcome.
Healthcare, one of societal challenges that designers work on, is an impactful domain to explore such data-driven design approach (Tsekleves & Cooper, 2017), through data scientist collaboration. The design discipline is already increasingly recognised as a valuable contributor to addressing patient-centred views in the development of new healthcare solutions (Bate & Robert, 2006; Høiseth & Keitsch, 2015; Mullaney et al., 2012). The designers’ challenge is to work for vulnerable user groups (e.g., patients) in a context that is most often unfamiliar to them. It is their task to address and represent the experiences of user groups (at a community level) in such a way that it can well-inform the creative design processes of solution finding (Daalhuizen et al., 2019; Stolterman, 2021). Designers use the patient journey map as the premier tool for developing and communicating these patient perspectives (Carayon et al., 2020; McCarthy et al., 2016). The patient journey map is a visual tool that explicates patients’ perspectives on their experience of their care path (i.e., touchpoints with healthcare services, staff, and organizations).
The current methods for patient journey mapping are, however, highly labor intensive in terms of the time required for data collection from patients and analysis. Besides, these traditional journey maps are criticized (mainly by healthcare researchers and workers) for not being representative. Designers cannot generate the quantification of and correlations between the identified experience moments or touch-points. Given the above problems, this article explores a novel approach for patient journey mapping using existing databases of patient stories from online patient communities (community-level data). These databases provide a source for tens of thousands of first-hand patient stories about their care path and illness experiences. The approach is explored following two procedures of text mining techniques that allow for the inclusion of data from a broader population. In Study 1, we apply supervised machine learning, based on topic classification, to analyze stories written by cancer patients on a peer-to-peer social platform of the Canadian Cancer Society. In Study 2, we apply unsupervised machine learning, based on topic modeling, to analyze stories from patients belonging to a British online community for head and neck cancer that can be found on the website of Macmillan Cancer Support.
These two studies taught us that analyzing online patient stories with machine learning techniques can lead to patient community journey maps based on community-level data that still maintain a highly qualitative and inspirational feel to inspire designers in their research. In addition to these traditional qualities of a patient journey, we also identified the frequency in which a particular experience occurred, interesting co-occurrences between experiences, and an ideation of possible new data types to be collected and provided for patients.
Notably, our approach is the result of a close collaboration between data scientists and designers. As such, our article contributes to a current fundamental discussion of design research and methodology about how data-driven methods and smart technologies could improve the design process and its outcomes (Bourgeois & Kleinsmann, 2023; Cooper, 2019; Giaccardi et al., 2016; Speed & Oberlander, 2016; Verganti et al., 2020). In particular, our approach provides a generic map of tens of thousands of online patient stories providing valuable insights to include collective patients’ perspectives in a healthcare design process. First, the generic map provides insights into the institutional arrangement of health experiences. The institutional arrangement refers to how social rules, norms, meanings, symbols, and cultures are created, diffused, and adopted (Scott, 1995). Patient experiences are highly integrated into the health system and society at large. Therefore, considering an institutional arrangement in the design process is crucial in developing successful design output. Second, a generic journey map provides designers with a benchmark in terms of interdependencies and the contexts of experiences. Such an example enables designers to identify the unique characteristics of individual patients compared to average trends (benchmark points). However, this can only be achieved when we understand what the average experience of people is and, thus, what rare conditions are. Third, involving tens of thousands of patient perspectives in design research increases the acceptance of design knowledge from health researchers and practitioners. It is only at this (community-level) scale that design research (often individual-level) and health research (often population-level) can start to have meaningful conversations about patient experiences. Therefore, our article aims to develop a design approach that can inspire other designers to understand large user group experience and to adapt it to their practices, be this within or outside patient journey mapping or the healthcare domain.
In the following sections, we will first discuss the characteristics of the patient journey map, online patient stories, and machine learning. This is followed by Studies 1 and 2, which present the approach used to analyze online patient stories, based on supervised (topic classification) and unsupervised (topic modeling) machine learning techniques and apply the analysis result to the traditional journey mappings. Finally, we will discuss and critically evaluate the use of our approach and provide our conclusion.
Background
Patient Journey Mapping
A patient journey map is a specific application of customer journey mapping that visualizes the sequence of all events and touchpoints (i.e., before, during, and after) that a customer experiences in interacting with a service or product (Richardson, 2010; Zomerdijk & Voss, 2010). When such journey mapping is focused on the experience of a patient during their interaction with various formal and informal healthcare services provided under healthcare settings (Carayon et al., 2020; Carayon & Wooldridge, 2020; McCarthy et al., 2016; National Academies of Sciences, Engineering, and Medicine et al., 2018), it is called a patient journey map. The patient journey map is an effective tool for including patient-centric perspectives to improve the quality of the care path by investigating and visually expressing various behavioral, social, and psychological factors that can affect the experience of patients in regard to health services (Kushniruk et al., 2020; Manchaiah et al., 2013; Wheelock et al., 2014).
In the current patient journey mapping approach, designers face a critical difficulty in expressing the complexity of the journey when representing a broader patient population in terms of interdependencies, constraints, perspectives, and the contexts of the experiences (Carayon et al., 2020; McCarthy et al., 2016; Rodrigues et al., 2021). This difficulty stems from the limitations of the current data collection and analysis methods. The conventional data collection method for constructing a journey map is often qualitative data collection, e.g., multi-disciplinary meetings, interviews, or ethnography (Ben-Tovim et al., 2008; Madathil et al., 2020; Trebble et al., 2010). The labor intensiveness of qualitative data collection limits the number of patients explored to, at most, ‘tens’ of patients, which limits the full representation of a broader patient population. Further, qualitative thematic analysis is the conventional data analysis method used for constructing a patient journey map (Ben-Tovim et al., 2008; Madathil et al., 2020; Trebble et al., 2010). This also limits the number of patients studied because of the intensive time and procedural effort required for the analysis.
In this paper, we therefore explore a novel approach in two procedures that can add value to patient journey mapping by innovating data collection methods using large datasets of existing online patient stories and by the use of machine learning in text mining as a data analysis method.
Online Patient Stories
Online patient stories are a valuable, largely available, and relatively accessible source that reflects the experiences of patients regarding their care paths through self-narrations about their daily experiences of living with their illness and undergoing treatment services (e.g., experience, emotion, psychological suffering, and the need for support). These online patient stories result from Web 2.0, where large groups, i.e., online communities. (Preece & Maloney-Krichmar, 2003) with common interests share their experiences through intense interactions (Pramanik et al., 2020). The patient stories are written with the intention of asking questions of peers and care providers, as well as merely sharing experiences among peers (Pramanik et al., 2020). These stories provide a unique and rich database of patient experiences, which often also include both satisfaction and challenges with healthcare services and teams, or discussion regarding other determinants of health, such as social, cultural, and behavioral factors (Chakraborty & Church, 2021; Kilaru et al., 2016; Tran & Lee, 2017), that are not captured in a hospital database (Botto et al., 2019).
The advantage of machine learning technology is that it permits analysis scalability given the vast amount of data that can be collected from social media, chat logs, online forums, and blogs (after appropriate privacy protection and permission). Although employing machine learning for patient story analysis still requires qualitative analysis work, such as building initial journeys and labeling topics, it requires less effort than conventional journey mapping given the same amount of patient experience to be analyzed. This means that massive data from online stories can be analyzed with a reasonable effort.
Online patient stories for patient journey mapping exhibit three characteristics that assist us in overcoming the difficulty of representing a broad patient population:
- A continuously growing, large-scale dataset: Online patient stories exist on a large scale (e.g., tens of thousands of stories on social platforms), which adds quantity to the journey maps. Further, new and existing users continuously generate new additional content.
- Patient-driven qualitative experience data: Online patient stories are driven and written from the patient’s motivation to share their experiences with others, which increases the reliability of the data because the patients on social platforms can describe their experience more spontaneously, sincerely, and extensively. This overcomes the risk of formal studies, for example, interviews, that ask specific questions and are prone to giving socially desirable answers (Beusterien et al., 2012; Verhoef et al., 2014).
- Low-cost data collection method: Using online stories is a relatively low-cost (time- and effort-efficient) method for large-scale data collection (Dellarocas, 2003); user data are collected without the time and effort spent to set up the studies (e.g., patient recruitment and time to collect data). With adequate retrieving technologies and paying attention to ethical considerations, thousands of in-depth experiences of patients can be collected in a considerably shorter amount of time compared to that when employing conventional methods.
However, the use of online patient stories continues to have several limitations that need to be focused on. These include that the patients analyzed still do not represent the entire patient population (Huppertz & Otto, 2018; Klein et al., 2018). There is still the likelihood of selection bias arising from biased and one-sided content, and self-selection bias is possible in that patients’ stories may be influenced by previous content (Li & Hitt, 2008).
Further, nation- and illness-specific patient organizations often host and provide online space to share stories and communicate between patients and caretakers. The stories on the platform can be specific to a nation’s health system, for instance, as expressed by the role of general practitioners and the health insurance for specific types of illness. Thus, combining various platform data sources will be challenged by platform-specific characteristics pertaining to national health systems.
Therefore, we use this analysis result only as inspirational material, not as evidence of patient behavior. To explore the behavioral aspects with the least bias, we need to supplement patients’ online story analysis results with other studies that have adequate patient sampling methods, such as systematic and stratified methods. In summary, exploring ways of using online patient stories for patient journey mapping is important to advancing the use of patient experience mapping. Table 1 summarises the advantages and limitations of online patient story use.
Table 1. Advantages and limitations of using online patient stories as a user data collection method for patient journey mapping.
| Advantages | Limitations |
| Continuously growing large-scale dataset | Selection bias |
| Patient-driven qualitative experience data | Self-selection bias |
| Low-cost data collection method | Lacking contextual cues |
Machine Learning in Text Mining
Machine learning is a form of artificial intelligence (AI) that mimics how humans learn in broad scalability (Jordan & Mitchell, 2015; Verganti et al., 2020). The algorithms used in machine learning detect or predict patterns within large amounts of data, thereby unveiling hidden insights automatically (Murphy, 2012). The online patient stories used in this study comprise written sentences without any predefined data format. The extraction of meaningful patterns, through machine learning algorithms, from such unstructured text is called text mining (Hotho et al., 2005). We explore machine learning for text mining to add novel perspectives to patient journey mapping by accessing larger-scale opinions and contexts of patients. This approach allows designers and researchers to efficiently utilize the value of online patient stories (McRoy et al., 2018; Murphy, 2012).
There are two types of machine learning approaches: supervised and unsupervised learning (Murphy, 2012). Supervised learning predicts patterns within the data using the labeled (training) datasets created by humans (e.g., designers). In text mining, designers and researchers use supervised learning to build the classifier that learns how meaning is to be established (i.e., how designers labeled and categorized datasets). The learned classifier classifies data using the most probable label from the pre-defined labels created by the designers. At this stage, the supervised machine learning algorithm (i.e., the classifier) also enriches and quantifies the meaning (by generating patterns). Thus, the good performance of supervised learning requires a training dataset with a large number of and high-quality labeled text. Yet, creating such a training dataset (e.g., by manually labeling text documents) requires a significant amount of labor.
Unsupervised learning, on the other hand, discovers clusters or patterns within unlabeled datasets. Unsupervised learning does not provide an explicit explanatory description of the pattern’s meaning. In text mining, designers and researchers use unsupervised machine learning to build an algorithmic model that allocates the unlabeled text dataset to the required number of different clusters. To make the clustering meaningful, designers and researchers need to uncover and interpret the potential reasons for the resultant clustering. Consequently, designers and researchers who do not have sufficient knowledge about the context of the data analyzed may find it challenging to contextualize the patterns (i.e., interpret the meaning) generated from unsupervised machine learning.
In this article, we explore both supervised and unsupervised machine learning techniques to study how patterns arising from such techniques support the development of patient journey maps. It means that we use hybrid intelligence, utilise the complementary strengths of humans (designers and data scientists) and machine learning (Dellermann et al., 2019; Kamar, 2016). In supervised machine learning, designers create meaning from a small part of large dataset and machine learns the patterns of the meaning and applies this to the rest of the large dataset. In unsupervised machine learning, machine generates the patterns and humans create the meaning (interpret) from the pattern. Table 2 illustrates the different procedural approaches of supervised and unsupervised learning for patient journey mapping as a form of hybrid intelligence.
Table 2. Different procedures taken by researchers—supervised and unsupervised machine learning for patient community journey mapping.
| Machine learning types | Initial step | Follow-up step |
| Supervised |
Designers and researchers label the dataset using a part of the given dataset (create meaning). This leads to the first and rough identification of patient’s experience topics for patient journey mapping. | Machine learning (classifier technique) learns how the designers have labeled the dataset. After learning, it assigns other unlabeled datasets to one of the most probable labels. Machine learning techniques (another technique) can further quantify and reveal correlations in the patients’ experience topics. |
| Unsupervised | Machine learning allocates the entire dataset (patient experiences) into an adequate number of clusters that do not have a specific contextual label. | Designers and researchers interpret, contextualize, and label each cluster of experience topics (create meaning). It leads to another set of information lists identified, related to patient experience to be added on patient journey mapping. |
Studies for Approaching Patient Community Journey Mapping through Data-Driven Techniques
We present two studies to explain the potential value of using online patient stories with machine learning to create patient community journey maps: Study 1 creates a general cancer journey based on supervised machine learning, and Study 2 creates a head and neck cancer journey based on unsupervised machine learning. Each study comprised three steps: preparation, analysis, and creation of additional patient experience information on the patient journey map; these three steps are summarised in Figure 1.
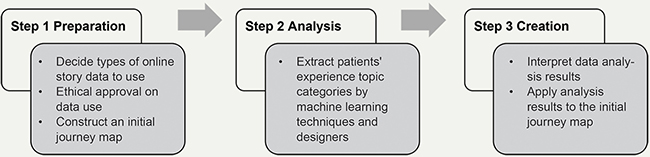
Figure 1. Patient community journey mapping procedure for Studies 1 and 2.
We also considered the ethical and privacy concerns of using online patient stories for both studies. Although data on social platforms are considered publicly available data (Moreno et al., 2013), we believe that designers and researchers should inform platform developers or the authors of the stories about the research. We sought guidance from the university’s human research ethics committee in this regard so that ethical and privacy concerns were met and the study design was subsequently approved by the University Human Research Ethics Committee. Based on the committee’s advice, we removed all direct (e.g., name, address, zip code, telephone number, voice, and picture) and indirect identifiers (e.g., institutional affiliations, occupation, and geographic region) before analyzing the data. Further, we informed the platform developers (via email) about the research.
Study 1: Supervised Machine Learning (Topic Classification) to Develop a Patient Community Journey
Step 1 ‘Preparation’: To Decide Data and Construct an Initial Journey Map
The first step required determining and preparing the dataset for the study. To do so, designers searched for an online platform to collect data that matched the requirements of our research. The designers identified whether the platform had stories written by the target audience of the study (in our case, cancer patients), had a large number (tens of thousands) of stories for effective and useful machine learning analysis, and which were written in English to be understandable by all the researchers in determining the types of online patient stories analyzed. Designers and data scientists used patient stories from the Canadian Cancer Society (https://cancerconnection.ca/) social platform. It has a Forum section comprising eleven sub-sections, wherein patients discuss their care-path experiences (see Appendix 1). Each sub-section has threads that include the first posts and replies to the posts (see Appendix 2). We did not distinguish between the two and considered each as independent individual stories. Thus, each post is a story unit included in our study.
The posts on this platform were mainly online patient stories about themselves: reflections about their daily life at home and in the hospital, descriptions of experiences and contexts of being diagnosed, undergoing treatment, and living with cancer (e.g., concerns, symptoms, treatment, coping strategies, barriers to change). Included posts were requests for information related to their care trajectory, emotional and social support, and sharing their health status or other experiences. The stories were mainly created by patients (peer-to-peer), and sometimes also by family members (caretakers).
Some patients or family members specify their health status in their posts or their personal profiles (e.g., which cancer type or stage of cancer development they are experiencing). However, we did not include data about personal health status. Even though such data would allow us to correlate care path experience to health status we did not want to include such personal health data in the analysis to avoid the use of identifiable information. (This was also recommended by our ethical committee). The data we used are the posts created from December 2010 to November 2020.
One lead designer and six master design students constructed the initial patient journey map based on a thematic analysis (annotation) of 137 stratified, randomly sampled posts from all 11 sub-sections of the platform. The lead designer was experienced with data-driven pattern design projects over the past three years before being involved in this case. She supervised the six design students involved in this process who had no previous experience with data-driven design approaches before this particular design study. They applied a sentence-by-sentence analysis approach (separating posts based on punctuation) to inspect the types of experience topics mentioned in each post. Since each post contained multiple sentences with different topics, it was sufficient to analyze them on a sentence level to identify all patient story topic categories within each post. A data scientist explored together which document level of text analysis is most adequate: by sentence or post. The data scientist had ten years of working in text mining but had never worked collaboratively with designers before.
To explain the thematic analysis procedure, the six master design students were divided into three groups (each assigned to two students, with 45, 46, and 46 posts, respectively). In each group, the two students independently conducted qualitative data coding for the given posts. They interpreted each sentence of the posts using descriptive code. Then, they clustered similar descriptive codes and labeled each cluster with a narrative code. Their independent analysis was followed by a review of each other’s interpretation to see where their clustering should be further aligned. Next, the six design students and one lead design researcher examined all codes and sentences together to examine how everyone could agree upon clustering outcomes. This procedure of double coding was to achieve higher reliability of the coding results (Blessing & Chakrabarti, 2009). The entire process took around three weeks, and the outcome became the basis of the training dataset for the next step of conducting the topic classification (supervised machine learning model). As a result of this procedure, four main phases within the cancer patient journey were distilled by this analysis: receiving a diagnosis, undergoing tests and making a decision for treatment, undergoing treatment and suffering side effects, and living life after cancer and fifteen experience topic categories were identified (the white square cards within each phase, as indicated in Figure 2).
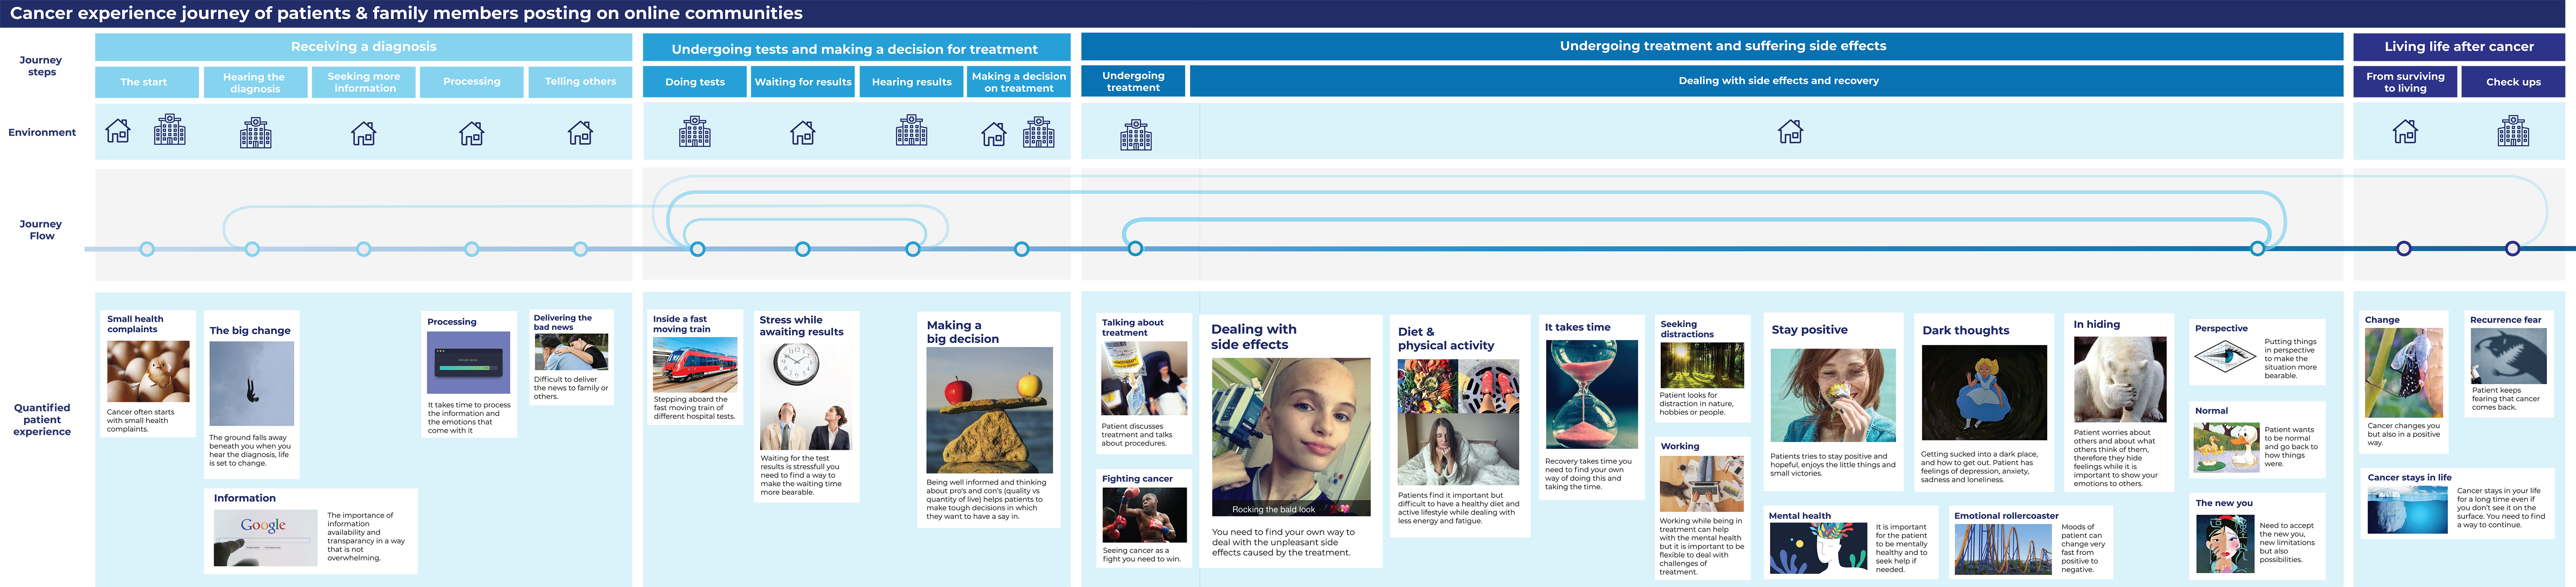
Figure 2. Initial cancer patient journey map based on manual thematic analysis of 137 stories
(click on the figure to see a larger version.)
Step 2 ‘Analysis’: To Extract the Experience Topic Categories and Patterns
In the second step, we extracted the topic categories of the care path experiences and detected valuable patterns between experience topic categories by applying a supervised machine learning algorithm (topic classification) to the entire dataset (patient stories, posts). This step included two sub-steps, as indicated in Figure 3. In Step 2a-supervised, designers manually created and improved the training dataset; a data scientist built the classifier by pre-processing and using the training dataset. In Step 2b-supervised, the data scientist applied machine learning algorithms, including the classifier to the entire dataset to quantify and find the relationships between experience topic categories.
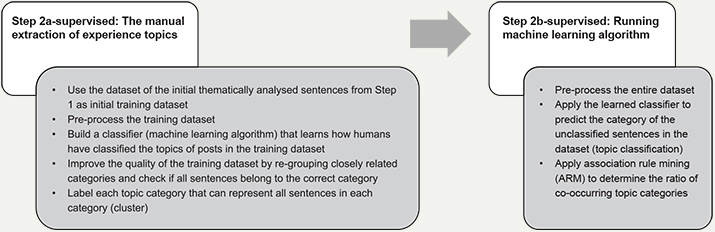
Figure 3. Analysis procedure of step 2 with supervised machine learning techniques
(topic classification and association rule mining).
Given the topic of our study and the efficiency of building high-quality training datasets within the limited time, we focused, in this step, on one of the four identified phases of the initial patient journey map elicited in Step 1. We selected the stories within ‘undergoing treatment and suffering side effects’ which comprised a total of 14,391 posts (with 112,758 sentences). We applied a sentence-by-sentence analysis approach (separating posts based on punctuation) to inspect the types of experience topic categories written by the patients. Each post contained multiple sentences with different story topics and the analysis of these stories on a sentence level was sufficient to identify all topic categories within each post.
A data scientist in our team applied two machine learning techniques to extract valuable patterns from the entire dataset: the first being topic classification and the second, association rule mining (ARM). The topic classification is for the classifier to learn how designers classified the topic categories of the sentences in the previous step (Step 1) and then to assign the sentences of the entire dataset into the most probable topic categories among the pre-defined topic categories. ARM finds a co-occurring relationship between each experience topic category. It is an if-then rule comprising an antecedent and a consequent. It provides the value of the ratio of users mentioning a set of co-occurring topics compared to all users.
The data scientist performed the topic classification (i.e., extracting the experience topic categories) by using the training dataset belonging to the undergoing treatment and suffering side effects phase from Step 1 (the initial annotation through thematic analysis). To do that, the data scientist first pre-processed the sentences of the training dataset by eliminating stop words (e.g., you, but, and in), changing all terms (i.e., words) to lowercase (e.g., from Cancer to cancer), and lemmatising all terms (e.g., from pills to pill). Further, he applied customized rules to delete sentences in which words or phrases were common in the sentences but non-contextual. Additionally, the data scientist built a classifier by applying the following machine learning method to the pre-processed dataset: term frequency-inverse document frequency (TF-IDF) vector (Salton & Buckley, 1988), non-negative matrix factorization (NMF; Févotte & Idier, 2011), random forest (RF; Breiman, 2001), and grid search approaches (Pedregosa et al., 2011). The classifier learns how designers (design students) categorised the sentences into certain clusters (as done in Step 1) and then categorizes unlabeled sentences to the most probable category (cluster) among the categories created by the designers (conducting topic classification). Specifically, each pre-processed sentence of the training dataset was first transformed into a TF-IDF vector, a set of numerical weights indicating how important a particular word is to each sentence. A high TF-IDF value is given to a term in a sentence when the term frequently appears in the sentence but occasionally appears in other sentences. As a result, each sentence of the training dataset gets its TF-IDF vector and its topic category (one of the twelve identified previously). The classifier then learns the patterns for classifying each sentence into a particular topic category by applying NMF and RF. The classifier uses NMF to transform the TF-IDF vector into a meaningful input of RF. RF is used to predict the topic category of each sentence given the corresponding input. The grid search approach was applied to tune the hyperparameters and hence optimize the classifier performance. The data scientist evaluated the classifier’s performance through cross-validation, where 80 percent of the training dataset was used to train the classifier, and then the left 20 percent was used to test the classifier performance. The initial classifier showed bad performance; only less than 40 percent (in average) of the classified sentences had the same category as the original category the designers made.
To enhance the classifier performance, the seven designers (students and lead designer) modified the training dataset by re-grouping or eliminating topic categories if they proved difficult to distinguish from other topic categories. For example, the perspective topic from Step 1 (about putting things in perspective to make a situation more bearable) had many overlapping keywords with other topic categories, so this topic was eliminated. Another example is that sentences belonging to the emotional rollercoaster topic (about sudden mood shifts of patients) were re-assigned into the stay positive and dark thoughts topics due to the many overlapping keywords with these categories. The designers also eliminated some sentences in the ‘emotional rollercoaster’ that were difficult to assign to one of the other two topics. As a result, three topic categories created in Step 1 were merged or eliminated (89 out of 581 sentences) were eliminated from the initial dataset. Further, the designers closely inspected whether all classified sentences belonged to the correct category. They did this by reading each sentence and its processed keywords, which the classifier uses in its analysis, of each sentence (for example, the sentence “drink TONS of water stops me from feeling nauseous” was checked if it is assigned to the correct category by inspecting its processed keywords: drink, tons, water, stop, feel, and nauseous).
Ultimately, the designers and a data scientist conducted five cross-validation cycles and improvements to the training dataset (by repeating the above task and running cross-validation checks). This resulted in 492 sentences for the training dataset distributed over twelve topics. The final classifier performance for the dataset improved; 66 percent (on average among the twelve categories) of the sentences in the classifier are classified the same as the categorization that designers originally made. Although the final classifier performance measures have improved over the initial measures, the data scientist was unsatisfied with the outcome. However, the designers found the classifier was still inspiring and satisfying to proceed further. The data scientist had the opinion to further simplify the topic categorization that designers made and generated (or labeled) more learning datasets; the designers wanted more than just simple categorization between the sentences in the dataset. As an example, designers wanted the topic of wanting to have an understanding relationship with the medical team (effective communication, information, and respect) instead of the medical team. However, the designers discussed with the data scientist that the current level of complexity (including more context) in the categorization is adequate for designers’ inspiration, and there is less value in having further precise categorization which requires more designers’ labor. Designers already analyzed a part of the entire dataset and derived topic categories of the patient experience. Thus, further improving the performance was not worth it. It is because the topic classification was used as inspirational material, not as evidence of patient behavior, to be supplemented with other design tools or methods such as in-depth interviews or co-creation sessions. Thus, the adequate amount of a training dataset to realize that classifier performance depends on the complexity and the difficulty of the topic categorization the designers want, given requirements set in concertation with other stakeholders.
The labels of each topic category, obtained from categorising (thematic analysis) sentences, and the number of labeled sentences for each theme are presented in Table 3. A total of 492 labeled sentences were used as the training dataset that the algorithm uses to learn how designers assigned each sentence to one of the twelve topic categories.
Table 3. Number of sentences labeled to each topic.
| Category | The label of each topic category | Number of labeled sentences |
| 0 | Being/attempting to be positive in the cancer journey |
20 (4%) |
| 1 | Dealing with overwhelming fatigue in daily life | 28 (6%) |
| 2 | Performing appropriate physical exercise for better recovery | 40 (8%) |
| 3 | Experiencing eating/drinking issues and finding (diet-related) solutions | 64 (13%) |
| 4 | Experiencing negative feelings (depression, anxiety, and loneliness) in the cancer journey | 30 (6%) |
| 5 | Experiencing physical side effects from the treatment and finding ways to counter-act these | 97 (20%) |
| 6 | Finding out how to combine work with treatment recovery | 16 (3%) |
| 7 | Getting support from family, friends, and peers but also dealing with misun-derstanding and estrangement | 32 (7%) |
| 8 | Making a conscious decision for personal care/health by comparing the quality and quantity of life | 32 (7%) |
| 9 | Sharing cancer news with others using a medium that suits the patient | 22 (4%) |
| 10 | Undergoing treatment procedures | 78 (16%) |
| 11 | Wanting to have an understanding relationship with the medical team (effective communication, information, and respect) | 33 (7%) |
| Total | 492 (100%) |
Step 2b-supervised required four steps in running the machine learning algorithm to find the valuable quantification (frequency) of and relations (co-occurrence) between experience topic categories within the entire dataset. In the first step, the data scientist pre-processed the entire dataset as did in the previous step (e.g., eliminating stop words and lemmatizing all terms). Then, the classifier developed in Step 2a-supervised was applied to the entire dataset (112,758 sentences) which was pre-processed and each sentence was assigned to the most relevant one among the twelve topic categories. Table 4 summarises the number of sentences assigned to each category in the number of given sentences. The number and percent of posts in each category were counted and presented in the last column of Table 4 to observe how often the posts (not sentences) claim each experience topic category. Thus, the designers could obtain a numerical weighted value (frequency) for the patient’s experience and identify how many posts include the sentence belonging to one of the twelve topic categories identified by the designers. As an example, 3356 posts (23 percent of all posts) of patients talk about being and attempting to be positive in the treatment and side effect phase of their cancer journey.
Table 4. The number and percentage of stories related to the experience topic.
| Category | Number of assigned sentences | Number of stories (% of total stories) |
|
| No. | Label | ||
| 0 | Being/attempting to be positive in the cancer journey |
4207 |
3356 (23%) |
| 1 | Dealing with overwhelming fatigue in daily life | 8261 | 5154 (36%) |
| 2 | Performing appropriate physical exercise for better recovery | 3670 | 3356 (23%) |
| 3 | Experiencing eating/drinking issues and finding (diet-related) solutions | 10786 | 6286 (44%) |
| 4 | Experiencing negative feelings (depression, anxiety, and loneliness) in the cancer journey | 5718 | 4044 (28%) |
| 5 | Experiencing physical side effects from the treatment and finding ways to counter-act these | 23081 | 10282 (71%) |
| 6 | Finding out how to combine work with treatment recovery | 2824 | 1990 (14%) |
| 7 | Getting support from family, friends, and peers but also dealing with misun-derstanding and estrangement | 10746 | 6320 (44%) |
| 8 | Making a conscious decision for personal care/health by comparing the quality and quantity of life | 7324 | 4877 (34%) |
| 9 | Sharing cancer news with others using a medium that suits the patient | 7215 | 4848 (34%) |
| 10 | Undergoing treatment procedures | 21945 | 9454 (66%) |
| 11 | Wanting to have an understanding relationship with the medical team (effective communication, information, and respect) | 6981 | 4712 (33%) |
In the final, fourth step, the data scientist applied ARM to the entire dataset already classified into each corresponding topic category in the previous steps. The ratio of the co-occurrence relationship between each topic category was determined. ARM identified the confidence values which indicate how often the identified rule—if a set of topic categories (antecedent) is discussed by a patient, another set of categories (consequence) is also mentioned by the same patient—is valid for all patients (Agrawal et al., 1993). This resulted in sixty co-occurring relationships, partially presented in Table 5. As an example, rule 0 shows that if more than one sentence of a patient talks about ‘being and attempting to be positive in the cancer journey,’ there is a 79 percent chance that more than one sentence of the patient also talks about experiencing physical side effects from treatment and finding ways to counteract these.
Table 5. Some results of association rule mining (extended version is in Appendix 3).
| Rule | Antecedents | Consequents | Confidence |
| 0 | Being/ attempting to be positive in the cancer journey |
Experiencing physical side effects from treatment and finding ways to counter-act these |
0.79 |
| 1 | Experiencing physical side effects from treatment and finding ways to counteract these | Being/ attempting to be positive in the cancer journey | 0.26 |
| 2 | Undergoing treatment procedures | Being/ attempting to be positive in the cancer journey | 0.26 |
| 3 | Being/ attempting to be positive in the cancer journey | Undergoing treatment procedures | 0.72 |
| 4 | Experiencing eating/drinking issues and finding (diet-related) solutions | Dealing with overwhelming fatigue in daily life | 0.44 |
| … | … | … | … |
| 55 | Making a conscious decision for personal care/health by comparing the quality and quantity of life | Undergoing treatment procedures | 0.74 |
| 56 | Sharing cancer news with others using a medium that suits the patient | Undergoing treatment procedures | 0.70 |
| 57 | Undergoing treatment procedures | Sharing cancer news with others using a medium that suits the patient | 0.40 |
| 58 | Undergoing treatment procedures | Wanting to have an understanding relationship with the medical team (effective communication, information, and respect) | 0.37 |
| 59 | Wanting to have an understanding relationship with the medical team (effective communication, information, and respect) | Undergoing treatment procedures | 0.74 |
Step 3 ‘Creation’: Applying the Analysis Outcome to the Initial Patient Journey Map
As the third step, designers applied the machine learning outcomes from the previous steps to the initial patient journey map. As already mentioned, the analyzed data were only for the undergoing treatment and suffering side effects phase and the designers therefore explicitly applied the outcome to this phase. Figure 4 shows an overview of the final patient journey map. The final patient community journey map comprises twelve experience topic cards for the undergoing treatment and suffering side effects phase.
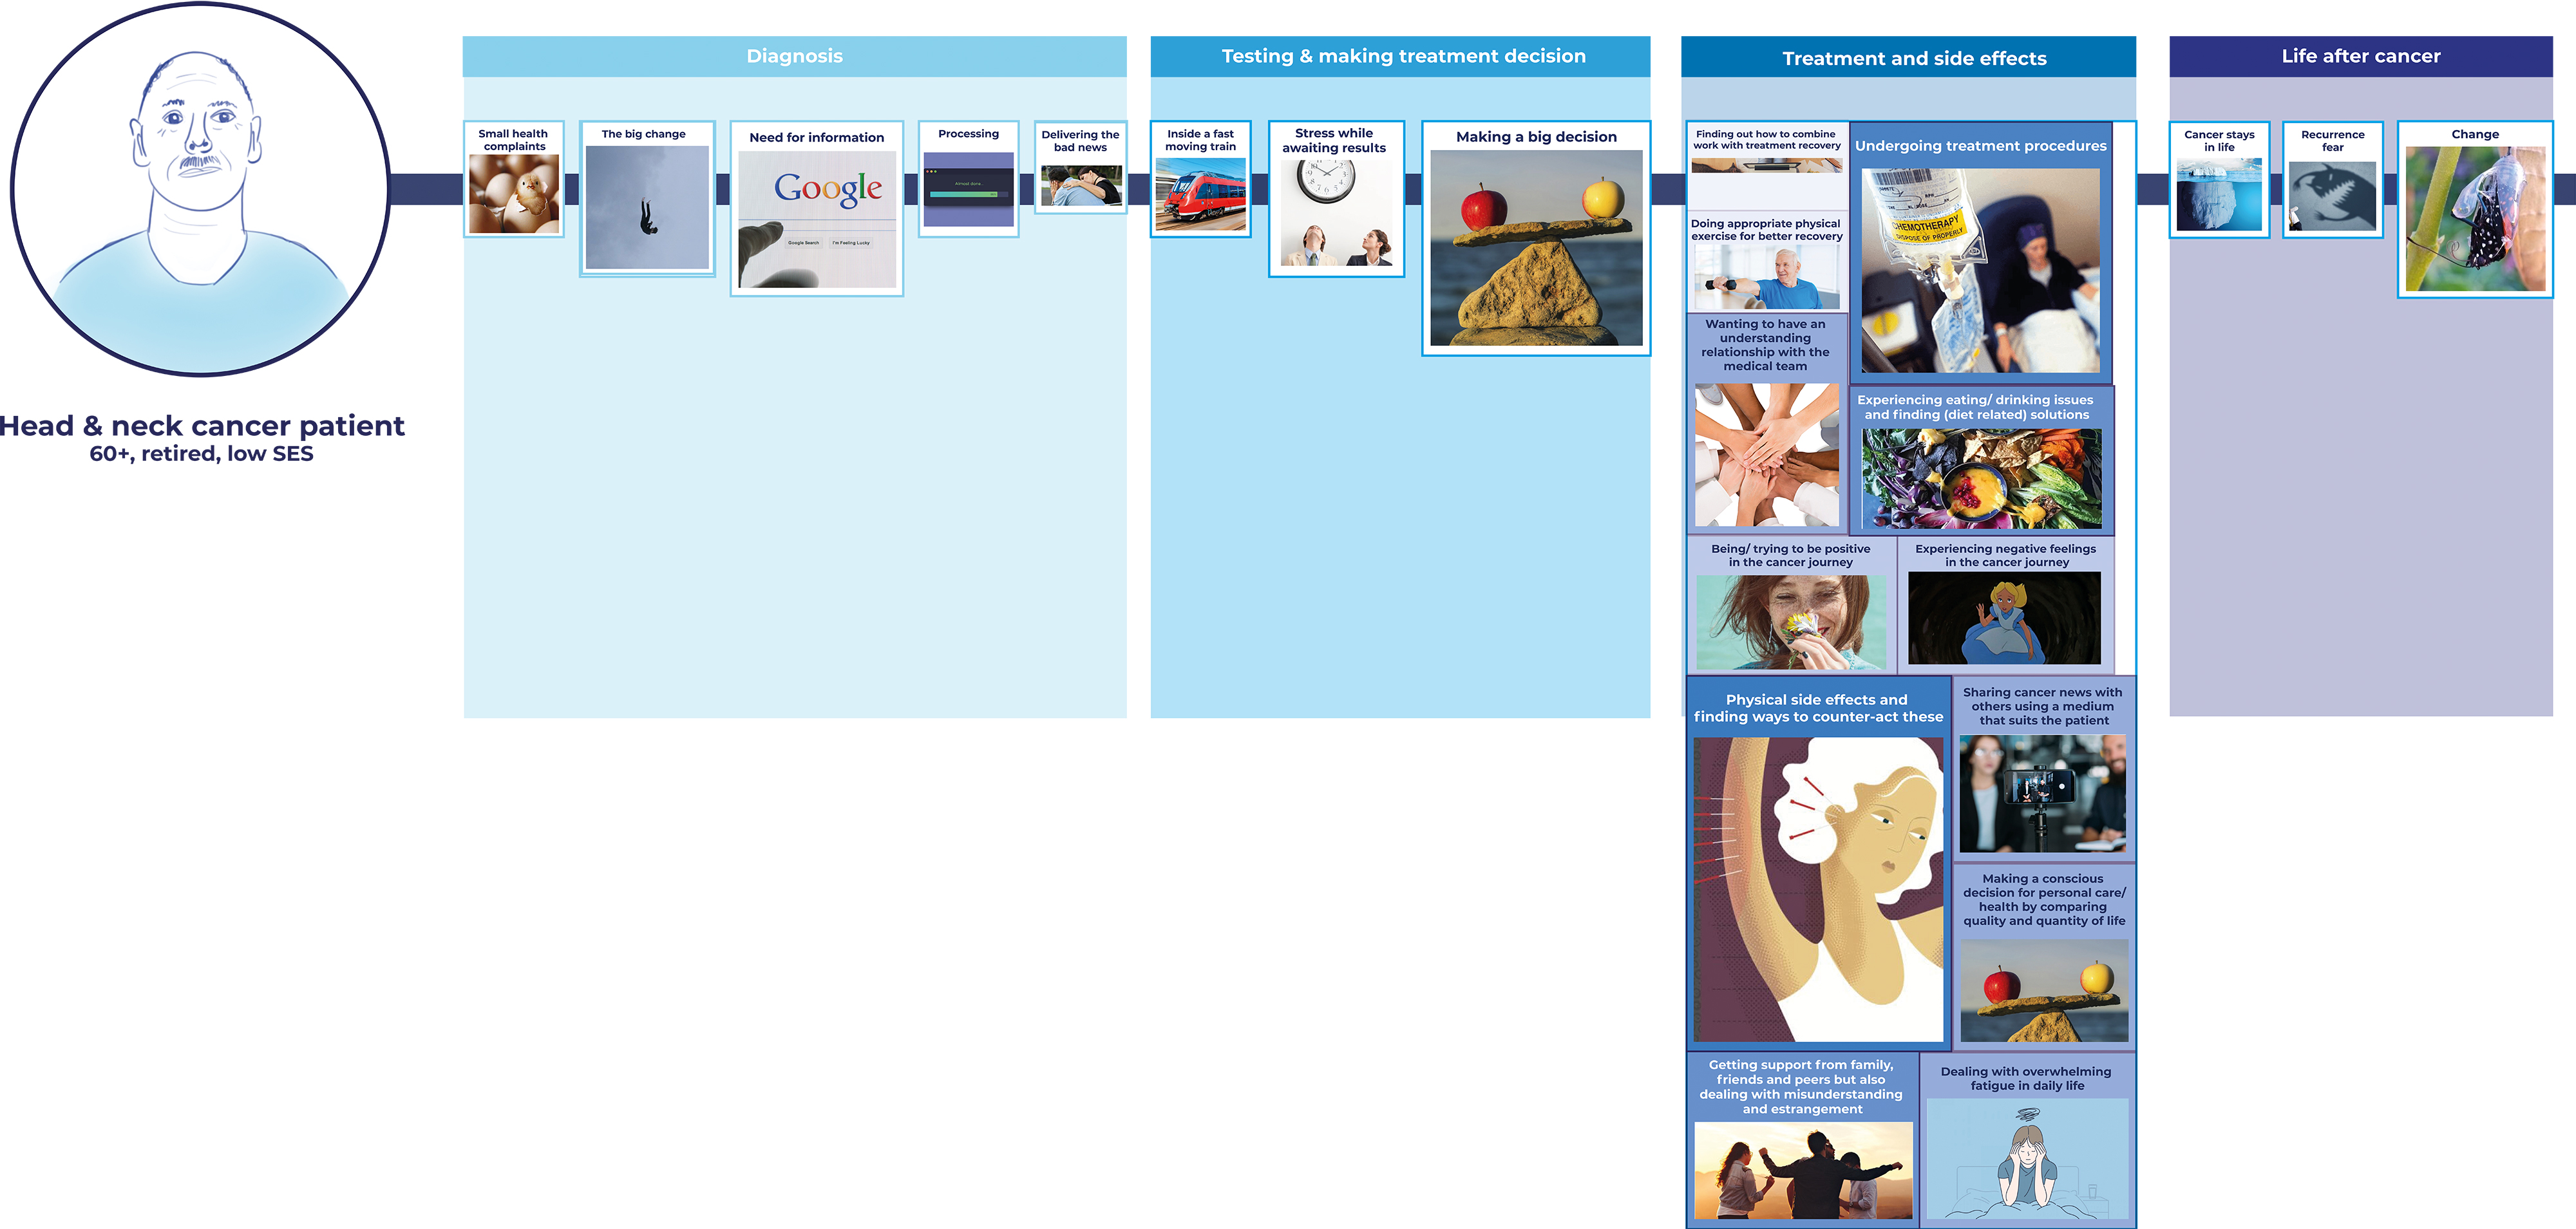
Figure 4. An overview of the interactive cancer patient community journey map including machine learning analysis results for the ‘undergoing treatment and suffering side effects’ phase (click on the figure to see a larger version.)
To specify, topic classification and ARM provided the designers with quantification of patients’ experience topics as well as insightful relationships between these topics. Based on this, designers added three layers to the initial journey map, as shown in Figures 4, 5, and 6. In the first layer (Figure 4), designers presented the twelve topics generated from Step 1 and Step 2; the label of the experience topic is displayed with a relevant image. In the second layer (Figure 5), designers expressed the quantification of experience (i.e., how many sentences are classified into the topic clusters) through the size of the card (proportional to the number of stories mentioned in the topic) and the darkness of its color (with darker colors indicating a higher number of stories mentioned). The designers also indicated percentage-wise how often each topic was mentioned. To increase the contextual understanding of each topic, designers added representative quotes from the sentences used for the training dataset. In the third layer (Figure 6), designers displayed insightful relationships between the different experience topics through the thickness of the linkage-line between the antecedent and consequent topic cards (with thicker lines indicating higher relevance).
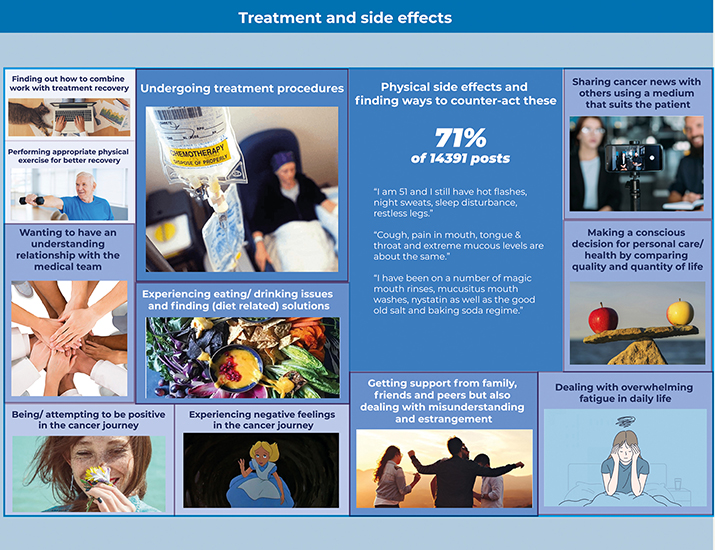
Figure 5. The second layer of one experience topic card with the percentage of patient posts that mention the topic (the result of topic classification).
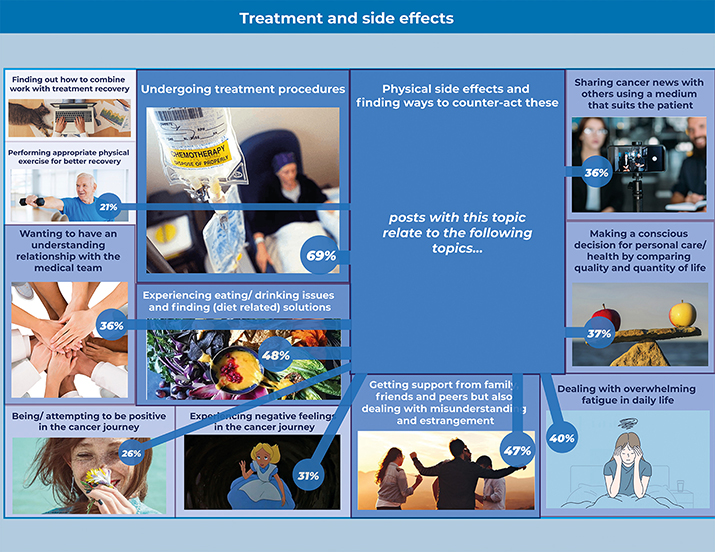
Figure 6. The third layer of one experience topic card shows the co-occurrence relation between the experience topics (the result of association rule mining).
Designers initially derived the twelve experience topic categories from their readings of the sampled posts in Steps 1 and 2. In addition, through the process of improving the classifier performance, they could reconsider the quality of their topic categories. However, despite the insufficient classifier performance, designers were still satisfied with the research outcomes. This is because they used the findings as inspirational material for the next design phase, not as evidence for making decisions. Designers supplemented the analysis results with other user studies (e.g., co-creation sessions with medical experts and patients) that provided adequate validation.
Study 2: Unsupervised Machine Learning (Topic Modeling) to Develop a Patient Community Journey
Step 1 ‘Preparation’: To Decide Data and to Construct an Initial Journey Map.
The first step in Study 2 was the selection of the dataset to explore and develop an initial journey map based on the three criteria explained in Study 1. We decided to use the head-and-neck cancer patient group forum in the Macmillan Cancer Support Online Community (https://community.macmillan.org.uk/cancer_types/head-neck-cancer-forum). We collected both the first posts and replies as individual stories (giving a total of 30,037 posts; an example is given in Appendix 4). We removed all direct and indirect identifiers to adhere to the confidentiality requirements.
The posts on this platform had the same characteristics as Study 1, except that it had a group page particularly dedicated to head-and-neck cancer patients. Thus, the platform had online patient stories consisting of self-narration and reflections about their daily, contextualized experiences of living with head-and-neck cancer and undergoing treatment. The stories were made mainly through interaction among patients and family members. As in Study 1, some users described their health status in the post, but here again we did not include health status in our study to avoid the risk of including identifiable data. The data we used are the posts created from October 2009 to November 2020. Two designers of Study 1 were involved in this process: the lead designer who has experience working with data-driven approaches, and one design student who had experience with Study 1. The same data scientist from Study 1 was involved in this study.
To construct the initial patient journey map, designers used the head-and-neck cancer patient care path that our project partner, a medical doctor from a Dutch academic hospital, shared in the form of a flowchart. The flowchart and the phases of the care path included the types of stakeholders involved and the types of information provided to and collected from the patient. Further, designers referred to the information booklet given to patients for their first cancer diagnosis visit. The designers took all the information from the flowchart and the booklet and visualized it as a patient journey map, as indicated in Figure 7. The top part of the journey map shows the types of care path phases, activities, and stakeholders involved. The bottom part shows the information and data currently provided to and collected from patients in each care path phase.
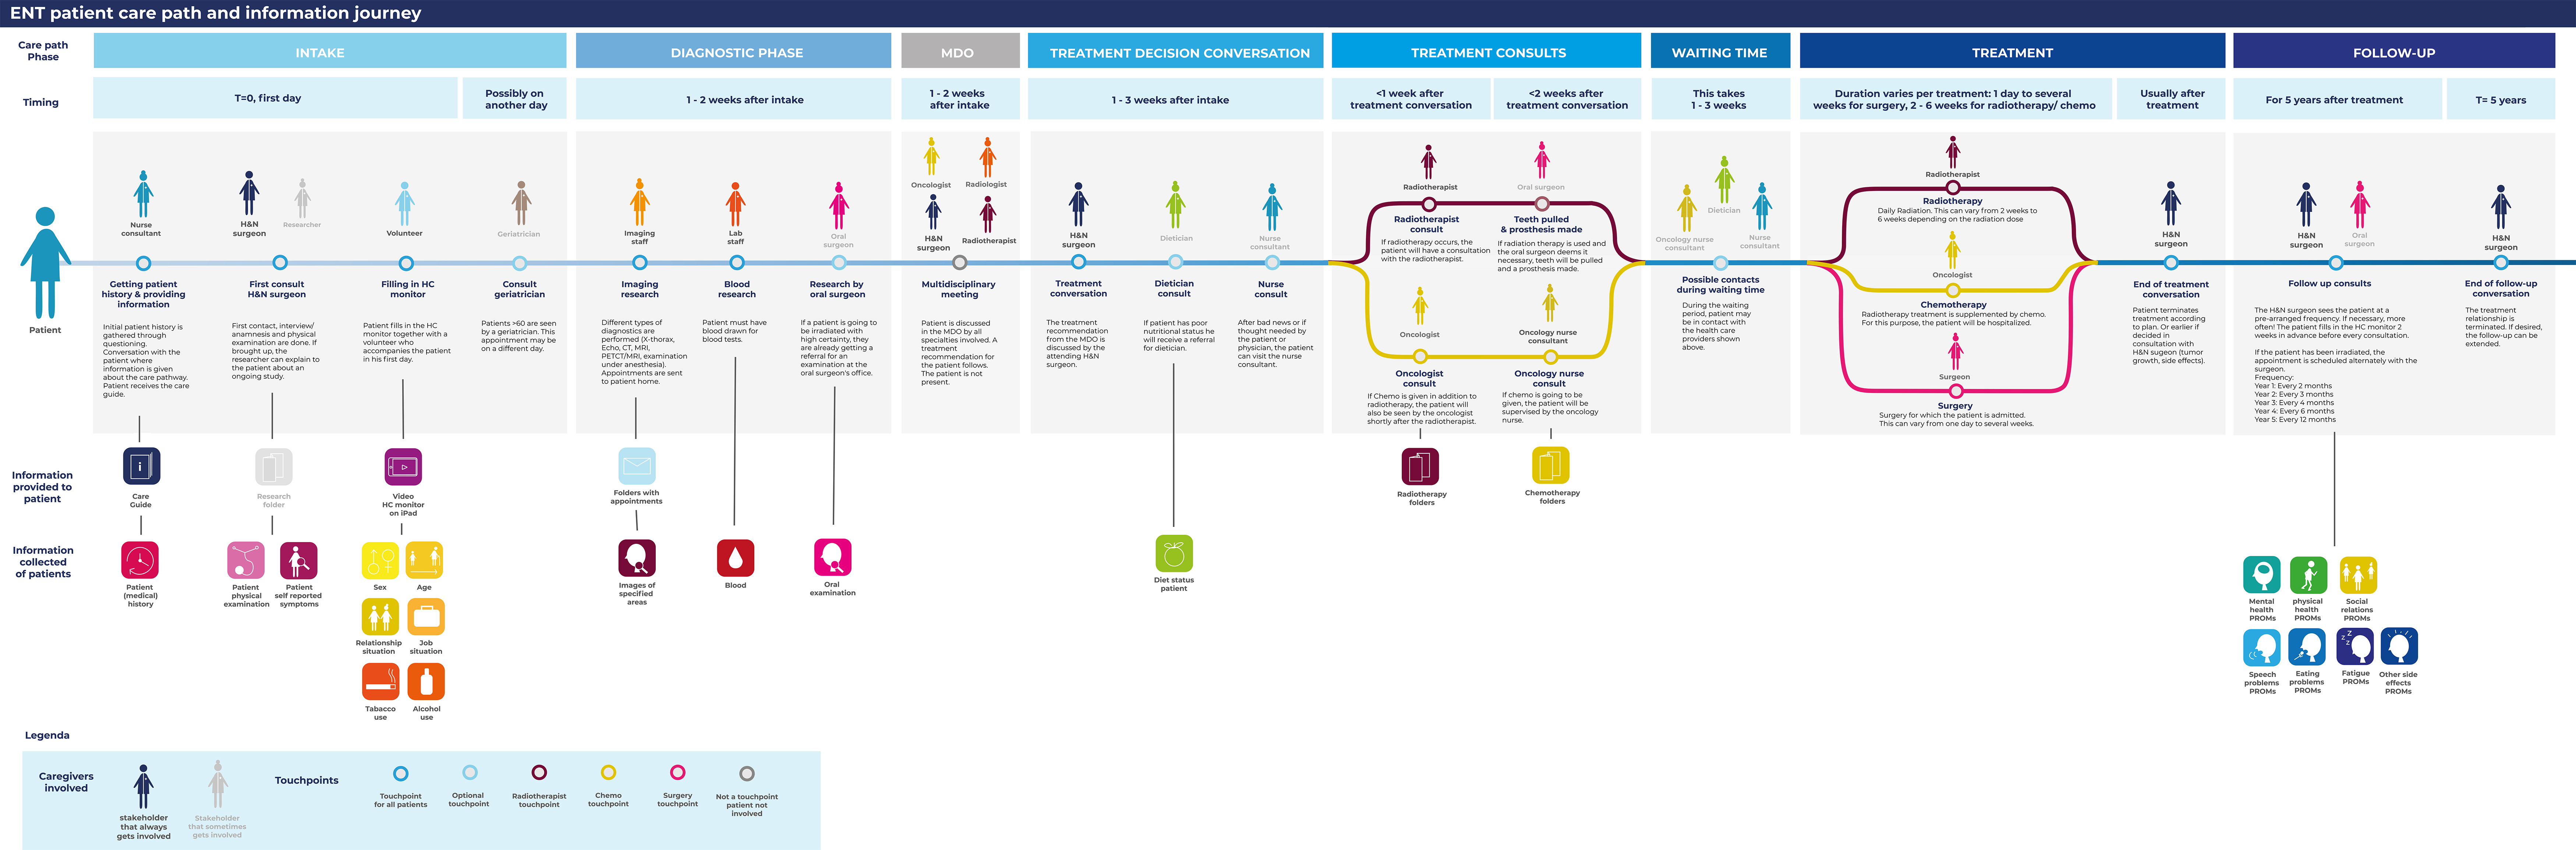
Figure 7. The visualized version of the initial patient journey map (click on the figure to see a larger version.)
Step 2 ‘Analysis’: Extraction of Experience Topics
The second step used an unsupervised machine learning (topic modeling) algorithm to extract topics of the online patient stories collected from the first step. This step included two different phases, as shown in Figure 8. Step 2a involves applying an unsupervised machine learning algorithm for text mining, called Latent Dirichlet Allocation (LDA; Blei et al., 2003), with the dataset to cluster the stories in the dataset according to topic similarity. Step 2b-unsupervised involves extracting topics manually from the discovered clusters. Three activities were performed to extract the topic clusters in the dataset using LDA (Step 2a-unsupervised).
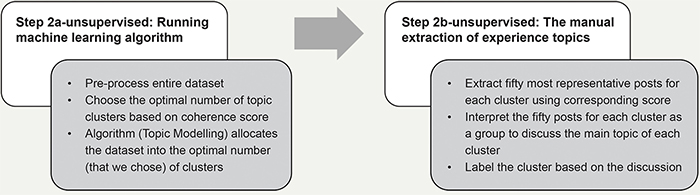
Figure 8. The procedure of conducting Step 2 (analysis) with unsupervised machine learning (topic modeling).
In the first activity, the data scientist pre-processed the dataset to enhance LDA performance. This was done to remove all stop words, digits, and hyperlinks (via algorithm), make all words lowercase and lemmatized (via algorithm), and delete the words or phrases common in the posts but non-contextual (by manually scanning the stories).
In the second activity, the data scientist applied LDA to the pre-processed dataset. The LDA automatically discovers sets of keywords that appear frequently in certain documents but not in others (Blei et al., 2003). Given that a sentence consists of too few words, a post-by-post analysis (instead of sentence-by-sentence) was performed to extract good keyword combinations. For each post, the LDA model estimates probabilities that the post corresponds to each topic cluster and assigns each post to a topic cluster with the highest probability. The number of posts and percent columns of Table 6 present the topics’ distribution across the stories. Further, LDA shows ten keywords that summarise the main content of the online patient stories cluster that differentiates it from the others. The ten representative keywords column of Table 6 shows the most representative keywords for each cluster.
Table 6. Topic modeling results.
| Cluster | Ten representative keywords* | No. of posts | Percent |
| 0 | regard, suggest, kind, story, carcinoma, book, dissection_reconstruction, flap_postoperative, holiday, comment | 1388 | 5% |
| 1 | soup, soft, calorie, dietician, meal, ensure, add, diet, milk, cream | 1790 | 6% |
| 2 | information, forum, party, join, link, line, number, member, thread, medical | 1494 | 5% |
| 3 | symptom, specialist, nose, test, worried, refer, ent, blood, voice, concern | 1543 | 5% |
| 4 | stuff, slowly, tip, stick, lack, improvement, appetite, eating, hot, slow | 897 | 3% |
| 5 | pay, job, local, health, lucky, nhs, form, medical, system, benefit | 1136 | 4% |
| 6 | spread, lymph_node, primary, MRI, left, sign, large, cell, gland, lung | 1518 | 5% |
| 7 | wife, man, fight, daughter, son, child, strength, age, heart, young | 1554 | 5% |
| 8 | bed, eye, minute, sit, spend, watch, close, drive, listen, move | 1186 | 4% |
| 9 | rest, half, tired, walk, step, fatigue, road, ready, plenty, sense | 1192 | 4% |
| 10 | type, option, decide, explain, outcome, decision, cure, chance, info, discuss | 1071 | 4% |
| 11 | word, metastatic_scc, run, fact, learn, load, pass, describe, wake, bother | 842 | 3% |
| 12 | relief, morphine, drug, painkiller, painful, hurt, prescribe, tablet, dose, liquid | 1168 | 4% |
| 13 | skin, exercise, heal, scar, speech, flap, arm, muscle, shoulder, swell | 1476 | 5% |
| 14 | return, dani_squamous, continue, update, progress, HPV, fingers_crosse, pleased, quick, therapy | 1202 | 4% |
| 15 | advise, chemotherapy, cisplatin, loss, complete, difference, ear, due, hair, short | 815 | 3% |
| 16 | write, message, phone, chat, forget, contact, add, profile, ring, detail | 1193 | 4% |
| 17 | saliva, mucus, ulcer, buy, burn, cough, mouthwash, rinse, spray, product | 1705 | 6% |
| 18 | affect, afraid, floor, concern, extremely, main, person, procedure, reaction, depend | 901 | 3% |
| 19 | realize, nice, amazing, light, wonderful, lovely, cold, share, lucky, wear | 949 | 3% |
| 20 | sick, rig, stomach, med, nausea, admit, ensure, awful, nutrition, fluid | 1135 | 4% |
| 21 | yesterday, meet, touch, honest, date, guy, lol, bring, totally, lovely | 1072 | 4% |
| 22 | dentist, low, top, jaw, dental, bone, mine, oral, leg, bite | 985 | 3% |
| 23 | partner, infection, feeling, turn, fear, scary, situation, scare, stress, horrible | 1071 | 4% |
| 24 | quickly, guess, move, imagine, ahead, grateful, process, prepare, begin, shock | 754 | 3% |
| Total | 30037 | 100% |
In the third activity, the data scientist suggested the optimal number of topic clusters based on a coherence score (Newman et al., 2010). Based on his suggestion and the designers’ need for insightful and diverse topics, we chose the optimal topic number to apply for topic modeling. It means data scientist provided either 20, 25, or 30 as the candidates on the optimal number of topic clusters because they had (close to) the highest coherence scores (See Appendix 5). Given this advice, the designers compared the three options for topic clusters. They then selected the topic cluster number that provided the best insights where the topic clusters were diverse and distinctive. This selection was made by reviewing the keywords of each topic (see Table 6) and reading the most relevant 50 posts to each topic cluster (provided by the data scientist) to confirm the meaning of each topic in each cluster. Designers also checked whether the data scientist should exclude certain words or phrases. For instance, a greeting among patients kept being copied in posts that could be deleted to increase the quality of topic modeling. In the end, the designers confirmed that the twenty-five clusters listed in Table 6 were the best solution, and the data scientist finalized the 25 topic clusters resulting from applying LDA to the entire dataset.
Step 3 ‘Creation’: Applying the Analysis Result to the Initial Journey Map
As the step to creating the insights for the journey map from the LDA outcome, the data scientist retrieved the top 50 relevant posts (that have the highest dominant topic score) for each of all the 25 topic clusters. While LDA identified the clusters, it did not provide an explicit meaning of the topic of each cluster. Therefore, the designers interpreted the meaning of the topic of each cluster by reading its top 50 relevant posts as well as its ten representative keywords (second column of Table 6). The fifty posts were the posts with the highest probabilities of the corresponding topic from LDA. The designers labeled the topic with the commonly shared topic. Two designers (the first and third author) discussed together to derive the label name. The designers derived the common topic after reading around the top 30 posts and used the 20 left posts to confirm the topic’s validity. As an example, the designers read the top 50 relevant posts for Topic 3 (symptom, specialist, nose, test, worried, refer, ent [ENT: ear, neck, and throat], blood, voice, concern) and labeled it as their [patients’] worries related to potential cancer symptoms and need for guidance on these uncertainties. The third column in Table 7 (i.e., Topic label) shows the common topics/label for each topic cluster.
Table 7. Designer’s interpretation of the topic for each cluster (full version in Appendix 6).
| Topic group |
Ten representative keywords | Topic label (Patients discuss and share their experience about ...) | Interpretation (Patients need for ... / Phase of care path it belongs to) |
| 0 | regard, suggest, kind, story, carcinoma, book, dissection_reconstruction, flap_postoperative, holiday, comment | Having holidays, and how to arrange them with travel insurance. | Tips for a special event / follow-up |
| 1 | soup, soft, calorie, dietician, meal, ensure, add, diet, milk, cream | What they can eat/drink and recipes to make it edible during their recovery phase. | Tips on food and drink ingredients and cooking recipes / treatment & follow-up |
| 2 | information, forum, party, join, link, line, number, member, thread, medical | What each treatment does and what the side/late effects are. | Sufficient information about treatment and side effects / treatment decision conversation & consult |
| 3 | symptom, specialist, nose, test, worried, refer, ent, blood, voice, concern | Their worries related to potential cancer symptoms and need for guidance on these uncertainties | Support to alleviate the worry about uncertain symptoms of having cancer / intake |
| … | … | … | … |
| 21 | yesterday, meet, touch, honest, date, guy, lol, bring, totally, lovely | The positive feeling about meeting, sharing stories, and helping between platform peers | Peer support possibilities/ throughout all phases |
| 22 | dentist, low, top, jaw, dental, bone, mine, oral, leg, bite | How to deal with mouth-related issues (reconstruction and appearance) after jaw surgery | Support for appearance change after the surgery / follow-up |
| 23 | partner, infection, feeling, turn, fear, scary, situation, scare, stress, horrible | Negative feelings that their partners are also often worried | Support for dealing with negative feelings / throughout all phases |
| 24 | quickly, guess, move, imagine, ahead, grateful, process, prepare, begin, shock | Being shocked after being diagnosed with cancer | Support for the first encounter with cancer/ intake & diagnostic |
Given that the online stories are patients’ questions and discussions about their care-path experience, the designers further interpreted the topic’s labels as information the patients have doubts about or need guidance on during their care path. For example, designers interpreted Topic 3, their [patients’] worries related to potential cancer symptoms and need for guidance on these uncertainties, as the patient’s need for support to alleviate the worry about uncertain symptoms of having cancer.
The designers also could identify the moment patients expressed this need in their journey by looking at the contexts of the associated representative posts. For this need (Topic 3), the designers found that patients expressed it mostly in the intake phase, the first phase of the initial care path.
Similarly, the designers could identify patient (information) needs and the identified moments of needs for all 25 topics. Based on this interpretation and moment of the needs, the designers assign these needs to the appropriate moment in the initial patient journey map constructed in Step 1. The fourth column (i.e., Interpretation) in Table 7 shows our interpretation of the needs expressed by patients and the relevant phase in their care path. The whole interpretation is given in Appendix 6.
As our next step, designers plotted the identified (information) needs and moments (phase) on the initial patient journey map, as shown in Figure 9. The added ‘information needs (found from topic modeling and interpretation)’ can be found in the lower section of the patient journey map. In the green area, information icons show the information that needs to be/is provided to the patient. The red bar shows information icons related to the information that should be/is collected from the patients. Designers illustrated the information provided and collected in the current practice with full-color icons. The new opportunities to collect and provide information that is found from topic modeling analysis are presented as black-and-white icons.
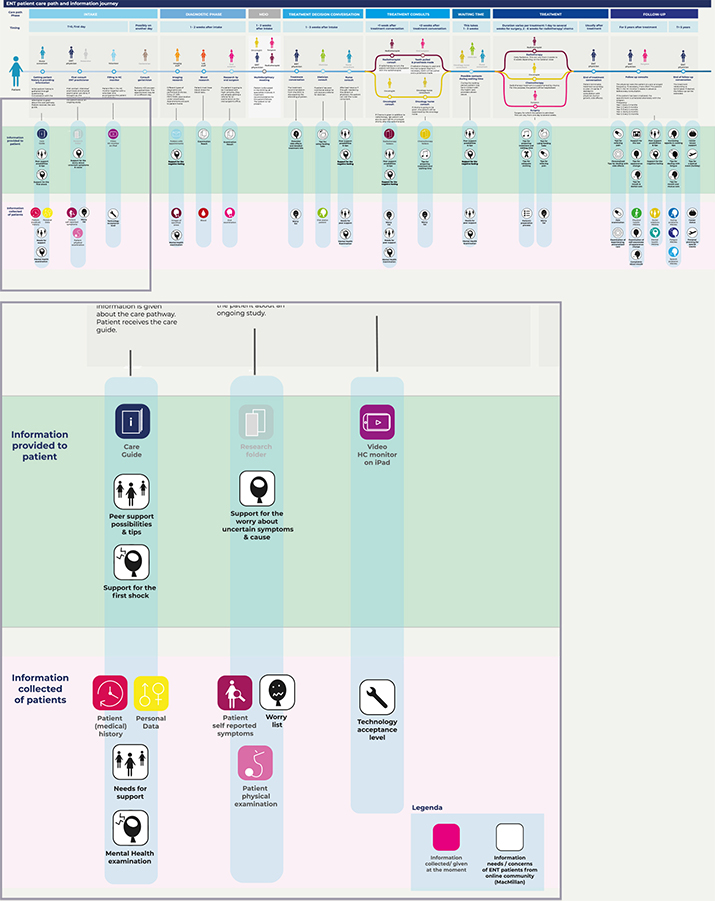
Figure 9. A part of the patient community journey map that is applied with unsupervised machine learning techniques for online patient stories.
Reflection on the ‘Designerly Use’ of Online Patient Stories and Machine Learning to Create Patient Community Journey Mapping
Based on our two studies, we reflect on what has worked and what did not work in terms of comparing supervised and unsupervised machine learning applications. First, the use of supervised machine learning models implies that an algorithm (machine), built by data scientists, learns and repeats on the basis of a preceding designerly activity (Cross, 1982)—that is, designers derive meaning from a small number of online patient stories. Next, the machine, built by data scientists, learns how such meaning is derived and applies its learnings to the rest of the online patient stories. In this way, supervised machine learning can quantify what designers have qualitatively derived. However, designerly activities are likely to have abductive reasoning as a basis, and this is difficult for the machine to learn (Stoimenova & Kleinsmann, 2020; Stoimenova & Price, 2020). And the more complex the task, the more data is required for supervised machine learning to reach the level. Thus, quantifying designers’ descriptive and contextual topics can require an enormous training dataset for the machine to learn and, therefore, also need considerable time and effort from designers. For this reason, designers and data scientists should then carefully evaluate whether the value of quantification through supervised machine learning is worth the amount of time and effort that has to be spent on building the training dataset.
Second, applying unsupervised machine learning to online patient stories means applying a designerly activity to the results from the machine learning the data scientist built. The data scientist’s analysis outcome gives designers an overview of what topic clusters can be found in an enormous amount of text. The designers then make creative interpretations to identify the context of topics. However, finding a good number of topic clusters can be challenging. In our design Study 2, we opted for 25 clusters, the same as the optimal number suggested by the machine and data scientist. Still, there were also two other viable solutions we had to study carefully. Unlike Study 2, the data scientist and machine learning may also set optimal numbers for clusters far higher or lower, and thus be of a lot of effort required to interpret or little inspiration for designers. For designers, a good number of clusters will consume a reasonable amount of time and effort to interpret but still provide enough variety of insightful information. What can be considered a reasonable effort and a good result can differ from designer to designer (and data scientist to data scientist), which means that the choice for a number of topic clusters is often subjective. Therefore, using unsupervised machine learning in journey mapping does not provide an absolute overview of the topics; designers and data scientists should know how to balance the machine (data science)’s optimal values and the values that can inspire designers.
Third, both supervised and unsupervised machine learning outcomes are probabilistic. Both machine learning approaches assess how likely each document belongs to one or another topic cluster in terms of contribution score. Often documents have probabilities of belonging to multiple topic clusters. The topic indicating the highest probability is called the dominant topic of the document, but this is (almost) never an absolute belonging to a topic. Therefore, designers should be careful to use the machine learning results from data scientists as a basis for their decision-making; we would recommend to triangulate and calibrate the results with other qualitative design tools and methods (e.g., interviews and more co-creative methods).
Therefore, the first guidance for both designers and data scientists is to use machine learning outcomes as a data-enabled instead of a data-driven approach. As in conventional, more qualitative patient journey mapping approaches, designers are recommended to use analysis outcomes as inspiration material. Thus, designers are guided to use machine learning analysis outcomes for (re)defining design problems and getting inspired for follow-up phases in the design process. For our two studies, both mappings were used as inspirational inputs for co-creation sessions with medical experts. In the first study, the medical doctors were asked to build their patient persona for a new service design based on the mapping (see upper part Figure 10). In the second study, the doctors were asked to use the mapping for ranking the top five information/data types to include in their system (see lower part Figure 10).
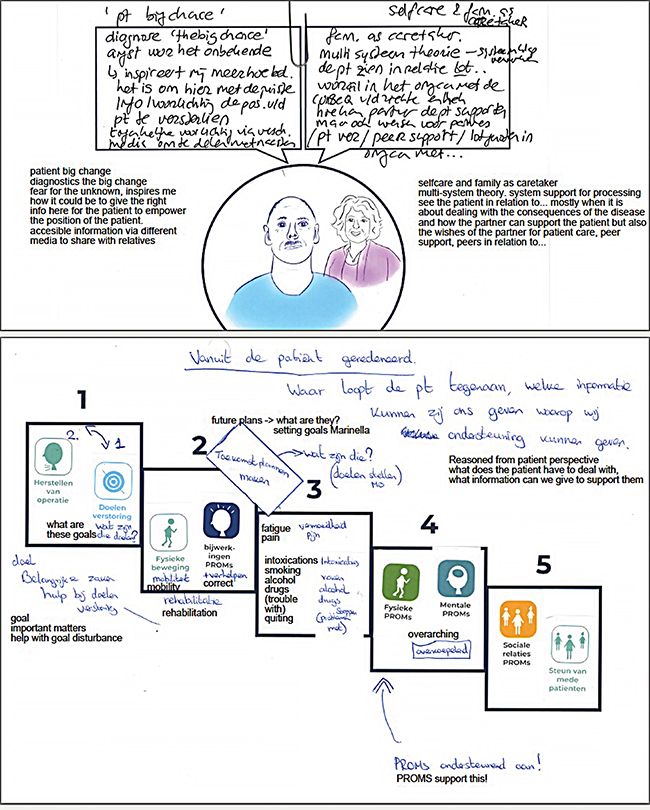
Figure 10. Results of a co-creation session using Study 1 and 2 patient community journey maps.
The second guidance is not to fixate beforehand on the purpose of data analysis. Online patient stories can be analyzed in various ways beyond the ways introduced in this paper. As an example, we can identify the sentiments from the topics or posts (e.g., negative, neutral, positive, or even anger, fear, happiness, surprise, etc.), health-related name/entity extraction (e.g., medical stakeholders, treatment, medicine, ailments discussed in the stories), and linkage between clusters using top keywords in each post (e.g., to search cause-effect relationship between topics). Thus, online patient stories can be approached in many different ways and, as such, can hold many surprises that could help in creating inspiring journey maps.
In conclusion, we experienced that the use of patient community journey mapping in the early explorative phase provides high acceptance from the medical field and patient communities, and as such supports design activities for patient-centred care (compared to when design processes are initiated through literature reviews or pilot interviews). What seems crucial here is that mappings are based on a scale of observations (i.e., more than thousands) that the medical research community can more easily relate to. The use of mapping at initial (briefing) stages of a design project opened opportunities both for more in-depth and broader collaborations in medical domains. For instance, hypotheses derived by designers from the mapping turned out to be interesting for medical experts since the data was derived from patients’ voluntarily reported daily (home) experiences that hospitals did not collect before. And, at later stages, designers were given access to information that normally was kept exclusive to medical researchers (such as allowing designers to attend consultations between patients and doctors and supporting the recruitment of patients through hospital channels).
However, there are still challenges to, and limitations of this way of working. First, online patient stories may not be representative of all patient experiences. For this reason, it is important to improve our understanding of the over- and under-reporting of particular experiences in online stories (e.g., more or less embarrassing or noticeable) and the experiences of the people who do not generate online stories (e.g., based on age, literacy, or low motivation). The large user dataset can thus have its own limitations, different from the conventional datasets from more qualitative user studies. We are currently investigating how online patient stories and more qualitative and co-creative user studies can be used in combination to tackle these limitations.
Another challenge is the designer’s trust in the machine learning model. Machine learning models do not provide one absolute outcome. Different machine learning models can provide different outcomes even if the same dataset is used. As an example, various machine learning models (e.g., BERTopic, NMF, or LDA) can be used for extracting topics from a vast amount of text data. Still, each model relies on different assumptions and criteria for optimizing outputs. Therefore, further exploration is necessary on how to increase the explainability of the machine learning models (Samek et al., 2019) to future designers’ awareness of such different outputs of models.
Discussion and Conclusion
We, as a team of designers and data scientists, developed a novel approach for overcoming the challenges related to representing user group experience in the design process of a societal transition in this study. Our approach, demonstrated in a healthcare context, captured broad and community-level data using online stories. This enabled the inclusion of tens of thousands of patient experiences derived from online platforms. We applied manual qualitative analysis techniques, such as thematic analysis for building training data, combined with automated text mining techniques using supervised and unsupervised machine learning to analyze the stories. These techniques allowed us to include community-level data in the patient journey map in a relatively labor-efficient manner. Based on the results of patient community journey mappings in Studies 1 and 2, we demonstrated the following new valuable additions and modifications to traditional journey mapping techniques: (1) the quantification of (patient) experience frequency, (2) the detection of relationships between co-occurring experiences within the journey, and (3) the detection of new design opportunities/directions (potential data types to be provided and collected). These additions and modifications are of value to designers who need to gain a deeper understanding of complex societal transition contexts in a variety of fields such as, but not limited to, healthcare, with a low-cost investment.
We presented our outcomes to possible future stakeholders who were not involved in the development process per se (four specialist doctors, a psychologist, two healthcare policy researchers, an artificial intelligence (AI) researcher at a hospital, and two data scientists at a hospital). Overall, everyone confirmed the novelty and conceptual clarity of the patient community journey mapping. They were positively surprised by the high level of understanding that was developed in a short period of time about the targeted patient group. They appreciated using everyday life experience data (i.e., online patient stories) instead of data from randomized trials or internal logistics at a community level. For them, the fact that the large-scale data were mostly coming from patients’ everyday life (instead of in a hospital) meant that community journey maps provided credible insights for improving the quality of life, value-based health care, and patient-centric care. As one of the specialist doctors said, the data from the community platform established a broader perspective on patient care path experiences that they could better relate to compared with the feedback of a few assertive patients during consultations (traditional patient journey can also be dangerous by having a few assertive opinions from patients). Our new patient community journey map not only helps designers but also other related stakeholders to understand the patients better and generate a credible picture of the patients’ experience in the care path by adding collective user group experience to the traditional patient journey mapping.
Finally, far from arguing for a set of rules to be followed, we merely seek to inspire designers and encourage them to adapt and adjust our approach to their practices and needs as suggested by Daalhuizen et al. (2019). Yet, in this process, we recommend that design researchers closely and continuously collaborate with data scientists, as we have done in the research reported here. Whereas the data scientist can devise and realize the possibilities for machine learning techniques in analyzing community-level data, designers can imagine and explain which data analysis results can provide high-quality information that can inspire the design of new services or systems. For instance, in our collaboration, we discussed the various options of machine learning techniques that could provide meaningful and relevant insights to support the design process for new services that could empower cancer patients. These discussions resulted in innovative and effective decisions on creating this new type of journey map.
The most effective way to make the most out of the collaboration between designers and data scientists is that both parties need to be open to the different ways of working in each other’s discipline. For example, after conducting topic modeling in Study 2, the data scientist did not know how the keywords and topic clusters could be used further. The result of topic modeling (a list of keywords) did not inspire medical doctors to develop new health interventions for the targeted patients. After the designers’ further interpretation of outcomes and placing their interpretations on a journey map, the medical doctors came to agree on the need for developing future health interventions. In the other way around, in Study 1, after topic classification, designers did not know what alternative analysis techniques were available to further develop the journey map. The data scientist suggested to use an analysis model called ARM to look for a correlation between topics. It was thus able to inspire designers to make meaningful changes to the journey map. In both examples, understanding each other’s way of working was crucial. As designers, the biggest challenge in working with data scientists was to persuade the data scientists to that data outcomes require interpretation and creativity before their full potential can be felt by decision makers. This realization implies a data-enabled approach instead of the data-driven approach. It took time before our data scientist understood how designerly activities could be a vital part of the value of data analysis outcomes.
In this collaborative process, we learned that it is necessary to have an appropriate language to communicate what designers and data scientists want from each other. As a team of designers and a data scientist, we propose a change from the traditional way data scientists and designers work together (see Figure 11, left) to a more far-reaching and integrated collaboration (see Figure 11, right). To elaborate on our collaboration between designers and data scientists (Figure 11 right), in the preparation phase, designers can lead discussions with data scientists on the appropriateness of the dataset given their target user population and the potential value of applying either supervised or unsupervised machine learning techniques. From their side, the data scientists can lead discussions on the amount, quality, and data types required for further analysis. The data scientists and designers together prepare ethical approval for using community data and a safe data management plan. In the analysis phase, designers are better suited to handle qualitative data (e.g., labeling datasets for training, checking the quality of analysis outcomes, etc.). In contrast, data scientists will be more qualified to apply the machine learning models during data analysis and choose specific (often more advanced) machine learning models. During this procedure, data scientists and designers iteratively check the results together because the first analysis results often have inaccurate or misleading information. When problems are found in the analysis results, for example, the data scientists may modify data analysis methods, or the designers may seek additional data to support decisions on the dataset. In the creation phase, the designers interpret how the analysis outcome can be applied to a meaningful journey map. At the same time, data scientists can support designers by checking that the designers’ interpretations stay aligned with the outcomes of the data analysis model. One to be noticed is that the designers’ involvement is more extensive than that of data scientists in the preparation and creation phases to interpret the initial given care-path information to construct an initial journey map and interpret the analyzed community data to build a community journey map. In comparison, our entire collaboration process involves the seamless and continuous sharing of knowledge and outcome from and between designers and data scientists.
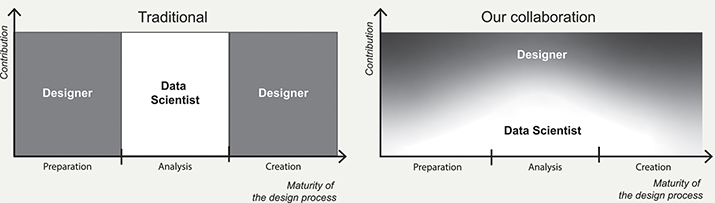
Figure 11. A traditional collaboration process between a data scientist and designers (left) as opposed to the collaboration process in Studies 1 and 2 (right).
By writing this article, we would like to make designers aware of a hybrid design intelligence that enables them to apply the design process on community-level data, often consisting of tens of thousands of data entries. As the design field expands by taking up ever more complex societal challenges, designers need to become more adept in handling larger datasets about the activities of people while still being sensitive to the variegated contexts from which these data arose. The hybrid intelligence we explored in the two case studies lies in the competence of designers to interpret a large user dataset and be creative with advanced data technologies while working with data scientists. In this sense, patient community journey mapping can be regarded as a hybrid design intelligence tool for designers that enables them to include the experiences of very many people in exploring opportunities of developing new health solutions with multi-stakeholders, data scientists, and medical experts.
References
- Agrawal, R., Imieliński, T., & Swami, A. (1993). Mining association rules between sets of items in large databases. In Proceedings of the international conference on management of data (pp. 207-216). ACM. https://doi.org/10.1145/170035.170072
- Andreasen, M. M. (2011). 45 years with design methodology. Journal of Engineering Design, 22(5), 293-332. https://doi.org/10.1080/09544828.2010.538040
- Bate, P., & Robert, G. (2006). Experience-based design: From redesigning the system around the patient to co-designing services with the patient. BMJ Quality & Safety, 15(5), 307-310. http://dx.doi.org/10.1136/qshc.2005.016527
- Ben-Tovim, D. I., Dougherty, M. L., O’Connell, T. J., & McGrath, K. M. (2008). Patient journeys: The process of clinical redesign. Medical Journal of Australia, 188(S6), S14-S17. https://doi.org/10.5694/j.1326-5377.2008.tb01668.x
- Beusterien, K., Tsay, S., Su, Y., Corral, M., Gholizadeh, S., & Wagner, S. (2012). Experience with colorectal cancer: Analysis of patient web forums. Journal of Clinical Oncology, 30(4), 496-496. https://doi.org/10.1200/jco.2012.30.4_suppl.496
- Blei, D. M., Ng, A. Y., & Jordan, M. I. (2003). Latent dirichlet allocation. The Journal of Machine Learning Research, 3, 993-1022. https://dl.acm.org/doi/abs/10.5555/944919.944937
- Blessing, L. T., & Chakrabarti, A. (2009). DRM: A design research methodology. Springer. https://doi.org/10.1007/978-1-84882-587-1_2
- Botto, R., Prencipe, M., Ieraci, V., Vitolo, U., & Torta, R. (2019). Cancer and e-health: Evidences and contributes emerging from a social network page dedicated to onco-hematological diseases. Blood, 134(1), 5853. https://doi.org/10.1182/blood-2019-123009
- Bourgeois, J., & Kleinsmann, M. (2023). AIEDAM thematic collection: A perspective on data-enabled design – design meet data science. AI EDAM, 37, Article e7. https://doi.org/10.1017/S0890060422000221
- Breiman, L. (2001). Random forests. Machine Learning, 45(1), 5-32. https://doi.org/10.1023/A:1010933404324
- Carayon, P., Wooldridge, A., Hoonakker, P., Hundt, A. S., & Kelly, M. M. (2020). SEIPS 3.0: Human-centered design of the patient journey for patient safety. Applied Ergonomics, 84, Article 103033. https://doi.org/10.1016/j.apergo.2019.103033
- Carayon, P., & Wooldridge, A. R. (2020). Improving patient safety in the patient journey: Contributions from human factors engineering. In J. S. Tietjen (Ed.), Women in industrial and systems engineering (pp. 275-299). Springer. https://doi.org/10.1007/978-3-030-11866-2_12
- Chakraborty, S., & Church, E. M. (2021). Patient hospital experience and satisfaction on social media. International Journal of Quality and Service Sciences. 13(3), 417-432. https://doi.org/10.1108/IJQSS-02-2020-0014
- Cooper, R. (2019). Design research – Its 50-year transformation. Design Studies, 65, 6-17. https://doi.org/10.1016/j.destud.2019.10.002
- Cross, N. (1982). Designerly ways of knowing. Design Studies, 3(4), 221-227. https://doi.org/10.1016/0142-694X(82)90040-0
- Cross, N. (2018). Developing design as a discipline. Journal of Engineering Design, 29(12), 691-708. https://doi.org/10.1080/09544828.2018.1537481
- Daalhuizen, J., Timmer, R., Van der Welie, M., & Gardien, P. (2019). An architecture of design doing: A framework for capturing the ever-evolving practice of design to drive organizational learning. International Journal of Design, 13(1), 37-52.
- Dellarocas, C. (2003). The digitization of word of mouth: Promise and challenges of online feedback mechanisms. Management Science, 49(10), 1407-1424. https://doi.org/10.1287/mnsc.49.10.1407.17308
- Dellermann, D., Ebel, P., Söllner, M., & Leimeister, J. M. (2019). Hybrid intelligence. Business & Information Systems Engineering, 61, 637-643. https://doi.org/10.1007/s12599-019-00595-2
- Févotte, C., & Idier, J. (2011). Algorithms for nonnegative matrix factorization with the β-divergence. Neural Computation, 23(9), 2421-2456. https://doi.org/10.1162/NECO_a_00168
- Giaccardi, E., Cila, N., Speed, C., & Caldwell, M. (2016). Thing ethnography: Doing design research with non-humans. In Proceedings of the conference on designing interactive systems (pp.377-387). ACM. https://doi.org/10.1145/2901790.2901905
- Høiseth, M., & Keitsch, M. (2015). Using phenomenological hermeneutics to gain understanding of stakeholders in healthcare contexts. International Journal of Design, 9(3), 33-45.
- Hotho, A., Nürnberger, A., & Paaß, G. (2005). A brief survey of text mining. Journal for Language Technology and Computational Linguistics, 20(1), 19-62. https://doi.org/10.21248/jlcl.20.2005.68
- Huppertz, J. W., & Otto, P. (2018). Predicting HCAHPS scores from hospitals’ social media pages: A sentiment analysis. Health Care Management Review, 43(4), 359-367. https://doi.org/10.1097/HMR.0000000000000154
- Jordan, M. I., & Mitchell, T. M. (2015). Machine learning: Trends, perspectives, and prospects. Science, 349(6245), 255-260. https://doi.org/10.1126/science.aaa8415
- Kamar, E. (2016). Directions in hybrid intelligence: Complementing AI systems with human intelligence. In Proceedings of the international joint conference on artificial intelligence (pp.4070-4073). ACM. https://www.ijcai.org/Proceedings/16/Papers/603.pdf
- Kilaru, A. S., Meisel, Z. F., Paciotti, B., Ha, Y. P., Smith, R. J., Ranard, B. L., & Merchant, R. M. (2016). What do patients say about emergency departments in online reviews? A qualitative study. BMJ Quality & Safety, 25(1), 14-24. http://dx.doi.org/10.1136/bmjqs-2015-004035
- Klein, N., Marinescu, I., Chamberlain, A., & Smart, M. (2018, March). Online reviews are biased. Here’s how to fix them. Harvard Business Review. https://hbr.org/2018/03/online-reviews-are-biased-heres-how-to-fix-them
- Kushniruk, A. W., Borycki, E. M., & Parush, A. (2020). A case study of patient journey mapping to identify gaps in healthcare: Learning from experience with cancer diagnosis and treatment. Knowledge Management & E-Learning, 12(4), 405-418. https://doi.org/10.34105/j.kmel.2020.12.022
- Li, X., & Hitt, L. M. (2008). Self-selection and information role of online product reviews. Information Systems Research, 19(4), 456-474. https://doi.org/10.1287/isre.1070.0154
- Madathil, S. C., Lopes, A. J., & Alfred, M. (2020). Patient journey mapping: A literature review. In Proceedings of the annual conference of Institute of Industrial and Systems Engineers (IISE, pp.937-942). IISE.
- Manchaiah, V. K., Stephens, D., Andersson, G., Rönnberg, J., & Lunner, T. (2013). Use of the ‘patient journey’ model in the internet-based pre-fitting counseling of a person with hearing disability: Study protocol for a randomized controlled trial. BMC Ear, Nose and Throat Disorders, 14(1), 1-8. https://doi.org/10.1186/1745-6215-14-25
- McCarthy, S., O’Raghallaigh, P., Woodworth, S., Lim, Y. L., Kenny, L. C., & Adam, F. (2016). An integrated patient journey mapping tool for embedding quality in healthcare service reform. Journal of Decision Systems, 25(1), 354-368. https://doi.org/10.1080/12460125.2016.1187394
- McRoy, S., Rastegar-Mojarad, M., Wang, Y., Ruddy, K. J., Haddad, T. C., & Liu, H. (2018). Assessing unmet information needs of breast cancer survivors: Exploratory study of online health forums using text classification and retrieval. Journal of Medical Internet Research Cancer, 4(1), Article e10. https://doi.org/10.2196/cancer.9050
- Moreno, M. A., Goniu, N., Moreno, P. S., & Diekema, D. (2013). Ethics of social media research: Common concerns and practical considerations. Cyberpsychology, Behavior and Social Networking, 16(9), 708-713. https://doi.org/10.1089/cyber.2012.0334
- Mullaney, T., Pettersson, H., Nyholm, T., & Stolterman, E. (2012). Thinking beyond the cure: A case for human-centered design in cancer care. International Journal of Design, 6(3), 27-39.
- Murphy, K. P. (2012). Machine learning: A probabilistic perspective. MIT Press.
- National Academies of Sciences, Engineering, and Medicine; Health and Medicine Division; Board on Health Care Services; Board on Global Health; & Committee on Improving the Quality of Health Care Globally. (2018, August 28). Crossing the global quality chasm: Improving health care worldwide. National Academies Press. https://doi.org/10.17226/25152
- Newman, D., Noh, Y., Talley, E., Karimi, S., & Baldwin, T. (2010). Evaluating topic models for digital libraries. In Proceedings of the 10th annual joint conference on digital libraries (pp. 215-224). ACM. https://doi.org/10.1145/1816123.1816156
- Pedregosa, F., Varoquaux, G., Gramfort, A., Michel, V., Thirion, B., Grisel, O., Blondel, M., Prettenhofer, P., Weiss, R., & Dubourg, V. (2011). Scikit-learn: Machine learning in Python. Journal of Machine Learning Research, 12(85), 2825-2830.
- Pramanik, M. I., Lau, R. Y., Azad, M. A. K., Hossain, M. S., Chowdhury, M. K. H., & Karmaker, B. (2020). Healthcare informatics and analytics in big data. Expert Systems with Applications, 152(15), Article 113388. https://doi.org/10.1016/j.eswa.2020.113388
- Preece, J., & Maloney-Krichmar, D. (2003). Online communities: Focusing on sociability and usability. In J. Jacko & A. Sears (Eds.), Handbook of human-computer interaction (pp. 596-620). Erlbaum Associates.
- Richardson, A. (2010, November). Using customer journey maps to improve customer experience. Harvard Business Review. https://hbr.org/2010/11/using-customer-journey-maps-to
- Rodrigues, V., Blomkvist, J., & Holmlid, S. (2021). A designerly approach to exploring disruptions in service: Insights from employing a systems perspective. International Journal of Design, 15(3), 61-72.
- Salton, G., & Buckley, C. (1988). Term-weighting approaches in automatic text retrieval. Information Processing & Management, 24(5), 513-523. https://doi.org/10.1016/0306-4573(88)90021-0
- Samek, W., Montavon, G., Vedaldi, A., Hansen, L. K., & Müller, K.-R. (2019). Explainable AI: Interpreting, explaining and visualizing deep learning. Springer Nature. https://doi.org/10.1007/978-3-030-28954-6
- Scott, W. R. (1995). Institutions and organizations: Ideas, interests, and identities. Sage publications.
- Speed, C., & Oberlander, J. (2016). Designing from, with and by data: Introducing the ablative framework. In Proceedings of the conference of design research society (pp.2991-3003). DRS. https://doi.org/10.21606/drs.2016.433
- Stoimenova, N., & Kleinsmann, M. (2020). Identifying and addressing unintended values when designing (with) artificial intelligence. In Proceedings of the conference of design research society (pp.654-666). DRS. https://doi.org/10.21606/drs.2020.222
- Stoimenova, N., & Price, R. (2020). Exploring the nuances of designing (with/for) artificial intelligence. Design Issues, 36(4), 45-55. https://doi.org/10.1162/desi_a_00613
- Stolterman, E. (2021). The challenge of improving designing. International Journal of Design, 15(1), 65-74.
- Tran, N. N., & Lee, J. (2017). Online reviews as health data: Examining the association between availability of health care services and patient star ratings exemplified by the Yelp academic dataset. JMIR Public Health and Surveillance, 3(3), Article e7001. https://doi.org/10.2196/publichealth.7001
- Trebble, T. M., Hansi, N., Hydes, T., Smith, M. A., & Baker, M. (2010). Process mapping the patient journey: An introduction. BMJ, 341(1), 394-397. https://doi.org/10.1136/bmj.c4078
- Tsekleves, E., & Cooper, R. (2017). Emerging trends and the way forward in design in healthcare: An expert’s perspective. The Design Journal, 20(1), S2258-S2272. https://doi.org/10.1080/14606925.2017.1352742
- Verganti, R., Vendraminelli, L., & Iansiti, M. (2020). Innovation and design in the age of artificial intelligence. Journal of Product Innovation Management, 37(3), 212-227. https://doi.org/10.1111/jpim.12523
- Verhoef, L. M., Van de Belt, T. H., Engelen, L. J., Schoonhoven, L., & Kool, R. B. (2014). Social media and rating sites as tools to understanding quality of care: A scoping review. Journal of Medical Internet Research, 16(2), Article e3024. https://doi.org/10.2196/jmir.3024
- Wheelock, A., Miraldo, M., Parand, A., Vincent, C., & Sevdalis, N. (2014). Journey to vaccination: A protocol for a multinational qualitative study. BMJ Open, 4(1), Article e004279. http://dx.doi.org/10.1136/bmjopen-2013-004279
- Zomerdijk, L. G., & Voss, C. A. (2010). Service design for experience-centric services. Journal of Service Research, 13(1), 67-82. http://doi.org/10.1177/1094670509351960
Appendix
Appendix 1
List of sub-sections in ‘Forums’ (captured from https://cancerconnection.ca/).
Appendix 2
Example of online patient stories (thread with one first post and two replies).
Appendix 3
Extended version of Table 5. Some results of association rule mining.
| Rule | Antecedents | Consequents | Confidence |
| 0 | Being/ attempting to be positive in the cancer journey |
Experiencing physical side effects from treatment and finding ways to counter-act these |
0.79 |
| 1 | Experiencing physical side effects from treatment and finding ways to counteract these | Being/ attempting to be positive in the cancer journey | 0.26 |
| 2 | Undergoing treatment procedures | Being/ attempting to be positive in the cancer journey | 0.26 |
| 3 | Being/ attempting to be positive in the cancer journey | Undergoing treatment procedures | 0.72 |
| 4 | Experiencing eating/drinking issues and finding (diet-related) solutions | Dealing with overwhelming fatigue in daily life | 0.44 |
| … | … | … | … |
| 21 | Getting support from family, friends and peers but also dealing with misunderstanding and estrangement | Experiencing eating/drinking issues and finding (diet-related) solutionsey | 0.50 |
| 22 | Experiencing eating/drinking issues and finding (diet-related) solutions | Making a conscious decision for personal care/health by comparing quality and quantity of life | 0.41 |
| 23 | Making a conscious decision for personal care/health by comparing quality and quantity of life | Experiencing eating/drinking issues and finding (diet-related) solutions | 0.53 |
| … | … | … | … |
| 43 | Experiencing physical side effects from treatment and finding ways to counter-act these | Undergoing treatment procedures | 0.69 |
| 44 | Experiencing physical side effects from treatment and finding ways to counter-act these | Wanting to have an understanding relationship with the medical team (effective communication, information and respect) |
0.36 |
| 45 | Wanting to have an understanding relationship with the medical team (effective communication, information and respect) | Experiencing physical side effects from treatment and finding ways to counter-act these | 0.78 |
| … | … | … | … |
| 55 | Making a conscious decision for personal care/health by comparing the quality and quantity of life | Undergoing treatment procedures | 0.74 |
| 56 | Sharing cancer news with others using a medium that suits the patient | Undergoing treatment procedures | 0.70 |
| 57 | Undergoing treatment procedures | Sharing cancer news with others using a medium that suits the patient | 0.40 |
| 58 | Undergoing treatment procedures | Wanting to have an understanding relationship with the medical team (effective communication, information, and respect) | 0.37 |
| 59 | Wanting to have an understanding relationship with the medical team (effective communication, information, and respect) | Undergoing treatment procedures | 0.74 |
Appendix 4
Example of the first post and a reply for study 2.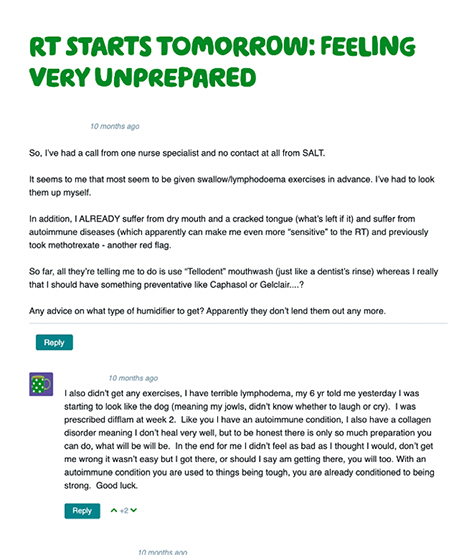
Appendix 5
Coherence score for each number of topics ranging from 2-49.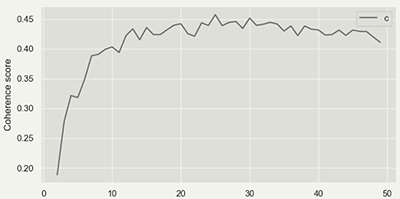
Appendix 6
Full version of Table 7. Designer’s interpretation of the topic for each cluster.
| Topic group |
Ten representative keywords | Topic label (Patients discuss and share their experience about ...) | Interpretation (Patients need for ... / Phase of care path it belongs to) |
| 0 | regard, suggest, kind, story, carcinoma, book, dissection_reconstruction, flap_postoperative, holiday, comment | Having holidays, and how to arrange them with travel insurance. | Tips for a special event / follow-up |
| 1 | soup, soft, calorie, dietician, meal, ensure, add, diet, milk, cream | What they can eat/drink and recipes to make it edible during their recovery phase. | Tips on food and drink ingredients and cooking recipes / treatment & follow-up |
| 2 | information, forum, party, join, link, line, number, member, thread, medical | What each treatment does and what the side/late effects are. | Sufficient information about treatment and side effects / treatment decision conversation & consult |
| 3 | symptom, specialist, nose, test, worried, refer, ent, blood, voice, concern | Their worries related to potential cancer symptoms and need for guidance on these uncertainties | Support to alleviate the worry about uncertain symptoms of having cancer / intake |
| 4 | stuff, slowly, tip, stick, lack, improvement, appetite, eating, hot, slow | Eating and appetite issues | Tips for increasing appetite / treatment & follow-up |
| 5 | pay, job, local, health, lucky, nhs, form, medical, system, benefit | Career and financial issues | Tips for a career during a cancer journey/ follow-up |
| 6 | spread, lymph_node, primary, mri, left, sign, large, cell, gland, lung | Cancer status and treatment process can be very different for each individual | Personalised information / throughout all phases |
| 7 | wife, man, fight, daughter, son, child, strength, age, heart, young | Experience related to supportive family | Family support / throughout all phases |
| 8 | bed, eye, minute, sit, spend, watch, close, drive, listen, move | Identifying how to prepare for treatment and spend time in the hospital between treatments | Tips for preparing for treatments and the waiting time / treatment decision conversation |
| 9 | rest, half, tired, walk, step, fatigue, road, ready, plenty, sense | How to deal with fatigue | Tips for dealing with fatigue / follow-up |
| 10 | type, option, decide, explain, outcome, decision, cure, chance, info, discuss | Having the essential knowledge about the potential consequences and side effects of treatment procedures | Having enough information about treatment outcomes and side effects/ treatment decision conversation, treatment consult |
| 11 | word, metastatic_scc, run, fact, learn, load, pass, describe, wake, bother | Knowing the importance of peer support when dealing with physical and psychological side effects | Peer support / throughout all phases |
| 12 | relief, morphine, drug, painkiller, painful, hurt, prescribe, tablet, dose, liquid | How to relieve pain | Tips for relieving pain / follow-up, treatment |
| 13 | skin, exercise, heal, scar, speech, flap, arm, muscle, shoulder, swell | How to recover from treatment and surgery sequelae and side effects | Tips for dealing with side effects from the treatment/ follow-up |
| 14 | return, dani_squamous, continue, update, progress, hpv, fingers_crosse, pleased, quick, therapy | Concerns related to HPV (virus that can infect and cause mouth and throat cancers) | Support information for uncertain worry about cancer-related cause / intake, throughout all phases |
| 15 | advise, chemotherapy, cisplatin, loss, complete, difference, ear, due, hair, short | How to deal with hearing and hair loss from the treatment | The support for the losses from the treatment / follow-up |
| 16 | write, message, phone, chat, forget, contact, add, profile, ring, detail | How to update platform peers about the user’s cancer journey | Peer support possibilities/ throughout all phases |
| 17 | saliva, mucus, ulcer, buy, burn, cough, mouthwash, rinse, spray, product | How to deal with dry/sensitive mouth and mucus problem | Tips for the mouth and mucus care / follow-up |
| 18 | affect, afraid, floor, concern, extremely, main, person, procedure, reaction, depending | How reaction during the treatment procedure can be very different for individuals | The personalised information / throughout all phases |
| 19 | realize, nice, amazing, light, wonderful, lovely, cold, share, lucky, wear | How to wear adequate clothing against the cold and radiation burn from the treatment | Tips for adequate clothing for treatment/ treatment |
| 20 | sick, rig, stomach, med, nausea, admit, ensure, awful, nutrition, fluid | How to deal with the awful feeling of sickness caused by the feeding tube and pipe | Tips for using feeding tube / follow-up |
| 21 | yesterday, meet, touch, honest, date, guy, lol, bring, totally, lovely | The positive feeling about meeting, sharing stories, and helping between platform peers | Peer support possibilities/ throughout all phases |
| 22 | dentist, low, top, jaw, dental, bone, mine, oral, leg, bite | How to deal with mouth-related issues (reconstruction and appearance) after jaw surgery | Support for appearance change after the surgery / follow-up |
| 23 | partner, infection, feeling, turn, fear, scary, situation, scare, stress, horrible | Negative feelings that their partners are also often worried | Support for dealing with negative feelings / throughout all phases |
| 24 | quickly, guess, move, imagine, ahead, grateful, process, prepare, begin, shock | Being shocked after being diagnosed with cancer | Support for the first encounter with cancer/ intake & diagnostic |
