The Influence of Context on Product Judgement – Presenting Assistive Products as Consumer Goods
Ana Correia de Barros 1,*, Carlos Duarte 2, and José Bulas Cruz 3
1 UTAD – UNIDCOM/IADE, Lisbon, Portugal
2 UNIDCOM/IADE, Lisbon, Portugal
3 UTAD, Vila Real, Portugal
It is said that the reluctance of people to use assistive products can be attributed to two factors: the first is a concern about aesthetics, and the second is the stigma associated with their use. This paper reports the results of an experiment to test whether people’s responses to assistive products are affected by alterations in the way in which assistive products are portrayed. Two different catalogues depicting the same assistive products were presented to two different groups of respondents. One of the catalogues simulated an ordinary kitchen catalogue and the other simulated a common assistive products catalogue. Although the main attribute mentioned for preferring one object over another was common to both groups, motivations behind its use differed between groups, and the context of presentation influenced the groups’ opinions about the objects which were presented. The experiment suggests that by designing and presenting assistive products as general consumer goods it may be possible to reduce stigmatic elements from being associated with them.
Keywords – Communication, Inclusive Design, Presentation Format, Product Design, Questionnaire.
Relevance to Design Practice – Understanding the general preferences of consumers regarding home ware could help designers to create more appealing assistive products for people with and without disabilities, thereby increasing product sales and decreasing stigma at the same time. Findings on forms of presentation could also be of use for marketing and advertising.
Citation: Correia de Barros, A., Duarte, C., Cruz, J. B. (2011). The influence of context on product judgement – Presenting assistive products as consumer goods. International Journal of Design, 5(3), 99-112.
Received March 26, 2010; Accepted September 20, 2011; Published December 30, 2011.
Copyright: © 2012 Correia de Barros, Duarte and Cruz. Copyright for this article is retained by the authors, with first publication rights granted to the International Journal of Design. All journal content, except where otherwise noted, is licensed under a Creative Commons Attribution-NonCommercial-NoDerivs 2.5 License. By virtue of their appearance in this open-access journal, articles are free to use, with proper attribution, in educational and other non-commercial settings.
*Corresponding Author: anacorreiadebarros@gmail.com
Ana Correia de Barros is an industrial designer and PhD student since 2007. She has been mostly interested in how to plan lines of action to boost the acceptance and use of assistive products. She has been working closely with stroke victims, looking for ways to improve their independence and quality of life.
Carlos Duarte is an industrial designer and holds a PhD in production engineering. He is the president of the Design School at IADE Creative University, Lisbon. He is also both an executive director and a researcher at IADE Creative University’s research unit UNIDCOM.
José Bulas Cruz holds a PhD in digital image processing and is a full professor at UTAD, Vila Real. He is the coordinator of the engineering department and of the PhD program on informatics. As a researcher at CITAB-UTAD, he is the responsible for the research group focused on functional analysis of animal models using computer vision.
Introduction
According to the ISO definition, any product can be assistive, though usually products that are considered to be assistive are those which are specially designed to improve the functionality of a person with disabilities (World Health Organization, 2001). The problems with these specifically designed devices are the commonly mentioned discontinuance in use and abandonment. Lack of information on the correct use of assistive products (AP), changes in users’ preferences, shame, and inadequacy of APs in the home environment were identified by Gitlin and Schemm (1996) as reasons for the abandonment of APs by elderly people. In their literature review on meanings attributed by people to APs and the ways in which these influence APs’ adoption, Pape, Kim and Weiner (2002) concluded that, at times, social concerns (e.g. stigma) have a greater weight on the decision to use APs than the improvement of functionality they foster. According to Goffman (1986), APs are often associated with some depreciative characteristics, causing AP users to feel stigmatized by society.
Within the broad range of APs are the specific devices designed for very specific impairments, but there are also “daily living aids” which are those products that help people to accomplish everyday tasks such as opening a jar, peeling vegetables or combing hair. Everyday tasks are referred to as Activities of Daily Living (ADL), while the most basic – e.g. eating, dressing or bathing – are called Basic Activities of Daily Living (BADL). The performance on these BADL is used in healthcare to measure one’s degree of dependence (Katz, Down, Cash, & Grotz, 1970; Mahoney & Barthel, 1965), i.e. the degree of one’s capacity for self-care (Holbrook & Skilbeck, 1983). Here, then, lies the great importance of fighting the abandonment of APs that assist the performance of BADL, for they are crucial to the improvement of individual independence.
Beyond their importance in boosting independence, daily living aids are also considered to be the type of APs with the greatest chance of entering the mainstream market (Coleman, 2006). The reason for this is that these products are the most useful to most people (either with or without disabilities) and are the most likely to be used by them. The design of these products is also likely to involve an inclusive approach which is not possible with APs designed for more specific disabilities, or APs which are custom-made to meet very specific needs.
Næss and Øritsland (2005) argue for an inclusive design approach to product development, bearing in mind product semiotics and affordances, noting that “by definition, mainstream products cannot be stigmatizing” (p. 1). In order to reduce the stigma associated with AP’s, designers need guidelines to show them what kind of mainstream properties should be included in their designs to make them more inclusive.
By adopting an inclusive design approach in their development, some daily living aids have made their way into the general consumer market without being labelled as APs (Pullin, 2009). Inclusive design, then, would allow the entrance of many APs into the general consumer market (Coleman, 2006), thus increasing access to, and information about APs, while decreasing prices. This in turn would increase the acquisition and use of APs. The final goal of this process would be to promote greater independence amongst people with disabilities and impairments.
Other approaches to reduce the stigma associated with the use of APs can be taken. One is to hide them, through miniaturization or disguise, as is the case in the current trend in hearing aid design. Another is not to hide them, but to turn them into personal statements, as the famous model, actress and athlete Aimee Mulins has done in the way she makes use of her great collection of different prostheses. It is even possible to convert APs into fashionable items – as is the case with spectacles, which have achieved the role of “eyewear” in fashion (Pullin, 2009). Pullin provides an overview of these approaches along with successful examples. Nevertheless, to our knowledge, there is little research on how these positive associations come to be ascribed to APs, i.e. what process is underlying this possibility.
In order to understand this phenomenon of ascribing meaning, and before we go any further into explaining our experiment and methodology, we will give a brief account of stigma and of the contexts in which meanings associated with AP’s emerge.
Stigma
From its initial Greek meaning of a body sign “designed to expose something unusual and bad about the moral status of the signifier” (Goffman, 1986, p. 1) to its present meaning, the word “stigma” has come a long way. Literature provides a wide range of definitions, mainly coming from the fields of social psychology. In this paper we will follow the view on stigma given by Link and Phelan (2001), because it provides an account of how the phenomenon of stigma comes about, making use of six major elements “...of labelling, stereotyping, separation, status loss, and discrimination [which] co-occur in a power situation that allows the components of stigma to unfold” (p. 367).
First of all there is labelling. Labelling involves a process of oversimplification in order to create groups, i.e. to place people into categories for easier judgment. The process of oversimplification continues from labelling to stereotyping: people create stereotypes – each one with its own set of particular meanings – in which they are able to place others who they have labelled, in order, again, to allow faster judgements. These processes are not necessarily negative, in that human beings need to make use of several strategies to improve the efficiency (best results with a minimum expense of time and effort) of their judgements.
In the process of stigma emergence, after labelling and placing the other into a stereotype, separation comes about. This separation refers to “us” as opposed to “them”. Negative stereotyping leads to a status loss if the person being labelled is placed into a stereotype that has negative meaningful connotations for those placing the label in the first place. Placement into one of these negative stereotypes leads to discrimination. There is a hierarchy to status, which is used by humans in different situations to allow them to live in society. As noted by Link and Phelan (2001), this is the process by which humans know, with a minimum amount of time and effort, how to act in social interactions (e.g., talking to the boss). Finally, the authors say that stigma only produces its negative effects if the one who is doing the stigmatizing is in a power situation, i.e. if both the one stigmatizing and the stigmatized find the former higher up the hierarchy. This view of stigma and its elements is of particular importance to this paper in order to understand how this labelling, categorizing and stereotyping takes place.
Ripat and Woodgate (2010) have pointed out that this process might not be straightforward, because it depends on context. In their view, identity, culture and technology are necessarily intertwined. Identity, culture and technology are, in fact, the main factors addressed within most disability & rehabilitation research frameworks which seek to examine improvements in the acceptability and use of APs (Hocking, 1999, 2008; Scherer, 2010). Ripat and Woodgate focus on the effect which different cultures have on the meanings ascribed to APs. According to the authors, culture may in fact be the most dominant factor in determining whether or not one agrees to use an AP.
Disabilities tend to be associated with depreciative meanings, such as frailty, vulnerability or a lack of ability to take care of oneself (Goffman, 1986). Using an AP may give visibility to the disability and, in consequence, may carry and advertise whatever depreciative meanings are ascribed to the disability. There are several examples of this in the literature, such as people using towel racks as a replacement for grab bars in the bathroom because, even though they do not function properly, they “look better” and are considered to fit “normalcy” (Hirsch et al., 2000); or even the case of people saying they do not wish to go into AP stores because “they are always aimed at (the) disabled” (Seale, McCreadie, Turner-Smith, & Tinker, 2002, p. 26).
Consumer Judgment
Consumer judgment has been said to be influenced by factors deriving from Maslow’s (1954) hierarchy of needs, which was adopted in design research by several authors – one of those being Jordan. The latter applied the hierarchy idea to user requirements, reframing it into three levels of consumer need: functionality, usability and pleasure (Jordan, 2000). Following the thread of emotional response types to products, Schifferstein and Zwartkruis-Pelgrim (2008) have noted that Jordan’s “pleasure need”, within a “four pleasures” framework (physio, psycho, socio, and ideo), has affinities with Norman’s (2004) three levels of processing – visceral, behavioural and reflexive – and to Greenwald’s (1988, cited in Schifferstein & Zwartkruis-Pelgrim, 2008) four facets of a person’s self schema. So, in theory, what Jordan claims is that the evaluation of a given product implies a step-by-step process which starts at functionality and ends at pleasure, while Norman states that the first input one has on coming across a given product is its perceived sensorial attributes. Consumer judgement might also be regarded through the lenses of “product experience”, which has been described as involving three types of experience: aesthetic experience, emotional experience and experience of meaning (Desmet & Hekkert, 2007). Again, the latter view is related to Norman’s (2004) three levels of processing.
For a product to enter the consumer market, consumers must be willing to accept it. Beyond a product’s characteristics, contextual shifts are reported to influence hedonic judgment (Schifferstein, 1995), while perceived meaning is said to depend on the context in which things are shown (Feijs & Overbeek, 2003). Hence, the main questions addressed in this experiment, which now seem reasonable to ask, are: “Do people react differently to APs according to different contexts of product presentation?” and “Can we design specific types of presentation to allow for specific meaningful associations to emerge?”
In theory, and in accordance with what we have mentioned before, beyond working on product properties to elicit positive meanings, one could also work on the context in which products are to be presented to consumers, in order to elicit specific meaningful associations.
In consumer behaviour, marketing and psychology research, this approach has been used through what have been described as the priming effect and the anchoring effect. When evaluating a product, the consumer will conduct an evaluation based on the available information (Adaval & Monroe, 2002). Also in this context, the underlying principle of simplification may be found – consumers will adopt strategies to make the best decision at the minimum expense of time and effort (Bettman, Luce, & Payne, 1998).
Priming consists in placing people within a mindset, providing them with clues to elicit specific meanings (i.e., providing an initial stimulus) and, consequently, to make judgements (that will be influenced by the exposure to the initial stimulus). Other examples of priming strategies in marketing may be found. Consumers may be primed through semantics, like belongingness to a nationality or to a social group (White & Dahl, 2006), or by a sense of group belongingness attributed not to the person but to the product itself (Moreau, Markman, & Lehmann, 2001). For what the latter authors call “really new products”, sometimes consumers have difficulties in evaluating them exactly because they are not able to fit these new products into an existing category. Moreau et al. have shown that priming consumers with clues about possible product categories to which these new products could belong will influence the way in which consumers evaluate a new product.
When lacking information to evaluate a given product, consumers will make their evaluation according to whatever references they are provided . The underlying principle to this – the anchoring effect (Strack & Mussweiler, 1997) – has been used in marketing quite successfully: a consumer comes across a pair of trousers that is for sale at $1000 (anchor value). He may find it too expensive. Then the shop assistant says these trousers are for sale at 50% and that they now only cost $500. Compared to the initial given value, the consumer may now find this a great deal and chances are he will make the purchase, whereas if the consumer had been given the initial value of $500 instead of $1000, he might have found it too expensive (McRaney, 2010).
There are reports of some different judgments on product preference depending on whether product presentation was conducted through visual representation or in the presence of the actual product (Rouvray, Bassereu, Duchamp, Schneider, & Charbonneau, 2008). On the other hand, visual information has also been said to be dominant in product preference (Boradkar, 2004; Crilly, Moultrie, & Clarkson, 2004). To carry out our experiment, we opted for the use of visual stimuli alone.
Methods
In order to assess people’s response to the same products in different contexts of presentation, two different catalogues were simulated – a kitchen catalogue (KC) (Figure 1) and an assistive products catalogue (APC) (Figure 2). From a total of six presented products in the catalogues, five represented the same daily living aids and the sixth differed according to the catalogue: the KC depicted a table grill, while the APC showed a wrist support. The purpose of placing these two different objects was two-fold: to provide respondents with clues to the type of catalogue and to elicit judgments on objects representing contrasting market segments.
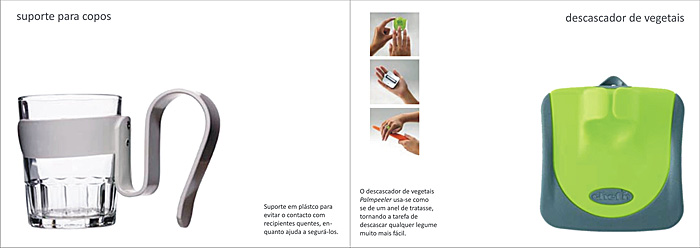
Figure 1. Detail of kitchen catalogue.
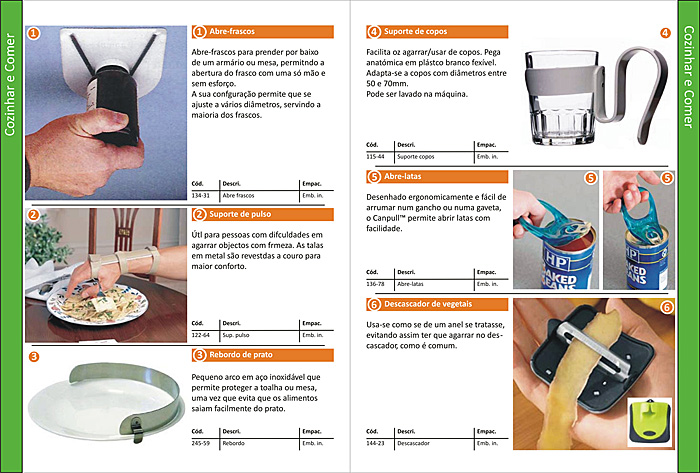
Figure 2. Detail of assistive products catalogue.
While the main goal was to determine respondents’ reactions to the same products in different contexts, the experiment also aimed at knowing if respondents were familiar with the products and if there was any correlation between reasons for preference and expected target audience.
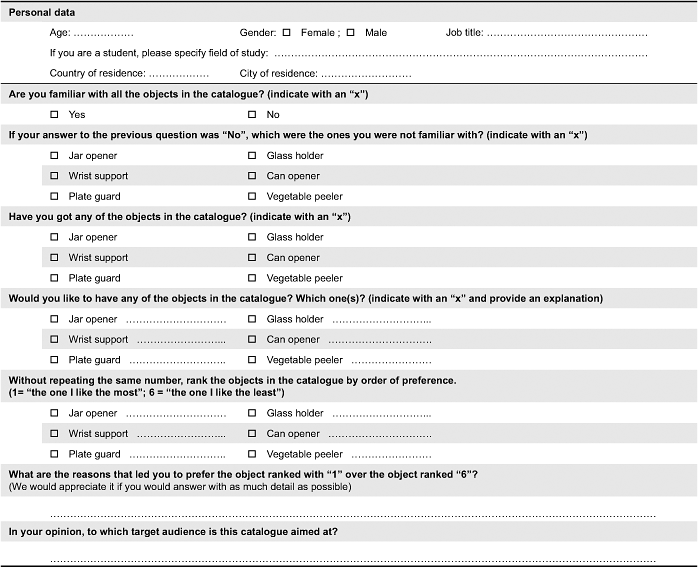
Catalogues were distributed through e-mail to the contact lists of two Portuguese universities in order to provide the experiment with respondents from a broad range of ages and professional backgrounds. Each respondent only had access to one of the two catalogues, which was accompanied by a questionnaire composed of questions regarding the received catalogue. The questionnaire was the same for both catalogues, and it was divided into two groups: data on respondents (age, gender, job title, city and country of residence) and questions on the presented objects (awareness of the objects’ existence, ownership of depicted objects, willingness to possess depicted objects, object preference ranking, reasons for preference and expected target audience) (See Appendix A for the questionnaire translated into English).
Analysis of the results was conducted through a mixture of statistical, quantitative treatment of the data, and qualitative analysis of responses, using the techniques of open coding (breaking down, examining, comparing, conceptualizing and categorizing) under the principles of constant comparison and the search for links in order to form a theory (Strauss & Corbin, 1990).
Assistive Products’ Selection
The experiment intended to depict a wide variety of object types, while at the same time reducing the number of objects to a minimum, so that respondents were not encouraged to abandon the experiment and could deeply focus on the depicted objects. A common subject of “eating and cooking” was defined and several APs were then sought for to include in the experiment.
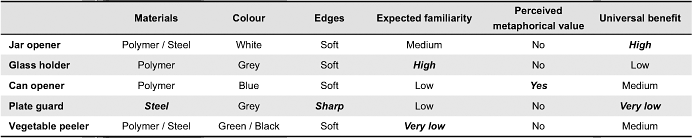
The glass holder, by Swereco (Figure 3(a)) was chosen predicting its familiarity to Portuguese natives, since similar designs are commonly found in Portuguese coffee bars. In contrast, the vegetable peeler PalmPeeler™, by Chef’n (Figure 3(b)), was chosen because of its unfamiliarity. In comparison to the common vegetable peelers in the market, this peeler has a form and method of use which are out of the ordinary. Object colour was also accounted for, resulting in the inclusion of the blue can opener CanPull, by Boa Housewares and designed by Priestmangoode (Figure 3(c)). In addition, in contrast to the other chosen objects, this can opener conveys a symbolic meaning through the adoption and scaling of the key ring morphology in tin cans. The jar opener (Figure 3(d)) was included as an example of an AP designed to help in accomplishing a task which is frequently mentioned as one of the most difficult to perform (Tuominen et al., 2010), whether executed by people with severe impairments (Lorentzon, Bolmsjö, Doyle, & Carus, 2007), the elderly, or by the general population (Voorbij & Steenbekkers, 2002). Finally, the plate guard, by Kinsman Enterprises (Figure 3(e)) was included as an example of an object which may be considered as being on the borderline between a general consumer good and a specific AP. In contrast to the other polymeric depicted objects, this one is made entirely out of steel and presents sharp edges. The inclusion of this object would hopefully push the respondents’ challenge to the limit in the KC, almost like an “out of context” item. Characteristics of chosen APs are shown in Table 1.
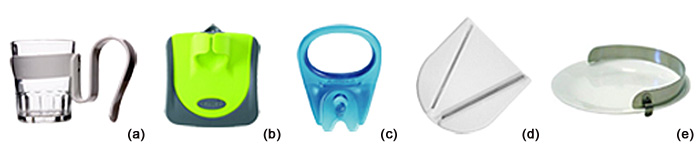
Figure 3. Images of assistive devices used: (a) Glass holder, by Swereco; (b) PalmPeeler™, by Chef’n; (c) CanPull, by Boa Housewares (design by Priestmangoode); (d) Jar opener, unknown producer; (e) Plate guard, by Kinsman Enterprises.
Table 1. Comparison of chosen assistive products’ characteristics. Characteristics which were expected to be accounted for by the participants are highlighted in bold italics.
In the APC, the anomalous product was the economy wrist support, by Sammons Preston (Figure 4). Similarly, the KC portrayed a different object: a table grill by Eva Solo (Figure 5). A project researching design critiques suggested that Eva Solo’s products, beyond being award winning, are aesthetically appealing and capable of triggering positive emotions, thus justifying the inclusion of the table grill in the KC (Ashley, 2010; Ricci, 2011). The aesthetic appeal of this object was considered to be an important factor for counteracting the general opinion regarding APs. The table grill was intentionally placed first in the catalogue due to the hypothesis that respondents would be influenced by this product’s values and would subsequently convey them to the evaluation of the following [assistive] products. While every object was provided with a caption about its use, nowhere in both catalogues was it said that the majority of the depicted objects were APs.
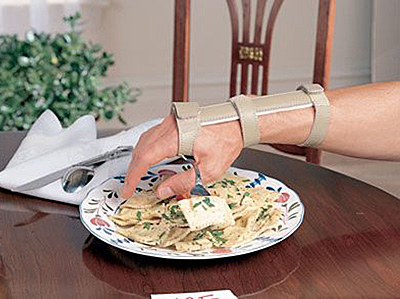
Figure 4. Economy wrist support, by Sammons Preston.
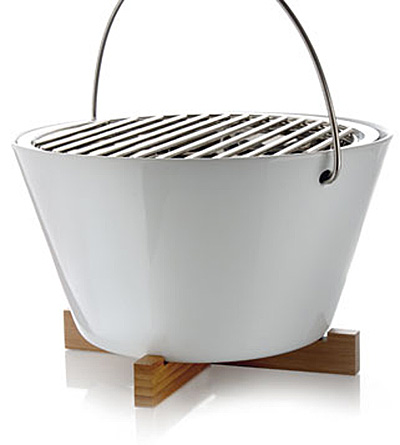
Figure 5. Table grill, by Eva Solo.
Results
A total of 277 questionnaires were retrieved. Thirty-one questionnaires were set aside from analysis due to unanswered questions or because they were filled out incorrectly. Thus, a total of 246 were accepted for analysis: 117 for the KC and 129 for the APC.
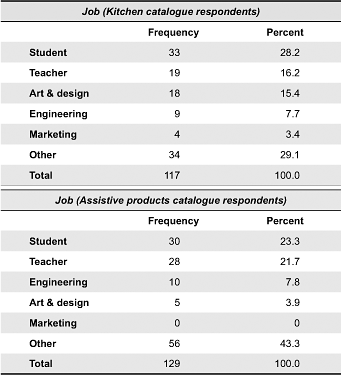
The mean age for respondents in both catalogues was around 35 and ranged from 17 to 81 (SD=13.5 for KC respondents and SD=11.2 for APC respondents). The majority of the respondents were male for the KC (51.3%, n=60) and female for the APC (62.0%, n=80). Having noticed a great variety of jobs titles, these were divided into six groups: art & design related, student, marketing related, teacher, engineering and other. The percentage of students in both groups is high and the percentage of art & design related is high for respondents to the KC but not for respondents to the other catalogue (Table 2). This sorting of professional backgrounds would be important in future analysis of the results to assess whether or not designers participating in the experiment were familiar with the issues of inclusive design and also to compare their answers to the ones provided by other respondents. Except for 1.7% for the KC and 3.1% in the APC, all respondents lived in Portugal.
Table 2. Professions of respondents in both groups.
Acquaintance and Willingness for Possession
Only 2 KC respondents and 3 APC respondents reported being acquainted with all depicted objects. The average of already known objects in the first case was of 3.4 objects per person and 4.1 objects per person for the second group. Regarding the willingness to possess the depicted objects, KC respondents presented an average willingness of 1.8 objects per person, while respondents on the other group presented a slightly smaller number: 1.6 objects per person. However, when considering only the same objects, i.e. not accounting for the table grill and the wrist support, the average of wanted objects per person is identical in both groups: 1.5. This decrease is greater for the KC group due to the weight of the table grill, which accounted for 18% of object willingness. Differences in object willingness for both groups considering total and same objects are represented in Figures 6 to 9.
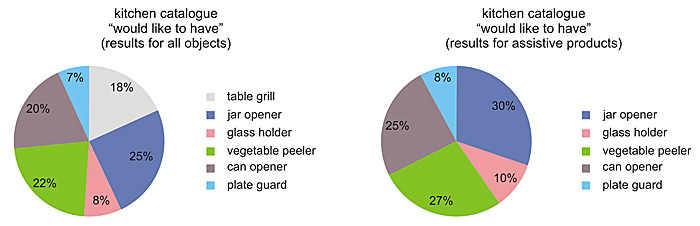
Figure 6 (to the left) and Figure 7 (to the right): Comparison between willingness of object possession considering all objects (Figure 6) and assistive products (Figure 7) for kitchen catalogue respondents.
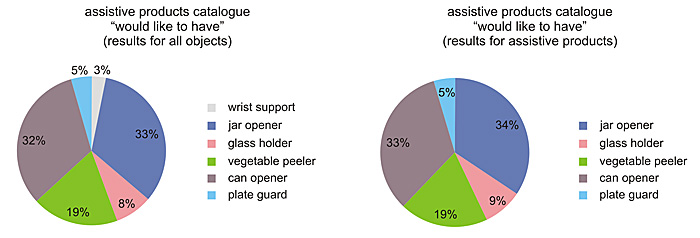
Figure 8 (to the left) and Figure 9 (to the right): Comparison between willingness of object possession considering all objects (Figure 8) and assistive products (Figure 9) for assistive products catalogue respondents.
Further analysis (this time accounting for all the depicted objects, including the table grill and the wrist support) showed that 9.4% of KC respondents reported not wanting any of the depicted objects while 2.6%, in contrast, reported wanting all of them. In the APC group, 21.7% of all respondents reported not wanting any of the objects, while only 1.7% said they would like to have them all.
Already Possessed Objects and Object Ranking
Regarding already possessed objects, the values of object per person for KC respondents, and the values for the APC respondents, were 0.9 and 0.5, respectively. Respondents were asked to rate the depicted objects with numbers from 1 to 6, where 1 stood for least preferred and 6 stood for most preferred, in which the same number was not to be repeated. The scores for each object were added for both groups of respondents and Figure 10 shows the average score for each of the depicted APs in both catalogues. The mode values (i.e., most often attributed scores to each object) were also calculated. These values, depicted in Table 3, together with the values presented in Figure 10 show that the order of preference for each object is almost identical in both groups of respondents. Scores are higher for every AP in the APC group except for the vegetable peeler due to the influence of the table grill and wrist support in the catalogues. Because the table grill was ranked “6” by the majority of respondents, all APs in the KC group were given smaller numbers in the ranking, since numbers could not be repeated. The inverse happened within the APC group, where the majority attributed a “1” to the wrist support”, thus increasing the value of the scores given to APs.
Table 3. Comparison between groups of respondents of mode values used to rank each object.
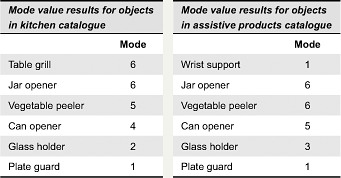
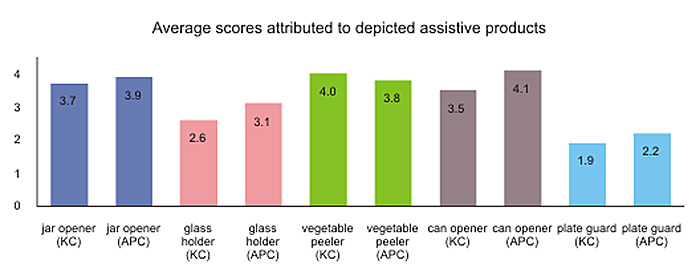
Figure 10. Comparison of average scores of preference attributed to depicted assistive products in both catalogues
(KC – Kitchen catalogue; APC – Assistive products catalogue).
Preference
The two last items in the questionnaire were open-ended questions. The first of these asked respondents to explain why they preferred the object numbered 6 over the object numbered 1. A qualitative analysis of the responses was conducted, as well as a word count of object attributes mentioned in the responses, whether they were used to describe attributes which were perceived as being advantageous or disadvantageous. These words were then semantically coded, which resulted in words like “useful” and “utility” being grouped under a common denominator of “utility” (code). In other cases the coding was done not through one word alone, but through mentioned ideas; thus leading to sentences like “[KC1:]...people often have trouble opening jars, especially older people...”1 or “[KC63:]...carefully thought for people with some physical limitations...” having been coded under “concern about people with disabilities / elderly”. The same sentence, though, could allow more than one code. For instance, the sentence “[KC84:]...for individuals with physical limitations, to whom the plate guard would mean a significant quality of life increase...” would be coded under “concern about people with disabilities / elderly” but also under “quality of life enhancement”. The latter concept is not present in Table 4, because only concepts which were mentioned in more than 10% of the responses were included in this table. As a result of this limitation the code lists for the KC responses in Table 4 were reduced from 62 to 8 items and the APC responses from 44 items to 6 items (full concept lists are available through the authors on request).
Table 4. Comparison of codes for most mentioned concepts for object attributes as justification for preference of one object over another in both respondents’ groups.
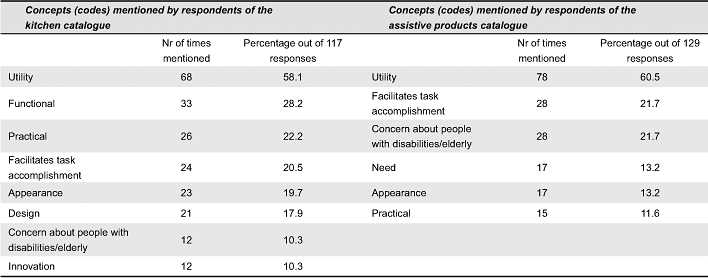
Analyzing the attributes respondents consider when justifying the preference for one object over another, the results show that “utility” is the most frequently mentioned. Along with “functionality” and “design”, the other most mentioned attribute by KC respondents is “appearance”. For the APC respondents, the results for “utility” are essentially the same – it emerges in first place independent of object ranking. The difference between the APC and the KC groups’ results is that “functionality” no longer appears as second most mentioned attribute in the APC results. It is replaced by “facilitates task accomplishment” and “concern about people with disabilities / elderly”.
The sum of object attributes given by KC respondents reached 404, while APC respondents presented a value of 308. This means that the average number of mentioned attributes per person is 3.5 for the KC respondents and 2.4 for the respondents in the other group.
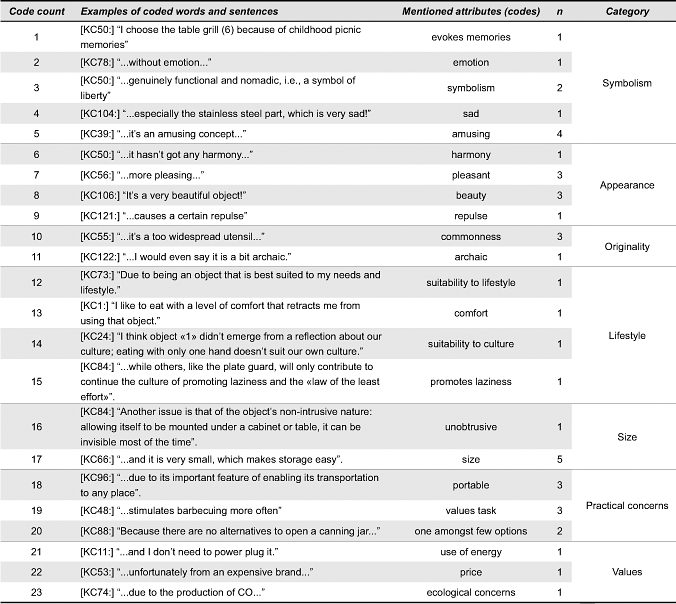
An analysis was conducted of attributes mentioned in the KC group which were not mentioned by the APC group, resulting in the differences shown in Table 5. APC respondents mentioned as a disadvantage the fact that the objects could “remind or bring attention over a health problem” (n=6), while the respondents in the other group did not mention this. This could partly be explained through the image of the wrist support, since 4 out of 6 times respondents mentioned this attribute in reference to the wrist support. The other 2 times this attribute was mentioned was in reference to the plate guard. The other attributes mentioned only by APC respondents were “discretion” (n=2), “resemblance to fitting” (n=1), “friendly” (n=1) and “physical constraints” (n=1). The codes for attributes mentioned by KC respondents which were not mentioned by APC respondents were 23 in total. For analysis, these attributes (codes) were grouped into categories. In part, the results are also influenced by the presence of the table grill. For instance, attributes such as “evokes memories”, or “beauty” were only mentioned regarding the table grill. On the other hand, the majority of these 23 attributes refers to other depicted objects as well.
Table 5. Attributes mentioned by kitchen catalogue respondents in justifying preference (along with its produced codes and categories), which were not mentioned by assistive products catalogue respondents.
Target Audience
A similar phenomenon was observed in the analysis of the responses for the second open-ended question. When asked “In your opinion, to what target audience is this catalogue aimed at?”, respondents of the KC provided more options than APC respondents. The sum of hypotheses given by the KC respondents for “target group” is 243 (average of 2.1 hypotheses given per person), while the sum for the APC group of respondents reached 203 (average of 1.6 hypotheses given per person). Similar to what was done when analyzing the attributes of preferred objects, the responses on anticipated target audience were grouped in a two-step process of coding and categorizing. The results for both groups’ created categories, along with code examples and words/sentences, from which these codes emerged, are shown in Tables 6 and 7. For respondents to the APC, 22 different codes were found (only examples of codes for each category are shown on Tables 6 and 7, but full lists of codes are available from the authors on request), while the number found in the responses within the KC group reached 68. The variety is greater for KC respondents, and this is especially relevant when considering that this group had 117 participants, while the other group had 129 participants.
Table 6. Categories and respective code examples for “target audience” – Results for kitchen catalogue respondents.
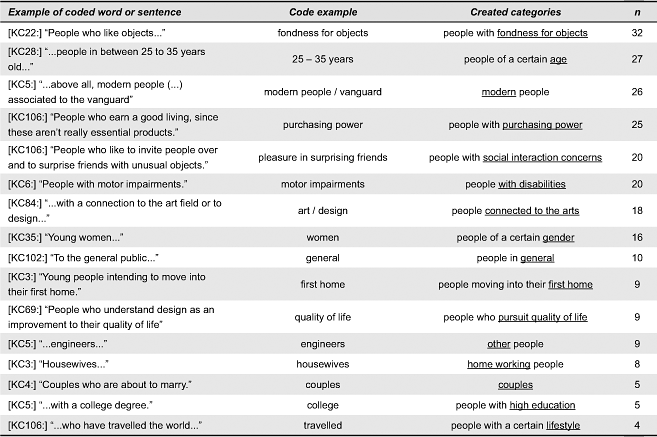
Table 7. Categories and respective code examples for “target audience” – Results for assistive products catalogue respondents.
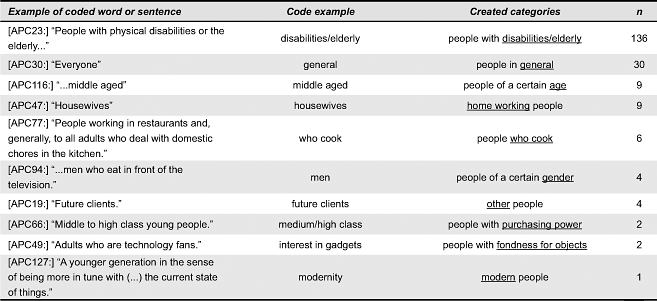
On Table 7, the category “people with disabilities/elderly” includes the codes of “people with disabilities”, “elderly” and “caregivers”, because all of them imply some idea of dependence. Ninety-six (74.4%) out of 129 respondents on the APC identified “people with disabilities” as the target audience. Note that the target audience “elderly” (n=36) only appears within this group’s responses and not once in the KC group. The same is true for “caregivers” (n=4). In the end, only 27 respondents out of the 129 in the APC respondent group did not mention “people with disabilities/impairments”, “elderly” or caregivers” as the target audience.
Twenty respondents in the KC respondent group identified “people with disabilities” as the target audience (17.1% out of 117 statements) (Table 6). But when observing the created categories out of the found codes, the category “people with disabilities” comes in 6th place, while the first place is occupied by “fondness for objects” (27.4% out of 117 statements). In fact, the first 5 categories account for 53.5% of all given suggestions.
We had noticed that product presentation was influencing the way in which respondents regarded, labelled, and categorized products. But in order to assess whether or not the labelling of “products for people with disabilities” would influence the ways in which KC respondents regarded the depicted products, we conducted an analysis of the KC responses considering only those respondents who mentioned “people with disabilities” as the target audience (n=20). For this group of 20 respondents, while “functionality” and “utility” remain the most mentioned attributes (in fact most of the attributes mentioned by these 20 respondents fall into the category of “practical”), others which scored high in the total analysis of respondents disappear from the list of attributes. Examples of these are the attributes under the categories of “symbolism” or “lifestyle”. In other words, people who identified the depicted products as being for people with disabilities, tended to focus on issues regarding proper functioning of the products and not so much in issues regarding hedonic or social meaning.
Now that we have presented the data on the expected target audiences, we can cross it to the results about willingness for possession. For both the KC and APC respondents we have found a significant correlation between the number of wanted objects and the reference to “people with disabilities” (in the KC) or “people with disabilities/elderly” (in the APC): r = -.24, p (one-tailed) <.01 for the KC and r = -.32, p (one-tailed) <.01 for APC. In other words, identifying people with disabilities or elderly as the target audience made respondents want fewer objects.
While KC respondents say they want to have objects mainly due to “utility” and “appearance”, APC respondents mention “utility” and “making the task easier” for “people with disabilities”, “elderly” or “children”, suggesting they would like to have the objects not for self use, but for others in the family, such as elderly people or children.
Confronting Responses to Open-Ended Questions with Hypotheses Forwarded in “Assistive Products’ Selection”
The expected high degree of perceived benefit, which was said to justify the inclusion of the jar opener, was confirmed to be relevant through the responses on object preference in both groups of respondents. The high level of preference for the jar opener appears to be associated with its perceived utility in daily life. Reasons for choosing the glass holder, expected to have a high level of familiarity, were confirmed: it was the object with which most people were acquainted (n=83 for the KC group and n=77 for the APC group). The perceived metaphorical value of the can opener was not confirmed as an attribute respondents would pay attention to, since only one respondent made a reference to it: “[KC50:]...the zooming of the key ring...”.
The low level of familiarity with the vegetable peeler was not verified, as it was one of the objects most familiar to the respondents. Even so, this was one of the most preferred objects (second most wanted for the KC respondents and third most wanted for the APC respondents), due to its utility, its appearance and its benefit for people with disabilities (the latter attribute given by respondents to the APC).
The material and sharp edges of the plate guard were confirmed as attributes respondents would pay attention to and which could influence their judgment – furthermore, these attributes are often seen as being disadvantageous: “[APC62:] ...cold, looks like a fitting, being made out of metal it can also pose danger, if it is meant for people with functional limitations a sliding of the hand could lead to an impact with the object...”; “[APC124:] ...the material does not play in favour of the object, at least in terms of image...”; “[APC146:] ...it seems to me to be the less useful and even ‘less pleasing to touch’ (if it were to be made out of rubber/soft plastic, it would be one of my favourites)”.
We hypothesised respondents would not evaluate the plate guard as being universally beneficial, and in fact, respondents questioned the reason for its existence and its purpose. Even so, there were cases in which respondents did not know what this object was meant for, but imagined different purposes than the original one. For instance, some respondents within the KC group stated this object would be of help when eating in front of the television and others imagined social interactions: “[KC116] ...very handy in cocktail receptions”; while respondents of the APC who rated this object with a 6 mentioned it would be useful to use with their children so that they would not “make a mess” (e.g. APC9; APC128). This difference between groups in the content of the judgement made to the plate guard strikes us as interesting and strengthens the suggestion that once having identified people with disabilities or the elderly as target audience, people tend to focus on practical issues and imagine functional problems these objects might solve, while, conversely, if imagining a different target audience (e.g., respondent KC116, mentioned above, identified as target audience people who look for daily utensils with an appealing design), respondents tend to imagine different situations and contexts of use, almost like finding reasons for this plate guard to be included in a set of high-end products.
Designers and their Awareness of Inclusive Design
Out of 20 respondents to the KC who identified people with disabilities as the target audience, 4 were designers and 7 were design students. And among 10 who stated that the “general public” was the target audience, 4 of them were designers and 3 were design students. Considering there were 17 designers participating as KC respondents (the results on Table 4 present a number of 18 due to the inclusion of an architect), this means that about 76.5% of the respondents who were designers did not evaluate the products as destined for people with impairments or disabilities and the same percentage did not recognize any inclusive design approach to the depicted products. A possible implication of this finding is that these designers, like other respondents, might have been primed not to recognize these designs as inclusive, or might not have been familiar with inclusive design at all. Amongst the respondents of the APC, 2 were designers. Both identified “people with disabilities” as target audience and one of them also identified “elderly”.
Discussion
The results of our experience are not very strong in finding overt references to stigma by the respondents. On the other hand, the results are strong in predicting the presence of stigmatizing feelings when using the elements defined by Link and Phelan (2001). The target audience with which respondents associated the products influenced their labelling, categorization, and stereotyping of the depicted products. Labelling the products as being for people with disabilities or the elderly, led to an evaluation in the first levels of consumer judgement mentioned by Jordan (functionality and usability), while labelling with a different target audience (e.g., highly educated, travelled, people who like to cook) opened the way to evaluations based on deeper, more meaningful and symbolic attributes, with a special difference when it comes to meanings related to social interaction.
Also, this labelling was found to happen because of the context (catalogue presentation) in which products were shown. Most respondents to the APC catalogue identified people with disabilities or the elderly as the target audience, while the number of KC respondents who identified a similar target audience was much smaller. This priming could have been due to the graphic presentation itself or/and to the presence of the table grill in one case and the wrist support in the other.
The results have shown that the average number of wanted objects is identical in both groups, which would seem to contradict all the other results, including the significant correlation between the number of wanted objects and the identification of “people with disabilities/elderly” as the target audience. However, further analysis of the results suggests that APC respondents who wanted more objects tended to want them not for personal use, but because of practical benefits these objects would bring to the lives of others within their families, such as elderly people or children.
This concern about benefit for others was also found to influence the way APC respondents expressed their preference for particular objects, even if they were not thinking about significant others. For instance, even though they didn’t need it for themselves, 13 APC respondents mentioned they preferred the wrist support. And their preference justifications were made in regard to valuable design, i.e. in terms of an idea that would improve the lives of people with disabilities.
The high number of responses referring to “utility” to justify object preference in the results from both groups could have happened because people tend to evaluate all products in this way, or due to possible priming done by the captions that accompanied the products in the catalogue. All captions only referred to utility and functional aspects. What the results suggest is that even if for both groups “utility” is the most important reason for wanting an object, for APC respondents this reason is enough per se, while for KC respondents “utility” is complemented with additional meaningful and symbolic attributes.
Another possible influence on the experiment’s results could have been the fact that people do not always state their real reasons for their preferences. In consumer behaviour and marketing research, there are several references on the need consumers have to justify their choices to themselves and to others (Simonson, 1989). So, for instance, people may prefer a given product due to the socio-pleasure which it provides, but find at the same time that this reason will not be well accepted by others, thus using other more acceptable reasons to justify their preferences.
Even with this possible drawback, our findings suggest that the biggest difference between respondents’ answers in both groups was in the qualitative analysis and outcomes of the answers: KC respondents, especially those who did not identify “people with disabilities” as the target audience, allowed themselves a more profound evaluation in terms of meaningful and symbolic associations which they applied to the depicted products.
Our experiment raises the question of where should design intervene in order to improve the acceptability of daily living aids – should it be at the product design level or in the form of presentation? Our results suggest intervention should be made at both levels. Designers should be very careful, for instance, in choosing and employing appropriate materials, for people are reluctant to accept “cold” products or products in which the materials used might present some kind of threat to safety, like “sharp edges”. But our results also suggest that even if these factors are accounted for in the design of daily living aids, and even if they are designed using an inclusive design approach, acceptability might still be low due to an associated layer of social meaning, i.e. even if appearing to be pleasurable to the senses, if these products are associated with a depreciated group, acceptability will most probably decrease. So, daily living aids could benefit from being presented the same way as any other consumer good instead of being advertised as products for a very specific target audience, such as people with disabilities or elderly people.
Conclusions
For the same set of questions regarding the same 5 APs, there were significant differences in respondents’ answers, particularly in the quantity of information provided. For instance, KC respondents made use of many more terms, ideas and concepts when explaining their preference for one object over another or when trying to identify the intended target audience of the catalogue which they were given, than the respondents to the APC. Even though there were fewer KC respondents than APC respondents (117 vs. 129), the analysis of the former group’s responses retrieved 62 attributes to justify object preference, while the latter only reached 44. The same is true for hypotheses given relating to the intended target audience: 68 suggestions were made by KC respondents in contrast to 22 provided by APC respondents. We deduce there is a correlation between anticipated target audience and the judgments made about depicted objects, thus suggesting that the hypothesis that respondents’ judgment varies with the form of presentation is true. We have also found a significant correlation showing that if people identify “people with disabilities/elderly” as the target audience, they will want fewer objects.
Even so, there were no significant differences between groups in the willingness for possession which they expressed for depicted objects, except: (1) when considering respondents who reported not wanting any of the depicted objects (21.7% in the APC versus 1.7% in the KC group), and (2) when analyzing who the respondents wanted the objects for. Also, it was found that the first and most mentioned motive for object preference was its utility, regardless of who the intended target audience was perceived to be, although these results could also have been primed through the catalogues (see Discussion section).
The form of product presentation was found to have an effect on the quantity and type of attributes assigned to the objects. Respondents to the KC who identified “people with disabilities” as the target audience tended to focus on usability and functionality and did not relate the objects’ appeal to social interaction or object symbolism. The answers of the respondents who did not know what the plate guard was intended for confirm this: APC respondents imagined practical and routine functions (and some criticized the object’s design because it brought “attention to a health problem” – See section “Preference”), while KC respondents imagined situations related to social interaction and different contexts, like use in a “cocktail reception”.
We believe these results suggest that, should consumers come across one of these APs and not be aware of its intended original purpose or its target audience, they would not find it stigmatizing because they would not attach depreciated meanings to it, nor associate it with depreciated social groups, and consequently would probably consider buying it. What our results show is that preventing negative and depreciative labelling and categorization can be achieved through design, and that being able to prevent these would decrease the probabilities of the stigma process unfolding. The possibility of bringing APs from the margins to the mainstream would probably have great benefits for people with disabilities not only by decreasing the stigma associated with them, but also by increasing APs’ points of sale, thus augmenting the amount of information available about them, as well as the degree of access to these devices.
Beyond showing the influence of product presentation, the results also give designers clues concerning respondents’ concerns about materials, colours, size and the transportation of products. Using these clues could help designers to design more appealing assistive products both for people with, and for people without, disabilities, provided that these products are presented as general consumer goods.
Finally, the results showing the lack of familiarity of respondents who were designers with inclusive design values, and the failure of designers responding to the KC to identify these objects as being for the use of people with disabilities or for the elderly, suggests that there is a need to raise awareness about these issues in the design community.
Acknowledgments
The authors would like to express their gratitude to the anonymous reviewers who gave important suggestions for the paper. This paper is part of a research project conducted with the financial support of the Portuguese foundation FCT (Fundação para a Ciência e a Tecnologia).
Endnotes
1 All of the respondents’ sentences presented in the paper were translated by the authors.
References
- Adaval, R., & Monroe, K. B. (2002). Automatic construction and use of contextual information for product and price evaluations. Journal of Consumer Research, 28(4), 572-588.
- Ashley. (2010). Welcome Eva Solo. Retrieved December 09, 2011, from http://blog.awhiteroom.com/welcome-eva-solo_617.html
- Bettman, J. R., Luce, M. F., & Payne, J. W. (1998). Constructive consumer choice processes. Journal of Consumer Research, 25(3), 187-217.
- Boradkar, P. (2004). Beautiful beings: Aesthetics in industrial design and cultural studies. Paper presented at the National Design Education Conference, Industrial Designers Society of America (IDSA). Retrieved May 15, 2011, from http://www.idsa.org/sites/default/files/xiglafiles/Prasad_Boradkar.pdf
- Coleman, R. (2006). From margins to mainstream: Why inclusive design is better design. 2006 Ergonomics Society Lecture address. Retrieved May 15, 2011, from http://www.ergonomics.org.uk/espdfs/ErgSocLecture.pdf
- Crilly, N., Moultrie, J., & Clarkson, P. J. (2004). Seeing things: Consumer response to the visual domain in product design. Design Studies, 25(6), 547-577.
- Desmet, P., & Hekkert, P. (2007). Framework of product experience. International Journal of Design, 1(1), 57-66.
- Feijs, L., & Overbeek, K. (2003). Design science: Meaning, action and value. In Proceedings of the 6th Asian Design International Conference [CD-Rom]. Tsukuba, Japan: . University of Tsukuba.
- Goffman, E. (1986). Stigma: Notes on the management of spoiled identity. New York: Touchstone.
- Hirsch, T., Forlizzi, J., Hyder, E., Goetz, J., Kurtz, C., & Stroback, J. (2000). The ELDer project: Social, emotional, and environmental factors in the design of eldercare technologies. In Proceedings of the 1st ACM Conference on Universal Usability (pp. 72-79). New York: ACM.
- Hocking, C. (1999). Function or feelings: Factors in abandonment of assistive devices. Technology and Disability, 11(1/2), 3-11.
- Hocking, C. (2008). Objects of meaning: Assistive devices as symbols of professionalism, identity and disability. In Proceedings of the ARATA 2008 National Conference [CD-Rom]. South Australia: Australian Rehabilitation & Assistive Technology Association.
- Holbrook, M., & Skilbeck, C. E. (1983). An activities index for use with stroke patients. Age and Ageing, 12(2), 166-170.
- Jordan, P. W. (2000). Designing pleasurable products. London: Taylor & Francis.
- Katz, S., Down, T. D., Cash, H. R., & Grotz, R. C. (1970). Progress in the development of the index of ADL. The Gerontologist, 10(1), 20-30.
- Link, B. G., & C., P. J. (2001). Conceptualizing stigma. Annual Review of Sociology, 27(1), 363-385.
- Lorentzon, U., Bolmsjö, G., Doyle, M., & Carus, D. (2007). Magic-Hand: A bottle and jar opening machine for people with severe disabilities. Gerontechnology, 6(2), 79-88.
- Mahoney, F., & Barthel, D. (1965). Functional evaluation: The Barthel Index. Maryland State Med Journal, 14, 56-61.
- Maslow, A. H. (1954). Motivation and personality (3rd ed.). Hong Kong: Longman.
- McRaney, C. (2010). Anchoring effect. Retrieved June 27, 2011, from http://youarenotsosmart.com/2010/07/27/anchoring-effect/
- Moreau, C. P., Markman, A. B., & Lehmann, D. R. (2001). “What is it?” Categorization flexibility and consumers’ responses to really new products. Journal of Consumer Research, 27(4), 489-498.
- Næss, I. R., & Øritsland, T. A. (2005). Inclusive, mainstream products. In Proceedings of the International Conference on Inclusive Design [CD-Rom]. London: Helen Hamlyn Research Centre at the Royal College of Art. Retrieved June 27, 2011, from http://www.hhc.rca.ac.uk/archive/hhrc/programmes/include/2005/proceedings/
- Norman, D. A. (2004). Emotional design: Why we love (or hate) everyday things. New York: Basic Books.
- Pape, T. L.-B., Kim, J., & Weiner, B. (2002). The shaping of individual meanings assigned to assistive technology: A review of personal factors. Disability and Rehabilitation, 24(1/2/3), 5-20.
- Pullin, G. (2009). Design meets disability. Cambridge: MIT Press.
- Ricci, S. (2011). Eva Solo updated. Retrieved December 09, 2011, from http://www.elmanco.com/2011/04/01/eva-solo-updated/
- Ripat, J., & Woodgate, R. (2010). The intersection of culture, disability and assistive technology. Disability and Rehabilitation: Assistive Technology, 6(2), 87–96.
- Rouvray, A. d., Bassereu, J.-F., Duchamp, R., Schneider, J.-S., & Charbonneau, S. (2008). Perception and deception: How quantity and quality of sensory information affect users’ perception of office chairs. The Design Journal, 11(1), 29-50.
- Scherer, M. J. (2010). Assistive product selection focusing on the person, milieu and product. In J. H. Stone & M. Blouin (Eds.), International encyclopedia of rehabilitation. Retrieved June 27, 2011, from http://cirrie.buffalo.edu/encyclopedia/en/article/115/
- Schifferstein, H. N. J. (1995). Contextual shifts in hedonic judgements. Journal of Sensory Studies, 10(4), 381-392.
- Schifferstein, H. N. J., & Zwartkruis-Pelgrim, E. P. H. (2008). Consumer-product attachment: Measurement and design implications. International Journal of Design, 2(3), 1-13.
- Seale, J., McCreadie, C., Turner-Smith, A., & Tinker, A. (2002). Older people as partners in assistive technology research: the use of focus groups in the design process. Technology and Disability, 14(1), 21-29.
- Simonson, I. (1989). Choice based on reasons: The case of attraction and compromise effects. Journal of Consumer Research, 16(2), 158-174.
- Strack, F., & Mussweiler, T. (1997). Explaining the enigmatic anchoring effect: Mechanisms of selective accessibility. Journal of Personality and Social Psychology, 73(3), 437-446.
- Strauss, A., & Corbin, J. (1990). Basics of qualitative research: Grounded theory procedures and techniques. Newbury Park: Sage Publications.
- Tuominen, R., Tuominen, S., Suominen, C., Möttönen, T., Azbel, M., & Hemmilä, J. (2010). Perceived functional disabilities among rheumatoid arthritis patients. Rheumatology International, 30(5), 643-649.
- Voorbij, A. I. M., & Steenbekkers, L. P. A. (2002). The twisting force of aged consumers when opening a jar. Applied Ergonomics, 33(1), 105-109.
- White, K., & Dahl, D. W. (2006). To be or not be? The influence of dissociative reference groups on consumer preferences. Journal of Consumer Psychology, 16(4), 404-414.
- World Health Organization. (2001). International classification of functioning, disability and health (ICF). Geneve, Switzerland.
Appendix
The questionnaire used in this study.