
Visitor Attention and Communication in Information-Based Exhibitions
Soyeon Kim and Hyunju Lee*
Visual Communication Design Lab, Department of Human Environment & Design, Yonsei University, Seoul, Republic of Korea
As the role and domain of exhibitions have expanded, the exhibition has been used as a communication medium in increasingly diverse areas. In particular, the rapid increase in information-based exhibitions has been followed by an expansion of the role of exhibition text as well as the emergence of various typographical presentation methods for more effective communication. Therefore, this research was conducted to study the attention and communication characteristics of exhibition visitors, focusing on the presentation method of using an entire architectural surface, such as the floor, wall, or ceiling of an exhibition hall, as the presentation interface. In addition, in-depth interviews were used after comparative experiments with the panel display, the most popular conventional method used in exhibitions. The test results showed a significant positive correlation between visitor attention and communication. Compared with the panel display, the typographical presentation method utilizing the architectural surface as interface (ASI) was found to increase visitor attention by stimulating more of the visitor’s interest and by transforming each exhibition element into a visual reference through variations in the position and scale of typography. Most of all, when compared with the panel display, the ASI display was found to be more effective in communicating with casual visitors who are skimming through the exhibition.
Keywords – Attention, Architectural Surface, Communication, Exhibition Typography, Information-based Exhibition.
Relevance to Design Practice – This research proposes information display methods for effective communication with visitors by attracting their attention in exhibitions designed for communication.
Citation: Kim, S. Y., & Lee, H. J. (2016). Visitor attention and communication in information-based exhibitions. International Journal of Design, 10(2), 15-30.
Received Febuary 6, 2015; Accepted April. 6, 2016; Published August 31, 2016.
Copyright: © 2016 Kim & Lee. Copyright for this article is retained by the authors, with first publication rights granted to the International Journal of Design. All journal content, except where otherwise noted, is licensed under a Creative Commons Attribution-NonCommercial-NoDerivs 2.5 License. By virtue of their appearance in this open-access journal, articles are free to use, with proper attribution, in educational and other non-commercial settings.
*Corresponding Author: hyunju@yonsei.ac.kr
Soyeon Kim is a co-owner of Soyoo Co. Ltd., specializing in visual communication and interior & furniture design, and currently teaches at several universities and colleges in Korea (South). She received BA and doctoral degrees in design at Yonsei University in Seoul, Korea and an MFA degree at the School of the Art Institute of Chicago in the United States of America.
Hyunju Lee has been serving as a professor in the Department of Human Environment and Design at Yonsei University since 1997. She graduated from the College of Fine Arts at Ewha Womans University and moved to Japan, where she earned a master’s degree from Tama Art University and a doctorate from the Tokyo National University of Fine Arts and Music. She served as president of the Asia Digital Art and Design Association and is currently chairman of the editorial board of the Korea Society of Design Science. She has published more than 50 articles and has released books including Information Design (2011) and Color Design Project 14 (2007).
Introduction
While early exhibitions were for the collection and preservation of objects and limited to people of a particular class or to intellectuals, exhibitions became an effective tool for research and education and became popular with the general public. Nowadays, as the scope of the exhibition industry expands and its cultural aspirations rise, the exhibition’s domain and roles are ever expanding as the means for communication not only in museums but also in the commercial and public service sectors (Edson & Dean, 1994). Today’s exhibition may be viewed as a communication medium or communication environment (Bayer, 1961; Dernie, 2006; Edson & Dean, 1994; Lorenc, Skolnick, & Berger, 2007; Schittich, 2009; Velarde, 2001; Verhaar & Meeter, 1989).
Being used as a means of communication in various domains, the exhibition has evolved from the object-based exhibition,1 displaying relics or art works in museums or galleries, to more of the information-based exhibition (see Endnote 1) of images or texts in science halls, history museums, world fairs, information kiosks, etc. (Figure 1). The increase in information-based exhibitions has resulted in changes in the scope and role of exhibition text,2 from the supplemental role of a simple label or caption explaining the object to a major element of the exhibition content. Such an expansion of the role of text has brought about a diversity of presentation methods to attract the visitor’s attention for effective communication. Not only the most conventional panel display at eye level, but also various media and technologies such as architectural settings, digital interactive equipment, environmental graphics, installations, etc., are in use.
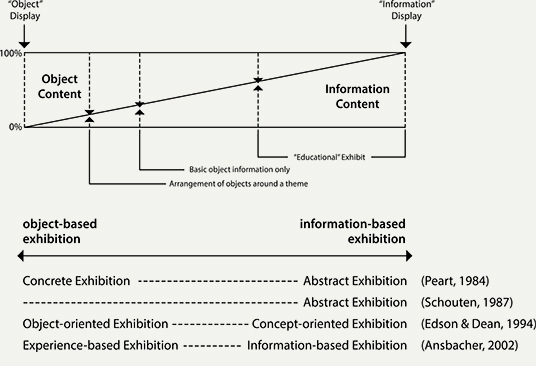
Figure 1. Exhibition content scale (Verhaar & Meeter, 1989).
Accordingly, more effective presentation methods are needed for better communication with visitors in information-based exhibitions. However, until now most research has been focused on object-based exhibitions where typography plays only a supplemental role, such as labels in exhibitions (Bitgood, 2000; Bitgood & Patterson, 1993; Falk, 1997; Kanel & Tamir, 1991; McManus, 1989; Screven, 1992; Serrell, 1996; Wolf & Smith, 1993). Therefore, this study was conducted in order to identify typographical presentation methods for effective communication in the domain of information-based exhibitions. In particular, among the many typographical presentation methods, this study focuses on the use of the architectural surface as the expanded presentation interface, an approach that is common in information-based exhibitions. This study investigates the characteristics of using the exhibition floor, walls, and ceiling as an expanded interface, and discusses evaluation methods for and characteristics of attention and communication in exhibitions. Also, based on the assumption that typographical presentation methods utilizing architectural surfaces affect visitor attention and communication, a comparative study with panel displays, using post-hoc interviews, was conducted to understand their characteristics. The characteristics of, and relationship between, visitor attention and communication effects, when the typographical presentation is expanded to an architectural surface, are discussed and summarized through quantitative measures and qualitative study.
Architectural Surface as Interface
The most popular and conventional method of presenting information in exhibitions is to display text or images on boards or panels at the eye level of visitors who view them in a standstill posture; this has been the typical method employed for displaying paintings or sculptures in object-based exhibitions. Nowadays, as the exhibition text plays a major role in information-based exhibitions, the scope of the typography, which used to be confined to the panel or board, has expanded to include all of the architectural surfaces—walls, ceilings and floors—of the exhibition hall (Figure 2). As the typography uses the vertical areas as well as the entire surfaces of the floors and ceilings, its scale, positioning and typographical expression can be much more versatile (Figure 3), and as the typography uses the vertical areas as well as the floor and ceiling surfaces, visitors do not view the objects in the two-dimensional mode in a standstill posture, but move around and expand their fields of vision to receive communication by environmental perception through their interaction with the entire exhibition space (Figure 4).
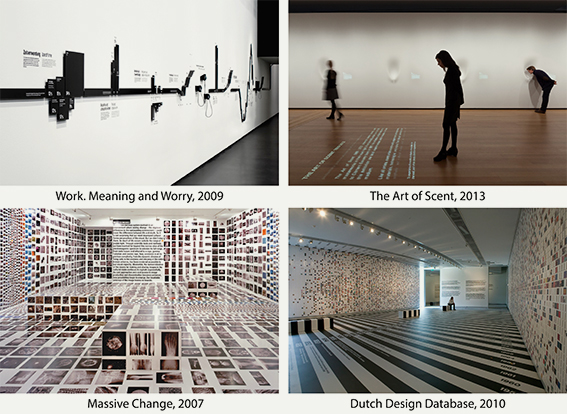
Figure 2. Examples of exhibitions using the exhibition hall surface as interface.
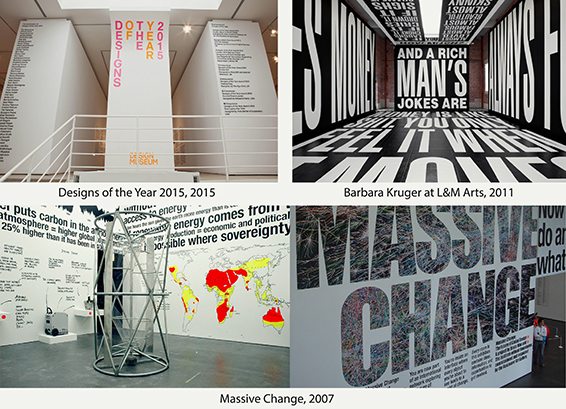
Figure 3. Examples of typography using ASI.
When exhibition viewing is compared with book reading, the eye movements of book readers may be equivalent to the whole-body movements of exhibition visitors, such as head turning, back bending, walking, etc. (Bayer, 1961). When a visitor views an exhibition with active body movements, the body gives orientation, establishes range, and gives scale according to the visitor’s movements (McCullough, 2005). In other words, depending upon the visitor’s movements the typographical presentation using the entire architectural surface as interface3 (ASI) not only may become the figure itself or the background, but may also vary in scale. If ASI is used as an extended canvas for the presentation of information, the scale of typography may become extreme or more dynamic in expression, so that it may draw more attention from visitors by causing more active and responsive communication. Accordingly, the aim of this study was to investigate the characteristics of visitor attention and communication under the condition of using ASI for typographical presentation.
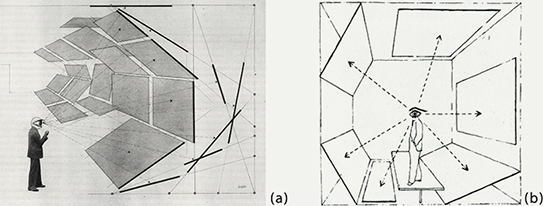
Figure 4. Diagram of field of vision ([a] Bayer, 1929; [b] Bayer, 1936; both cited in Bayer, 1961, p. 277).
Exhibition Attention and Communication
From the perspective of structural break, exhibition communication has commonality with mass communication (Thompson, 1995). Because the communication between visitors and medium occurs in the exhibition hall without the exhibitor, there exists a structural limitation in enhancing communication efficiency via immediate feedback from visitors (Hooper-Greenhill, 2013). This limitation increases the importance and role of the medium in exhibition communication. Accordingly, various medium display methods are being researched and applied to promote effective communication. In other words, various presentation methodologies are sought in order to improve communication efficiency by attracting the visitor’s attention. This is because visitor attention is the key factor for effective communication in exhibitions (Bitgood, 2000; Shettel, 2001). It is important to attract and hold the visitor’s attention for effective communication in a successful exhibition. However, visitor attention is not always translated into effective communication (Shettel, 2001). Therefore, our intention in this study was to investigate, through visitor studies, the characteristics of visitor attention and communication, and their correlation, when the presentation of exhibition typography is expanded to ASI.
Of the four areas of visitor studies—demographic studies, ethnological studies, behavioral studies, and knowledge-based studies (McManus, 1987)—behavioral studies and knowledge-based studies are more commonly used for evaluating visitor attention and communication. The behavioral study evaluates the visitor’s attention by closely monitoring the visitor’s behavior to measure the degree of exposure to exhibition elements, while the knowledge-based study evaluates the communication level by measuring acquired knowledge after the exhibition. The tracking of visitor reaction such as the visitor’s physical movement or actions in the exhibition hall is the most basic and commonly used method employed in studying the relationship between visitors and exhibition design (Klein, 1993), because visitor behavior is closely related to the communication level (Borun, Chambers, & Cleghorn, 1996; Gabrielli, Marti, & Petroni, 1999).
The attention characteristics are studied by monitoring the visitor’s behavioral characteristics in the exhibition hall. For this purpose, hit rate (attracting power, the number of stops at the exhibition element), mean duration (viewing time, holding power; Falk & Storksdiek, 2005; Screven, 1974), and engagement level (reaction to each item of exhibition content; Barriault & Pearson, 2010; Boisvert & Slez, 1995) are commonly used. The hit rate is defined as the ratio of visited exhibition elements to total elements; the mean duration is defined as the real time of engagement with an exhibition element; and the engagement level is defined as the degree of the visitor’s interaction with an exhibition element. Visitor behavior is classified by monitoring the behavioral characteristics of visitors in the exhibition hall (Dean, 1994; Serrell, 1996; Sparacino, 2002; Verón & Levasseur, 1989; Table 1). Among the studies, the work of Verón and Levasseur, which classified visitor behavior into four styles by analogy to four animals—fish, grasshopper, butterfly, and ant—is one of the most preferred references (Gabrielli et al., 1999; Sookhanaphibarn & Thawonmas, 2009; Zancanaro, Kuflik, Boger, Goren-Bar, & Goldwasser, 2007). The fish style represents visitors skimming through the whole exhibition content in a shallow way from the center of the hall in a very short time. The grasshopper style represents visitors who selectively view only the exhibition content that is of interest to them. The butterfly style represents freestyle visitors who move around much and change their viewing direction frequently, not following the curator’s recommendation but visiting almost all of the exhibition content, with frequent stops. The ant style represents visitors who spend a long time viewing the exhibition elements closely, one by one.
Table 1. Classification of visitor styles.

The evaluation methods used to determine the level of communication in exhibitions are intended to measure the changes or differences in a visitor’s understanding of an exhibition’s content before and after visiting the exhibition, via interviews or questionnaires. The most widely used methods are the basic evaluation methods of questionnaires, personal meaning maps (PMM), and individual interviews.
The PMM is designed to measure various aspects of changes in individual conceptualization over time (Falk, Moussouri, & Coulson, 1998; Falk & Storksdieck, 2005). The PMM method entails the following: Before visitors view the exhibition, a paper with a cueing word for the exhibition content in the center is presented to the visitors and they are asked to write down any words, images, phrases, or thoughts related to the cueing word that come into their minds. After viewing the exhibition, they are asked to add, delete, modify, or change their responses in the PMM prepared before the visit. According to the methodology proposed by Falk and Storksdieck (2005), changes in individual conceptualization of the subject are measured by PMM in four areas, broadly defined as extent, breadth, depth, and mastery. Extent measures the number of words describing the subject, and breadth measures the number of conceptual categories describing the subject. Depth evaluates the specific details in the descriptions in each breadth category, and mastery measures the visitor’s understanding of the overall concept. The PMM is used to evaluate communication effectiveness by assessing individual cognitive changes from various perspectives.
In this study, hit rate, mean duration, and engagement level were used as the evaluation tools for visitor attention, and visitors’ attention styles were analyzed by monitoring their movement patterns. Questionnaire, PMM, and interview were used as the evaluation tools for communication (Figure 5). Their correlation characteristics were investigated by evaluating the characteristics of attention and communication, when the presentation of exhibition typography was expanded to ASI.
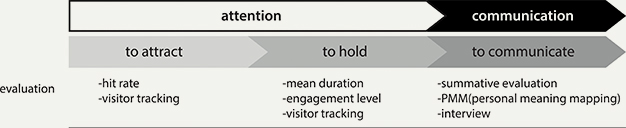
Figure 5. Evaluation methods for visitor attention and communication.
Experiments
Study Description
Experiments were conducted to determine the characteristics of visitor attention and communication in information-based exhibitions utilizing ASI as a means to present typography. To accomplish this objective, the most common and frequently used method, that of using eye-level panel displays (Experiment A), was compared with ASI displays on the walls, floor and ceiling of an exhibition hall (Experiment B). The experiments were carried out in an exhibition setting built in the auditorium of the Taegang Sahmyook primary school with 110 students of the fifth grade on April 14, 2014.
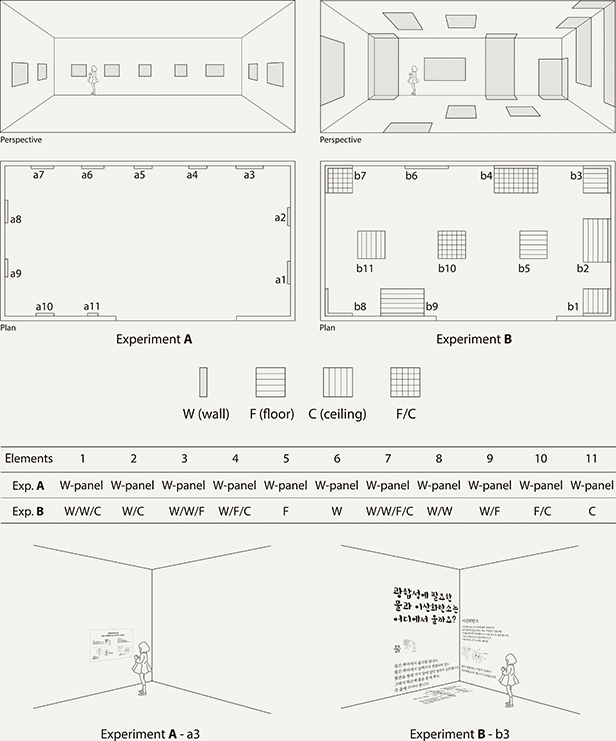
Figure 6. Experimental setting.
Settings and Content
In this comparative study, the exhibition that displayed the typography on eye-level panels was labeled as Experiment A, and the exhibition using architectural surfaces as the typographical presentation interface was labeled as Experiment B. For Experiment A, 11 panels were displayed at eye level using font sizes of 80 pt for titles, 30 pt for sub-titles, and 22 pt for content, based on the guidelines of prior studies (Kentley, 1989; Serrell, 1996; Spencer, 2002). For Experiment B, content was exhibited in the same space with no added structure compared to Experiment A, but with 11 different scales and positions composed of various combinations of floor, wall and ceiling displays (Figure 6).
To match the architectural settings such as lighting, temperature, structural space, etc. Experiments A and B were both conducted at the same place an hour apart. The experiments were conducted in a rectangular space 44 m2 in area with white walls, floor, and ceiling, and with dimensions of 9,800 mm in length, 4,500 mm in width, and 295 mm in height. In both experiments, the same typographical fonts were used: Hoon Whayangyunwha, the most popular font for child-targeted exhibitions, for the title, and Myungjo, the most basic font, for content. To exclude bias caused by color factors, all typography was designed in grayscale and minimal line drawing illustrations were added to help explain the exhibition content.
The exhibition content was on photosynthesis, and was revised for fifth-grade elementary school students. The title “What makes plants grow?” was displayed in the biology section of the basic science area on the first floor of Gwachun National Science Hall.
Participants
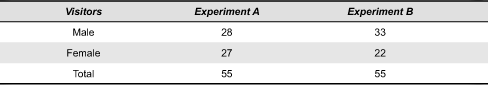
Elementary-school students were chosen for the experiments because there are many exhibitions targeted at these children for the purpose of education, such as in museums and science centers. Accordingly, there is a rising trend in studies focused on children in exhibitions (Anderson, Piscitelli, Weier, Everett, & Tayler, 2002; Palmquist & Crowley, 2007; Piscitelli & Anderson, 2001). Students of the same school and grade were selected to minimize visitors’ personal factors such as prior knowledge, experience, motivation, purpose, etc. Specifically, fifth-graders of age 11 were chosen because the exhibition content on photosynthesis was in their regular curriculum, but at the time of the experiments the subject of photosynthesis had not been covered. A total of 110 students, 55 students for each experiment, took part in the experiments, and a maximum of eight students with roughly equal proportions of male and female students were allowed in at a time, to minimize social factors (Table 2).
Table 2. Participants in the experiments.
Experimental Procedure and Data Gathering
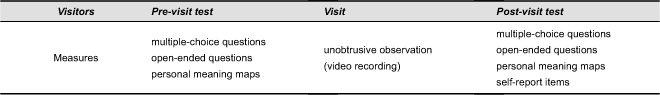
The experiments proceeded with a sequence of three phases: pre-visit test, visit, and post-visit test. The pre- and post-visit tests were composed of questions on photosynthesis with three open-ended questions, 11 multiple-choice questions, and the PMM. The levels of the multiple-choice questions and open-ended questions were supervised by three elementary-school teachers with more than 10 years of teaching experience. The 11 multiple-choice questions were designed to respond to the content of 11 individual panels and were of the same degree of difficulty. The content of the pre- and post-visit tests was identical, except that self-report questions were added to the post-visit test. To minimize its influence on the viewing of the exhibition, the pre-visit test was conducted in the classroom before viewing the display, and no announcement was made on the test at that time. The cueing word for the PMM was the same as exhibition theme, “What makes plants grow?” The same questions were used for both pre- and post-visit tests, and the self-report questions were added to the post-visit test only. The students were allowed to move freely without restriction during their visit to the exhibition hall. Video recordings were made at the same position for both experiments A and B to monitor visitors’ behavioral characteristics with no interference in visitors’ movements during the visit. After the experiments, the video recordings were analyzed to evaluate the visitors’ movement patterns and to measure hit rate, mean duration and engagement level.
Table 3. Summary of repeated measures of the experiments.
Results and Analysis of Experiments
Comparative Analysis of Exhibition Attention
To evaluate the characteristics of visitor attention, a comparative analysis was performed using hit rate, mean duration, and engagement level as the indicators.
Hit Rate
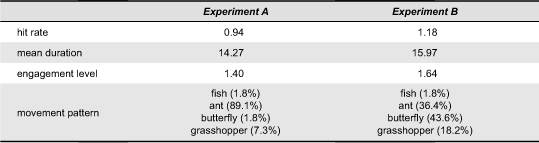
The average hit rate, repeated measurements of which were allowed for both experiments, was higher in Experiment B than in Experiment A (Table 4). The differences in the hit rates of Experiments A and B were attributed to the differences in visitor movement patterns (Figure 7).
Table 4. Hit rates of the experiments.
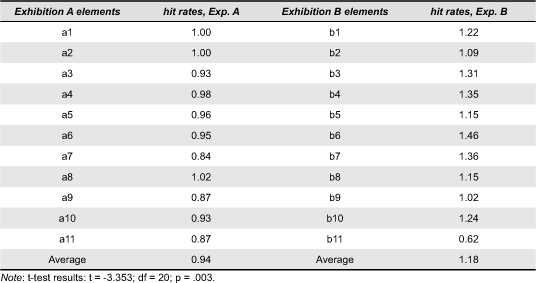
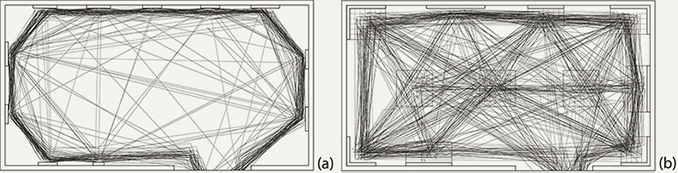
Figure 7. Visitor movement patterns: (a) Experiment A (b) Experiment B.
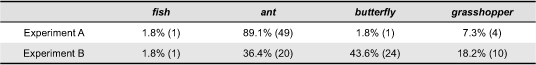
In the eye-level panel display exhibition of Experiment A, most of the visitors viewed the exhibition in an orderly fashion starting from the right side of the entrance, and the visitors showed the movement pattern of waiting in line until preceding visitors finished their viewing. In Experiment A, most of the visitors—more than 89%—showed a movement pattern of the ant type, while 7.3%, 1.8%, and 1.8% respectively of visitors showed movement patterns of the grasshopper, butterfly, and fish types, based on the four visitor movement patterns classified by Verón and Levasseur (1989; Table 5). Since most of the visitors showed the ant pattern, the hit rates of all 11 elements of Experiment A turned out to be similar to the average hit rate.
Unlike in Experiment A, visitors in Experiment B showed a variety of movement patterns in the exhibition (Figure 7, Table 5). Even the starting points for visitors after entering the exhibition hall varied widely. The butterfly type, which moves irregularly and repeatedly to and fro, was predominant, accounting for 43.6% of visitors; the ant type accounted for 36.4%, the grasshopper type for 18.2%, and the fish type for 1.8%. Because of the high proportion of butterfly-type visitors who moved arbitrarily and changed direction frequently, the hit rates for Experiment B were higher than for Experiment A. But the hit rate of b11, an exhibition element that used the ceiling as the canvas, was relatively low probably because many visitors passed by without noticing the element.
Table 5. Visitor movement styles of experiments.
Mean Duration
The mean duration for the 11 elements was 15.97 for Experiment B, which was slightly higher, but not statistically significantly so, than the 14.27 for Experiment A. While the mean durations for each of the 11 elements were similar, the mean durations for elements b5 and b11 of Experiment B were relatively low (Table 6). The reasons for the low mean durations might either be visitors passing by without noticing these elements, or difficulties in maintaining an awkward position such as bending the neck backward for an extended time period, because b5 used the floor only and b11 used the ceiling only as interfaces.
Table 6. Mean duration of experiments.
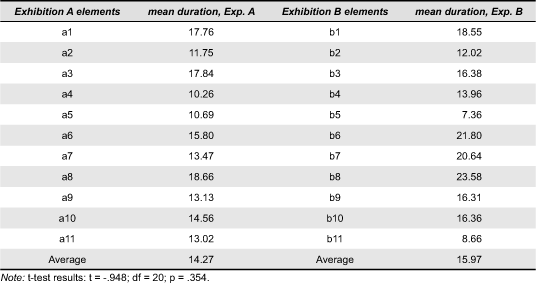
Accordingly, when b5 and b11 are excluded, the average mean duration of Experiment B would be 17.73, which is 3.46 longer than that of Experiment A. Its t-test was statistically significant (t = -2.327, df = 18, p = 0.032, p < 0.05) as well. It was confirmed that the Experiment B visitors, who were exposed to typographical displays actively using ASI, engaged with the exhibition elements for longer times.
Another point worth noting is that the mean durations for b1, b6, b7, and b8 in Experiment B were 18.55, 21.60, 20.64, and 23.58 respectively, indicating that the visitor viewing times for the above elements were relatively higher than for the other elements. It is also interesting to note that all of the high-mean-duration elements featured a corner between walls joined together at a 90-degree angle, such as W/W/C for b1, W/W/F/C for b7, and W/W for b8. This means that visitors were exposed to the exhibition elements with cornered walls as interface for longer times than to those without cornered walls.
There was also a significant correlation between physical movement pattern and mean duration (Figure 8). For both Experiment A and Experiment B, the fish and grasshopper movement types showed, in general, short mean durations, and the visitors with mean durations of less than 1 minute showed all four types of movement pattern. But the mean durations of longer than 1 minute were all of the ant type in Experiment A, while they were about equally divided between butterfly and ant types in Experiment B. Unlike the intermediate mean duration of the butterfly type between the ant and fish types reported by Verón and Levasseur (1989), there was no significant difference between the mean durations of the ant type and the butterfly type in Experiment B.
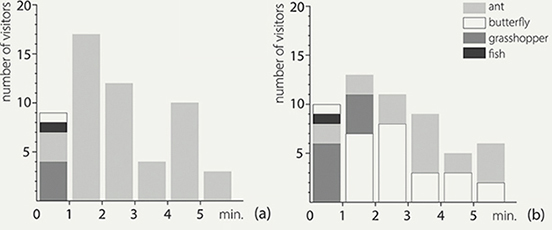
Figure 8. Mean duration and visitor movement style of experiments: (a) Experiment A (b) Experiment B.
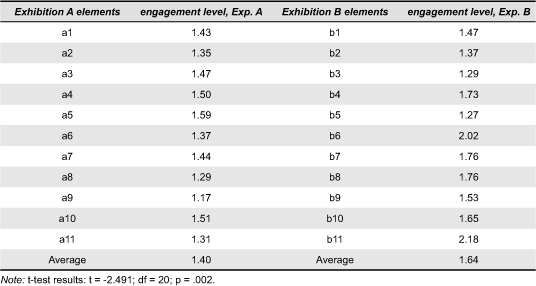
Engagement Level
Compared to Experiment A, Experiment B showed a higher engagement level on average (Table 7). Overall, compared to the Experiment A visitors, the Experiment B visitors showed more active behavioral characteristics, such as pointing fingers, reading aloud, discussing openly with friends, touching, questioning the exhibition staff, hopping around, etc., which might be related to the physical movement patterns of the visitors. In Experiment A, most of the visitors showed the ant type movement pattern of quiet and orderly viewing, which may have led to the relatively low engagement level, while in Experiment B, the high proportion of butterfly type visitors with active and unexpected movement patterns may have resulted in the noticeable differences in engagement levels.
While Experiment A showed engagement levels with exhibition elements similar to the mean engagement level, those in Experiment B varied widely, particularly for the high engagement level of b11. As was previously noted, b11, which was the element using the ceiling as interface, showed a low hit rate and low mean duration, due probably to visitors’ passing by without noticing the element, but it showed a rather high engagement level. This is because visitors showed even more active responses like shouting aloud, calling friends, reading aloud, reading with torso leaning backward or lying down on the floor, etc., once they noticed the element displayed on the ceiling.
Data analysis showed higher levels in all attention indices—hit rate, mean duration, and engagement level—in Experiment B. Accordingly, it was found that Experiment B with ASI display showed higher attention effects overall than Experiment A with eye-level panel display.
Table 7. Engagement levels of experiments.
Comparative Analysis of Exhibition Communication
Communication was evaluated by comparing the results of the pre-visit and post-visit tests. Because the PMM was designed to measure independently and complimentarily the different aspects of cognition in a free-choice learning environment, each of the four constructs was independently evaluated (Falk & Storksdieck, 2005).
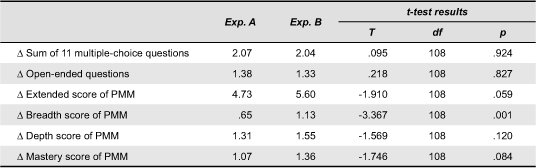
On comparison, the differences in communication between Experiments A and B were not significant. However, interestingly enough, the breadth scores of the PMM were significantly different at the p = .001 level. The breadth score is the number of concept categories explaining photosynthesis. The PMM breadth scores of the Experiment B visitors were higher than those of the Experiment A visitors (Table 8).
Table 8. Comparison of communication outcomes of Experiments A and B.
As an indicator of exposure, used as a measure of attention, the hit rate, mean duration, and engagement level were evaluated for their correlations with the communication evaluation methods of multiple-choice questions and open-ended questions, and the correlative relationship of the four areas of the PMM. As set out in Table 9, mean duration and engagement level showed a significant correlative relationship with communication, but hit rate did not, in the combined statistical analysis for experiments A and B. The same trends were found in the individual analyses of Experiments A and B. This result, as was mentioned by Shettel (2001), is consistent with the view that the simple viewing of exhibition elements while standing still does not necessarily translate into visitor comprehension. However, this study also found that hit rate had a statistically significant correlation with mean duration and engagement level. Therefore, the high level of attention can be regarded as indicative of better communication, in that although hit rate does not have a direct statistical relationship with communication, it has some influence on mean duration and engagement level.
Post-experiment Interview
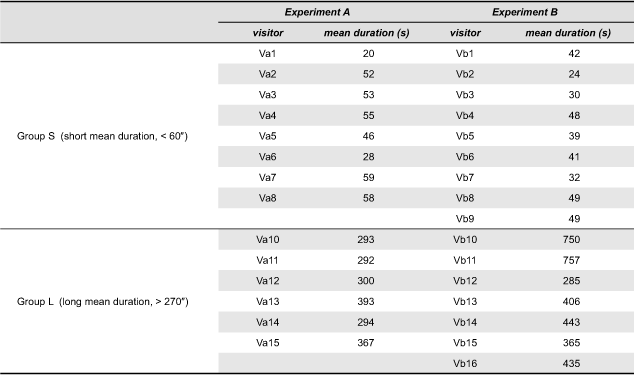
After the experiments, in-depth interviews were conducted to understand the visitors’ attention and communication characteristics and to identify the causes of or reasons for behavioral traits. The interviews were conducted with a total of 30 students out of the 110 participants in the experiments: 17 students (Group S) with less than 60 seconds mean duration, and 13 students (Group L) with more than 270 seconds (3 min) mean duration (Table 9). The interviews were conducted in a classroom at Taegang Sahmyook primary school on a one-on-one basis on May 2, 2014, about three weeks after the experiments. The interviews were carried out in a semi-structured format asking questions prepared in advance, but also with some flexibility depending upon the responses of interviewees. The questions started with (a) somewhat vague questions like “How was the exhibition?”; then moved on to (b) “What do you remember or what stands out after the exhibition?” and (c) “What was the reason for your movement pattern?” after showing the individual movement pattern. The students reported the reasons for their behaviors and observations made in Experiment A or B by recalling their observations during the exhibition conducted three weeks previously. The interviews were recorded, transcribed, and analyzed for later in-depth evaluation.
Table 9. Participants of post-experiment interview.
Results and Analysis of Post-experiment Interview
Comparative Analysis of Attention
Visitor Attention by Exhibition Typographical Presentation
The post-experiment interview results revealed large differences in the way visitors recalled the exhibition between Experiment A and Experiment B. To the question about their overall impression of the exhibition, the visitors’ responses regarding Experiment A were primarily centered on photosynthesis, while those regarding Experiment B were centered on the typography size and location, and other aspects concerning the presentation method or space, rather than the exhibition content. The same trend was observed for both Group S and Group L with only minor variations.
The Experiment A visitors responded with comments like, “It was fun,” “Interesting,” etc. The reasons for the comments were: to know something new or to get interested in science through the exhibition, etc. The comments were focused on the exhibition content, without any special mentions of the exhibition space. The following are some of their comments:
“I’ve been interested in plants, but did not know much, and it was fun to learn something new through the exhibition.” (Va5)
“I was interested in learning something new. Science wasn’t fun to me, but it got better now.” (Va7)
“They were well explained. It was fun to know something that I didn’t know before.” (Va10)
“At first I had no idea, but I got into it because the plants interested me.” (Va14)
Meanwhile, Experiment B visitors also responded with comments like “something interesting” and “fun.” In addition, there were many comments like “awesome” and “unique,” which apparently were attributable to the exhibition’s typographical presentation method. When comparing it with the conventional exhibition, visitors mentioned that the exhibition using all architectural surfaces—wall, floor, and ceiling—was awesome and unique, or that it was good to see all at once. They answered that it gave a more realistic impression than the conventional exhibition with quiet music. All the comments were focused on the exhibition presentation method rather than the exhibition content.
“It was awesome! It was wonderful and fun to look around, here and there, up to the ceiling. I was used to looking at wall displays only. It was easy to understand and it was wonderful to read letters all around the exhibition room.” (Vb3)
“It was marvelous! How could it be possible to display all around the room? And I could see them all at once. It wasn’t boring at all.” (Vb4)
“It was fun to see the displays on the wall, floor and ceiling, which I couldn’t see elsewhere. Wonderful!” (Vb7)
“Other exhibits were on the walls only, but it was awesome to see the displays on the floor, side walls and ceiling. I was wondering how it was done.” (Vb10)
A similar trend was noticed in responses to the question on what the most memorable or outstanding matter was. The Experiment B visitors expressed more interest in the presentation method, and with more enthusiasm, than did the Experiment A visitors. Such trends were found to be in line with the self-report answers of the post-visit test. To the question on the most memorable or noticeable observation, most of the visitors in Experiment A responded with answers related to photosynthesis, which was the main subject matter, while most of the visitors in Experiment B answered with regard to the exhibition content and the exhibition methods or spatial display features (Figure 9). In other words, through the interview and experimental data analysis, it was found that visitors became interested in the typographical presentation method using ASI, which drew their attention.
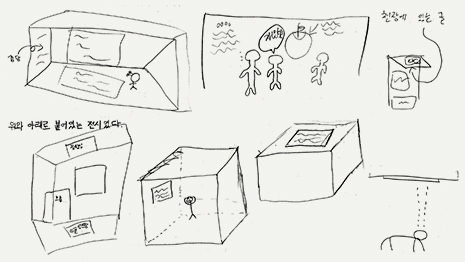
Figure 9. Visitor drawings from post-visit test of Experiment B.
Visitor Movement Pattern and Attention
Most visitors in Experiment A behaved with the ant type movement pattern. After being shown the drawings of their movement patterns, the interviewees were asked why they moved in such a fashion. They answered that they thought that they were supposed to do that, or that they simply followed other people. In this case, regardless of mean duration, Group S and Group L responded similarly. This may be because visitors viewed the exhibition as they are used to, according to the way that the exhibition elements were lined up side by side as in conventional exhibitions.
“I was used to viewing the exhibits in such an orderly fashion.” (Va4)
“Other people moved that way and I thought I should follow.” (Va11)
“Wasn’t that the way of moving in the exhibition?” (Va12)
Those interviewees in Group S of Experiment A who showed the grasshopper movement pattern stated that they did so because of a lack of interest, or because they were having little fun, or were skimming through, etc. Overall, they could not get interested in the exhibition.
“I viewed the images only.” (Va1)
“I moved back and forth for no reason.” (Va2)
“It was no fun. Pictures only, nothing else!” (Va6)
The same questions were put to the Experiment B interviewees after they were shown drawings of their movement patterns. A good portion of the Experiment B visitors showed the grasshopper and butterfly types of movement pattern, which they had been unaware of. They were surprised to learn that this had been the case, or they could not come up with any specific reasons for it. Regardless of their movement pattern, they also answered that they had moved around without paying much attention to their movement pattern or that they thought it was acceptable to do so in such an open space, which was quite different from that of a conventional exhibition. Although no markedly differing characteristics of interest by individual movement pattern were revealed, the visitors were emphatically interested in the exhibition.
“I moved around back and forth as my eyes directed.” (Vb1)
“I skimmed through and surfed around. Then, I stopped and read what seemed to be interesting.” (Vb2)
“Other exhibitions were quiet with subdued music, but this was more realistic. I could touch it, step on it, and it felt real.” (Vb9)
“With no partitions, I could move back and forth with friends while talking with them, and without waiting in line. I enjoyed it.” (Vb12)
Comparative Analysis of Communication
Comparative Communication Analysis of Group S
Most visitors of Group S in Experiment A showed no noticeable increase in scores for multiple-choice questions and the changes in PMM scores were also negligible (Table 10). This means that the communication with visitors was insignificant. As was confirmed by the post-experiment interview, they remembered the exhibition content mostly by pictures, subheadings, or mere word references, with no clear understanding of the content. They guessed without accurately remembering the content. This may be consistent with the fact that only the extent score was increased among the four cognitive evaluation categories of PMM. Through the interview, it was confirmed that there were no changes in the scores for breadth, depth, and mastery, which measured the understanding of overall concept or depth of cognition, although there was an increase in the extent score, which measured the numbers of referenced words, due probably to mere recognition of large titles or pictures in a short time.
Table 10. Visitor mean duration and communication in Group S of Experiment A.
“I remember a little. There were… experiments on mice, and… stoma, xylem, phloem, etc.” (Va1)
“Plant photosynthesis, birds, receiving sunlight.” (Va5)
“It was about plants… roots, food chain, eagle picture…, cactus, insectivorous plant.” (Va7)
When asked the same question on their memories of the exhibition, interviewees in Group S of Experiment B responded with lists of referenced words that schematically outlined the exhibition content. Similar to the results of Experiment A, only the extent score of PMM was increased, with no noticeable changes in other scores (Table 11). However, as was found in the interview scripts, their descriptions showed greater word quantity and specificity than those of Group S of Experiment A. This result may be attributable to the larger increases in the scores for the multiple-choice questions and in the extent scores of PMM than those of Group S in Experiment A.
Table 11. Visitor mean duration and communication effect in Group S of Experiment B.
“I have learned how the plants grow and knowledge related to plants. Photosynthesis is about making nutrients from sunlight; photosynthesis, chloroplasts, chlorophyll, fruits, roles of roots, sustaining mechanism, absorption mechanism, storing nutrients in roots and fruits.” (Vb1)
“Plants use water and CO2 for photosynthesis, stem photosynthesis in the cactus which was in the floor, different colors of underwater plants, xylem, phloem.” (Vb6)
“Xylem, phloem, photosynthesis, role of stem... which were water sucking and absorption, leaves for photosynthesis, roles of roots, how plants use sunlight for photosynthesis, sunlight and its reaction in leaves.” (Vb9)
Most of the referenced words compiled by Group S of Experiment B were related to the questions and answers of the multiple-choice questions and open-ended questions during the pre- and post-visit tests. This result, as could be confirmed by the visitors’ responses below, might be due to the fact that the visitors quickly moved to look for different answers, right after checking the answers of the pre-visit tests.
“I answered the questions before the exhibition. Something I didn’t know popped up, so I read and so on.” (Vb2)
“Surprised when I first got in. There were answers to the questions of the test that I took before I got in.” (Vb8)
Comparing the results of the main experiment and the post-experiment interview indicates that Group S of Experiment B recognized more than Group S of Experiment A, even with shorter mean duration. This suggests that there was a difference in attention style between Experiment A and B visitors with very short mean duration. Although the real attention durations may vary a little, most of the behavior in Experiment A could be regarded as orienting, while most in Experiment B could be regarded as monitoring, according to the attention style proposed by Hawkins, Pingree, Bruce, & Tapper (1997) and by Hawkins et al. (2005). The difference may be attributable to the fact that the visitors in Experiment B acquired the needed information quickly and easily through visual scanning aided by the variations in scale and position of the exhibition content, while the visitors in Experiment A may have skimmed through the displays with lack of interest and enthusiasm due to the large quantity of text all at the same size.
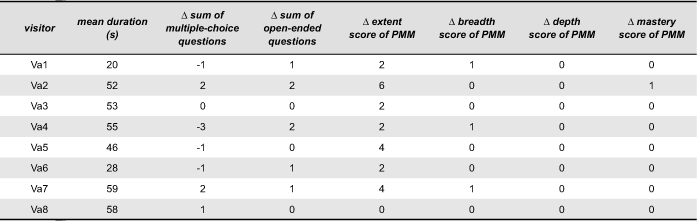
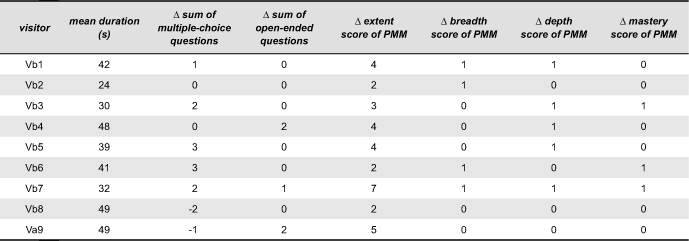
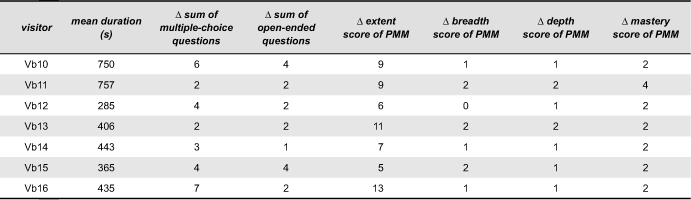
Comparative Communication Analysis of Group L
For Experiments A and B alike, Group L showed better communication than Group S, as indicated by its larger differences in scores between the pre- and post-visit tests, which was confirmed by the post-experiment interview results (Tables 12 and 13). While Group S showed very shallow understanding of the subject matter, as indicated by its simple listing of reference words or mere concept-only understanding, Group L not only remembered more detailed and specific subject content, but also could explain overall concepts as well as key outlines of photosynthesis. However, although there was a noticeable difference in memory of the exhibition, with Experiment A visitors remembering the exhibition content first, while Experiment B visitors remembered the exhibition method first, the differences in cognition within Group L visitors were not significant between Experiments A and B.
Table 12. Visitor mean duration and communication in Group L of Experiment A.
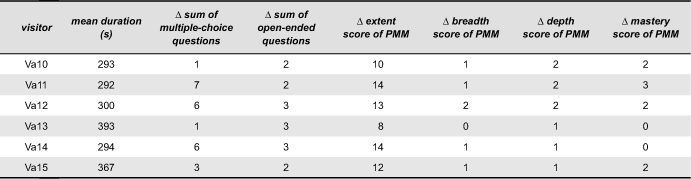
Table 13. Visitor mean duration and communication in Group L of Experiment B.
“The underwater plants were interesting… flower shapes and structure of male stamen, female stamen as well as leaves, and I also remember stems, and their functions.” (Va11)
“Chloroplasts, and their whereabouts, etc., I remember. And the way that the cactus prevents water evaporation, and the way that water escapes through the stoma…” (Va12)
“The reason why plants are in green color, it is because of chlorophyll. The underwater plants also receive sunlight, and plants also breathe… I thought plants didn’t breathe; they simply inhale CO2 and exhale O2. But they breathe day and night as we do.” (Va14)
“I came to understand how plants suck up water through the root system, and store nutrients. And the things that plants need for growth, etc.” (Vb10)
Regardless of the mean duration, there was a noticeable trait commonly associated with Experiment B interviewees. During the interview, they tended to explain items of exhibition content by accurately pointing to the exhibition elements’ respective locations, when they were shown the drawings of their movement patterns. Also, even when they could not remember all the details, they could come up with rough sketches of the content and its respective locations. This trend was not noticed in the Experiment A interviewees, which was quite noteworthy. This finding may be attributable to the Experiment B typography of various sizes and positions, which may have helped visitors to remember elements by their visual traits, compared to the Experiment A typography of similar sizes at the same eye level.
“Here [pointing to the interview map] it was. This was about mouse experiments and that was about corn and so on.” (Vb2)
“Here [pointing to the interview map] was the photosynthesis experiment with a cactus stem on the floor.” (Vb6)
“Here [pointing to the interview map] was a picture on the floor, but I can’t remember. Here [pointing to the interview map] was a mouse, there was a plant.” (Vb7)
“Here [pointing to the interview map] was something on the ceiling, these two were noticeable: the mouse and cactus experiments. Here was a person.” (Vb11)
Discussion
The following summarizes the findings on attention and communication resulting from the comparative studies of panel display and ASI display and the post-experiment interviews.
Firstly, all of the attention evaluation indices for hit rate, mean duration, and engagement level were higher in Experiment B, showing that the ASI display was more effective in attracting visitors’ attention than the panel display. This was also confirmed by the observation that while the visitors in the panel display exhibition showed mostly ant type movement patterns, the visitors in the ASI display exhibition showed more diverse physical movement patterns, such as brisker movement and more proactive engagement with exhibition elements in the exhibition space (Table 14). The interviews indicated that the above results were obtained because visitors perceived the ASI display in Experiment B as a new experience and got more interested in it. The typographical presentation method surfaced first in interviewees’ minds when the Experiment B visitors were asked to remember the exhibition during the post-experiment interview. The higher level of attention in the ASI display could be due to the higher interest followed by higher visual attention than in the panel display.
Table 14. Results for attention.
Attention requires motivation because attention has focusing power, and one of the ways to motivate is to provoke interest (Bitgood, 2000). To attract visitors’ attention, it is important to stimulate and maintain their interest, because interest is the critical factor for feeling arousal, alertness, attention, and concentration (Ainley, 2006; Dohn, 2013). McDaniel et al. (2000) stated that interest generates spontaneous (automatic) attention that makes the information more readily and effectively recognizable. Specifically, the situational interest triggered by environmental stimuli (Hidi & Renninger, 2006; Krapp, 2000; Mitchell, 1993) might attract visitors’ attention. That is, it may be stated that the exhibition with diverse positions and scales of typography using the architectural surfaces of wall, floor and ceiling acted as an environmental factor by triggering situational interest to stimulate visitors’ interest and subsequently draw their attention.
Secondly, it was shown that there was a highly significant correlation between attention and communication. The hit rate did not show a statistically significant relationship with communication, which is consistent with the conclusion of Shettel (2001) that the simple stopping of visitors at an exhibition element does not necessarily translate into their comprehension. However, the hit rate had significant correlations with mean duration and engagement level, which in turn are related significantly to communication. Therefore, overall attention influences communication.
In particular, the significant correlation between mean duration and communication was corroborated by the observation in the post-experiment interviews that Group L, of long mean duration in the exhibition, had wider and deeper understanding of the exhibition content than did Group S of short mean duration. This trend was common for both Experiment A and Experiment B, which confirmed that the stimulation of high attention was the key factor for effective communication.
Thirdly, through the interviews, it was found that Experiment B visitors remembered the exhibition content by the location where the exhibition elements were displayed. This trend was not noticed in Experiment A, where typography of the same size was displayed at the same eye level. The above difference may be attributable to the fact that the ASI display not only attracted visual attention from visitors, and made them move more briskly and engage more deeply, but also provided location-based memories of three-dimensional space rather than of two-dimensional surfaces, due to the extended scale of presentation incorporating a variety of positions for typography using entire architectural surfaces of floor, walls and ceiling as the canvas. As was reported by Zinkhan, Locander, and Leigh (1986) and Bourdeau and Chebat (2003), people retrieve information using reference points or association networks. The variety of typography sizes and positions in Experiment B may have played a role as visual references in remembering exhibition content.
The most important finding in this study was that visitors’ cognition was higher in the ASI display than in the panel display for casual visitors4 of short mean duration. In other words, the variety of typography sizes and positions in the ASI display attracted these visitors’ visual attention resulting in a high level of communication. Accordingly, it may be a viable presentation option for effective communication for the casual visitor who skims through exhibition content with an apparent lack of interest.
Conclusion
This study was designed to understand the characteristics of visitor attention and communication as influenced by the information display methodology in the area of information-based exhibitions. Specifically, the study focused on visitor responses when typography was displayed on the extended interface of the entire architectural surface in contrast to the conventional panel display limited to eye-level presentation. Through experiments comparing ASI display with conventional panel display and through subsequent interviews, visitor attention and communication characteristics of ASI display were monitored, analyzed and evaluated.
Through brisker movement in the exhibition space and more enthusiastic responses at interview, the ASI display was shown to better stimulate situational interest and attract a higher level of attention from visitors than the conventional panel display. The high level of attention was shown to affect the effectiveness of communication. In addition, the ASI display was found to be more effective than the panel display in communicating with casual visitors of short mean duration. Accordingly, in the information-based exhibition intended for providing information, the ASI display could be the better choice of typographical presentation method for effective communication with casual visitors. Also, the typographical presentation method using ASI is not limited simply to exhibition design, but can be adapted to visual communication, interior design and architectural domains such as wayfinding, signage design, PR, advertisements, etc., as one of the ways to attract attention and speed up information flow for a fast-moving society.
The major contribution of this study could be the exploration of the typographical presentation method as a means to stimulate visitor attention and understanding in information-based exhibitions. In particular, it should be meaningful in proposing the ASI display as the typographical presentation method of choice based on analysis and evaluation of the characteristics of visitor attention and communication in information-based exhibitions. It is worth noting that there were some limitations in this study, such as the experimental setting rather than a real-world exhibition, and the visitors being limited to children. Therefore, it is recommended that further study be conducted to confirm the above findings under real exhibition conditions with a variety of visitors including adults, and with in-depth study of the characteristics of interest for each movement pattern. Additional studies may be needed to evaluate visitor attention and communication characteristics under more specific conditions of ASI display for different compositions of wall, floor, and ceiling use, and typography scale and position, etc. Furthermore, finding exhibition presentation methods for more effective communication in information-based exhibitions is needed not only for typography but also for various presentation factors such images, interactive media, etc. in ASI display. As always, continued study is highly recommended on the various presentation methods for effective communication in information-based exhibitions.
Acknowledgments
Many thanks to the teachers, staff and students of Taegang Sahmyook primary school for their assistance and support in carrying out the experiments.
Endnotes
- 1. An object-based exhibition, in this research, is defined as an exhibition oriented by the type of content exhibited, such as relics, paintings, etc. An information-based exhibition is defined as an exhibition oriented toward the presentation of information, such as text, images, etc.
- 2. Exhibition text, in this research, means the content in the form of information or messages, and exhibition typography means the visual aspects of the text. That is, according to the four classifications of exhibition text proposed by Screven (1992), exhibition text is defined as the content, and the structure, presentational format, and context are defined as the exhibition typography.
- 3. The interface, in this research, is defined not as the boundary of hardware and software for the communication between man and computer as it is generally recognized, but as the contact surface at which the two different entities meet from the expanded perspective of cognitive and emotional aspects of the user (Laurel & Mountford, 1990). That is, the interface, in this research, is the visual communication boundary between exhibitor and visitors.
- 4. The term casual visitor as used in this study means those people who move through a gallery quickly and who do not become heavily involved with what they see, according to the definition of Dean (1994).
References
- Ainley, M. (2006). Connecting with learning: Motivation, affect and cognition in interest processes. Educational Psychology Review, 18(4), 391-405.
- Anderson, D., Piscitelli, B., Weier, K., Everett, M., & Tayler, C. (2002). Children’s museum experiences: Identifying powerful mediators of learning. Curator: The Museum Journal, 45(3), 213-231.
- Barriault, C., & Pearson, D. (2010). Assessing exhibits for learning in science centers: A practical tool. Visitor Studies, 13(1), 90-106.
- Bayer, H. (1961). Aspects of design of exhibitions and museums. Curator: The Museum Journal, 4(3), 257-288.
- Bitgood, S. C. (2000). The role of attention in designing effective interpretive labels. Journal of Interpretation Research, 5(2), 31-45.
- Bitgood, S. C., & Patterson, D. D. (1993). The effects of gallery changes on visitor reading and object viewing time. Environment and Behavior, 25(6), 761-781.
- Boisvert, D. L., & Slez, B. J. (1995). The relationship between exhibit characteristics and learning-associated behaviors in a science museum discovery space. Science Education, 79(5), 503-518.
- Borun, M., Chambers, M., & Cleghorn, A. (1996). Families are learning in science museums. Curator: The Museum Journal, 39(2), 123-138.
- Bourdeau, L., & Chebat, J. C. (2003). The effects of signage and location of works of art on recall of titles and paintings in art galleries. Environment and Behavior, 35(2), 203-226.
- Dean, D. (1994). Museum exhibition: Theory and practice. London, UK: Routledge.
- Dernie, D. (2006). Exhibition design. London, UK: Laurence King.
- Dohn, N. B. (2013). Upper secondary students’ situational interest: A case study of the role of a zoo visit in a biology class. International Journal of Science Education, 35(16), 2732-2751.
- Edson, G., & Dean, D. (1994). The handbook for museums. London, UK: Routledge.
- Falk, J. H. (1997). Testing a museum exhibition design assumption: Effect of explicit labeling of exhibit clusters on visitor concept development. Science Education, 81(6), 679-687.
- Falk, J. H., Moussouri, T., & Coulson, D. (1998). The effect of visitors’ agendas on museum learning. Curator: The Museum Journal, 41(2), 107-120.
- Falk, J. H., & Storksdieck, M. (2005). Using the contextual model of learning to understand visitor learning from a science center exhibition. Science Education, 89(5), 744-778.
- Gabrielli, F., Marti, P., & Petroni, L. (1999). The environment as interface. In M. Caenepeel, D. Benyon, & D. Smith (Eds.), Proceedings of the 2nd i3 Annual Conference (pp. 44-47). Siena, Italy: Community of the Future.
- Hawkins, R. P., Pingree, S., Bruce, L., & Tapper, J. (1997). Strategy and style in attention to television. Journal of Broadcasting & Electronic Media, 41(2), 245-264.
- Hawkins, R. P., Pingree, S., Hitchon, J., Radler, B., Gorham, B. W., Kahlor, L., ... & Kolbeins, G. H. (2005). What produces television attention and attention style? Human Communication Research, 31(1), 162-187.
- Hidi, S., & Renninger, K. A. (2006). The four-phase model of interest development. Educational Psychologist, 41(2), 111-127.
- Hooper-Greenhill, E. (2013). Museums and their visitors. London, UK: Routledge.
- Kanel, V., & Tamir, P. (1991). Different labels—Different learnings. Curator: The Museum Journal, 34(1), 18-30.
- Kentley, E. (1989). Writing on the wall: A guide for presenting exhibition text. London, UK: National Maritime Museum.
- Klein, H. J. (1993). Tracking visitor circulation in museum settings. Environment and Behavior, 25(6), 782-800.
- Krapp, A. (2002). Structural and dynamic aspects of interest development: Theoretical considerations from an ontogenetic perspective. Learning and Instruction, 12(4), 383-409.
- Laurel, B., & Mountford, S. J. (1990). The art of human-computer interface design. Boston, MA: Addison-Wesley Longman.
- Lorenc, J., Skolnick, L., & Berger, C. (2007). What is exhibition design? Mies, Switzerland: RotoVision.
- McCullough, M. (2005). Digital ground: Architecture, pervasive computing, and environmental knowing. Cambridge, MA: MIT Press.
- McDaniel, M. A., Waddill, P. J., Finstad, K., & Bourg, T. (2000). The effects of text-based interest on attention and recall. Journal of Educational Psychology, 92(3), 492-502.
- McManus, P. M. (1987). Communication with and between visitors to a science museum (Doctoral dissertation). London, UK: University of London.
- McManus, P. M. (1989). Oh, yes, they do: How museum visitors read labels and interact with exhibit texts. Curator: The Museum Journal, 32(3), 174-189.
- Mitchell, M. (1993). Situational interest: Its multifaceted structure in the secondary school mathematics classroom. Journal of Educational Psychology, 85(3), 424-436.
- Palmquist, S., & Crowley, K. (2007). From teachers to testers: How parents talk to novice and expert children in a natural history museum. Science Education, 91(5), 783-804.
- Piscitelli, B., & Anderson, D. (2001). Young children’s perspectives of museum settings and experiences. Museum Management and Curatorship, 19(3), 269-282.
- Schittich, C. (2009). In detail: Exhibitions and displays: Museum design concepts, brand presentation, trade show design. Basel, Switzerland: Birkhäuser Architecture.
- Screven, C. G. (1974). The measurement and facilitation of learning in the museum environment: An experimental analysis. Washington, DC: Smithsonian Institution Press.
- Screven, C. G. (1992). Motivating visitors to read labels. ILVS Review: A Journal of Visitor Behavior, 2(2), 183-211.
- Serrell, B. (1996). Exhibit labels: An interpretive approach. Altamira, CA: Rowman.
- Serrell, B. (1996). The question of visitor styles. Visitor Studies: Theory, Research, and Practice, 6(1), 48-53.
- Shettel, H. H. (2001). Do we know how to define exhibit effectiveness? Curator: The Museum Journal, 44(4), 327-334.
- Sookhanaphibarn, K., & Thawonmas, R. (2009). A movement data analysis and synthesis tool for museum visitors’ behaviors. In Proceedings of the 10th Pacific Rim Conference on Multimedia: Advances in Multimedia Information Processing (pp. 144-154). Berlin, Germany: Springer.
- Sparacino, F. (2002). The museum wearable: Real-time sensor-driven understanding of visitors’ interests for personalized visually-augmented museum experiences. In J. Teant & D. Brarman (Eds.), Proceedings of the 6th Annual Conference on Museums and the Web. Ontario, Canada: Archives & Museum Informatics.
- Spencer, H. A. (2002). Exhibition text guidelines. In B. Lord & G. D. Lord (Eds.), The manual of museum exhibitions (pp. 398-400). Walnut Creek, CA: Altamira Press.
- Thompson, J. B. (1995). Media and modernity: A social theory of the media. Stanford, CA: Stanford University Press.
- Velarde, G. (2001). Designing exhibitions: Museum, heritage, trade and world fairs (2nd Ed). Burlington, VT: Ashgate.
- Verharr, J., & Meeter, H. (1989). Project model exhibitions. Leiden, the Netherlands: Reinwardt Academie.
- Verón, E., & Levasseur, M. (1989). Ethnographie de l’exposition: L’espace, le corps et le sens. Paris, France: Centre Georges Pompidou, Bibliothèque publique d’information.
- Wolf, L. F., & Smith, J. K. (1993). What makes museum labels legible? Curator: The Museum Journal, 36(2), 95-110.
- Zancanaro, M., Kuflik, T., Boger, Z., Goren-Bar, D., & Goldwasser, D. (2007). Analyzing museum visitors’ behavior patterns. In C. Conati, K. F. McCoy, & G. Paliouras (Eds.), Proceedings of the 11th International Conference on User Modeling (pp. 238-246). Berlin, Germany: Springer.
- Zinkhan, G. M., Locander, W. B., & Leigh, J. H. (1986). Dimensional relationships of aided recall and recognition. Journal of Advertising, 15(1), 38-46.
