
Effects of Visual Expectation on Perceived Tactile Perception: An Evaluation Method of Surface Texture with Expectation Effect
Hideyoshi Yanagisawa 1,* and Kenji Takatsuji 2
1 The University of Tokyo, Tokyo, Japan
2 Olympus Medical Systems, Tokyo, Japan
Human beings predict modal perceptions using a prior modality; for example, they might predict a product’s tactile quality based on its appearance before they have touched it. In this paper, we propose a method for evaluating the quality of surface textures by focusing on the effects of a prior visual prediction on posterior tactual experience, a phenomenon known as the expectation effect. Using a half-mirror apparatus, we synthesized differing combinations of visual and tactile samples. We then compared the expectation effects on perceptual responses to texture samples synthesized using different visual samples. This method was used in an experiment in which participants responded to tactile quality (“nice to touch”) and perceived features (e.g., roughness, hardness, stickiness) of plastic textures under three conditions: visual expectation (V), touch alone (T), and touch following a visual expectation (VT). For the VT condition, participants were asked to evaluate congruent combinations (i.e., identical visual and tactile samples) and incongruent combinations (i.e., tactile samples synthesized with different visual samples). Responses to the tactile samples differed depending on the synthesized visual sample. Comparisons of the responses for V and T conditions revealed expectation effects for contrast and assimilation. It was found that the qualities of both “roughness” and “stickiness” significantly affected tactile quality evaluations. Thus, it is shown that our proposed method can help identify visual-tactile combinations that can improve perceived tactile texture quality.
Keywords – Expectation Effect, Perceived Quality, Surface Texture, Transition of Sensory Modality, Cross-modality, Contrast and Assimilation.
Relevance to Design Practice – The proposed method provides information on ways that the visual appearance of a surface affects its tactile quality. This information can help designers select and create product surface textures with certain combinations of visual and tactile characteristics in order to elicit specific tactile feelings.
Citation: Yanagisawa, H., & Takatsuji, K. (2015). Effects of visual expectation on perceived tactile perception: An evaluation method of surface texture with expectation effect. International Journal of Design, 9(1), 39-51.
Received May 3, 2013; Accepted September 9, 2014; Published April 30, 2014.
Copyright: © 2015 Yanagisawa and Takatsuji. Copyright for this article is retained by the authors, with first publication rights granted to the International Journal of Design. All journal content, except where otherwise noted, is licensed under a Creative Commons Attribution-NonCommercial-NoDerivs 2.5 License. By virtue of their appearance in this open-access journal, articles are free to use, with proper attribution, in educational and other non-commercial settings.
*Corresponding Author: hide@mail.design.t.u-tokyo.ac.jp.
Dr. Hideyoshi Yanagisawa is an associate professor in the Department of Mechanical Engineering at the University of Tokyo. He is one of the leading researchers in the field of Kansei design. His main research interest is a design methodology for product perceived quality. He has developed and refined his methodology for about ten years through applying it to industrial design projects with a broad range of corporate partners. The applications include shape aesthetics, product sound quality, lighting design, textures, and materials. His current scientific interest is to understand a mechanism of expectation effect during multi-sensory interactions, such as vision and touch, between users and products. His current projects involve expectology, long-lasting design, and semiotics in product perceived quality.
Kenji Takatsuji is a design engineer in the R&D division of Olympus Medical Systems Corp. He received his B.Eng. and M.Eng. in mechanical engineering from the University of Tokyo. His research interests are product design, Kansei design, universal design, user interface, and usability. During his academic career, he studied Kansei design methodology and applied it to quantify a perceived quality of a product surface texture. His special interest is cross modal expectation effect on tactile perception of texture. He believes that a good product has good surface texture. Currently, he is working in his company on developing medical devices that have high quality texture.
Introduction
Surface texture is a design factor that consists of physical attributes created by a variety of materials and surface finishes—attributes such as roughness, glossiness, color, and hardness. People perceive and/or predict a surface’s characteristics corresponding to each physical attribute through sensory information, a process that we call perceived features (e.g., surface roughness perceived through touch). Using a combination of perceived characteristics of surface texture, people perceive a tactile quality, such as “nice to touch.”
Directly perceivable surface characteristics differ depending on the kinds of sensory modalities used for perception: for example, people perceive a surface’s color by looking at it or perceive its hardness by touching it. Furthermore, some surface characteristics can be perceived through multiple modalities: for example, we can perceive a surface’s roughness by looking at it as well as by touching it.
In order to design the surface texture of a product, a designer needs to grasp the relationship between the surface’s physical attributes, as design parameters, and the customer’s psychological response to the surface. This response could be described as how the costumer or user perceives the quality of a product’s surface in relation to the particular sensory modality by which the user interacts with the product. Several previous studies have proposed methods to investigate this relationship. A conventional approach has included conducting a sensory evaluation experiment in which participants respond to a set of texture samples, and then the researchers assess the statistical relationships between the physical attributes of the samples and the participants’ sensory responses. Such experiments are often conducted using specific sensory modalities, such as vision, touch, or a combination of both. Indeed, studies have been conducted that explore the differences among sensory modalities in terms of perceptual dimensions and sensitivity (Hollins, Bensma, Karlof, & Young, 2000; Picard, Dacremont, Valentin, & Giboreau, 2003).
On the other hand, in the course of interacting with a product, a user often switches from one sensory modality to another in order to perceive a target texture quality. In this way, we often first see, and then touch, a surface texture. During such sensory modality transitions, we expect or predict the perceptual experience that we might have through a subsequent sensory modality by first using a prior modality, such as in the case of expecting a particular tactile perception by first looking at a surface texture. However, our prior expectations do not always correspond to our subsequent experience. Such disparities between expectation and actual experience can evoke surprise (Ludden, Schifferstein, & Hekkert, 2009), as well as delight, if the experience exceeds expectations, or disappointment if it does not. For example, in the case of surface texture, a photo of a product in an advertisement may suggest a quality better than that of the actual item, leading to disappointment. This disconfirmation of prior expectations is a factor that affects both positive and negative emotions toward a product and its attributes.
On the other hand, prior expectations also affect posterior perceptual experiences—a phenomenon known as the expectation effect. One such case is the size-weight illusion, in which people perceive a smaller object as being heavier than a larger one when the two are actually equal in weight (Flanagan & Beltzner, 2000). People expect the bigger object to be heavier than the smaller one, but when they subsequently hold the objects, they perceive the opposite, even though the weights are the same. In other words, the discrepancy between visual prediction and weight perception works through a contrast effect (Oliver, 1980). With regard to surface texture, however, there have been no studies undertaken or evaluation methods devised for dealing with the expectation effect.
In transitioning from vision to touch, our perceptual mode shifts from expecting a tactile quality by looking at an object (V) to perceiving a tactile quality by touching the object following a visual expectation (VT). Perception of disconfirmation can be defined as the difference between VT and V. In another perceptual mode, we perceive a tactile quality by touching an object with no prior visual expectation (T). In this case, the expectation effect can be defined as the difference between VT and T. We define perceptual incongruence as the difference between V and T based on work conducted by Schifferstein (2001).
In this paper, we propose a new method for evaluating the perceived quality of a surface texture, paying special attention to the expectation effect on tactile perception during a sensory modality transition from vision to touch. Our proposed method quantitatively reveals the particulars of the visual expectation effect on the tactile experience of a texture. The method identifies particular physical attributes of a texture that contribute to the expectation effect. We will demonstrate the appropriateness of the proposed method with an experiment using plastic texture samples that are commonly found in industrial products. In the experiment, we show differences in the effect of visual expectation on tactile perception among different visual stimuli by employing a half-mirror apparatus that allows us to virtually synthesize visual and tactile stimuli.
Sensory Property of Texture
Karana, Hekkert, and Kandachar (2008) conducted interviews and questionnaire surveys with twenty industrial product designers to find out which aspects of materials affected their decisions to use these materials. They found that the designers initially looked for data on the sensorial properties of materials during the materials selection process. The designers noted the importance of the intangible characteristics of materials (ICM), such as perceived value, associated emotions, and meanings. It was found that, although other factors also affect ICM, including associations from past experience and impressions of the material (Nagai & Georgiev, 2011), sensorial properties are fundamental to creating ICM.
Previous research has aimed to identify the various dimensions of perceived quality in order to provide such information on the sensorial properties of materials and surface textures. Hollins et al. (2000) reported on the perceptual dimensions of surface textures of different materials. They used a multi-dimensional analysis to look at participants’ judgments of multiple objects with different surface textures. Their results identified “smooth–rough” and “hard–soft” as the first and second perceptual dimensions. They also observed “sticky–slippery” as a perceptual scale in the third dimension. Picard et al. (2003) have conducted similar studies.
Involvement of Vision and Touch in Multimodal Sensory Perception
A material’s qualities and textures can be perceived through different sensory modalities, and individuals may evaluate such qualities through a combination of different modalities. In multimodal perception, the involvement of each modality is different. Several studies have compared the involvement of vision and touch in multimodal sensory perceptions using different stimuli. In two studies, Wastiels et al. compared warmth perceptions of indoor wall materials under different modality conditions, including vision alone, touch alone, and vision and touch in combination (Wastiels, Schifferstein, Heylighen, & Wouters, 2012b; Wastiels, Schifferstein, Wouters, & Heylighen, 2013). They found that overall warmth perceptions (i.e., for the vision and touch condition) corresponded to visual perceptions, whereas touch tended to be disregarded. They also showed that the color and local surface roughness of building materials influenced the perception of warmth, with color having a larger influence than tactile roughness (Wastiels et al., 2012a). Fenko, Schifferstein and Hekkert (2010) compared the experience of warmth for two products (scarves and breakfast trays) of different colors and materials, and found that both color and material contributed equally to the judgment of warmth for both products. Klatzky, Lederman and Matula (1993) indicated that the complexity of objects being evaluated affects the involvement of each modality. Lederman, Thorne and Jones (1986) noted that the involvement of each modality is represented by a weighted linear combination of spatial density and roughness of texture. Individuals sometimes find it difficult to selectively attend to input from a single sensory modality while simultaneously ignoring task-irrelevant information presented by another sensory modality. Spence and Walton, as well as Guest and Spence, studied the ability of participants to selectively focus their attention on vibrotactile information present in the hand, while simultaneously trying to ignore task-irrelevant visual information. Their experimental results suggested that visual distractors significantly affected the speed and accuracy of tasks using vibrotactile information (Guest & Spence, 2003; Spence & Walton, 2005).
Effect of Expectation in Transition between Different Sensory Modalities
People switch sensory modalities throughout their interactions with a product; they also tend to have expectations of subsequent perceptions through a different modality while perceiving information through a particular modality. Schifferstein and Cleiren (2005) used a split modality approach to assess the extent to which perceiving six different products through one modality predicted expected perceptions in another modality using vision, touch, sound, and smell. Comparing clarity of expectation ratings between source modalities, they found that average ratings based on visual input were highest, followed by tactual, auditory, and olfactory input, although the results depended on the product.
Incongruence between prior expectations and posterior reality may affect perceived quality and cause consumers to feel surprise, satisfaction, delight, or disappointment. Ludden et al. (2009) have examined the effects of visual-tactile incongruity on surprise reactions. They created different kinds of products that were similar in visual appearance, but differed in their tactile characteristics. Experimental results using the products showed that the surprise responses significantly differed based on visual-tactile incongruity. Furthermore, the researchers suggested that the liking of a product that surprises the user may result from the combined effect of, first, a decreased liking due to unfamiliar characteristics and, then, an increased liking due to positive emotions following the surprise—emotions such as fascination and amusement (Ludden, Schifferstein, & Hekkert, 2012). In the field of market research, the effect of expectations on customer satisfaction has been investigated. According to the expectation confirmation theory (Oliver, 1980), customer satisfaction with a product is influenced by the disconfirmation of prior expectations and perceived quality as well as by the quality itself. Research has noted two kinds of expectation effects: assimilation and contrast.
The expectation effect biases the perception of disconfirmation between prior expectations and posterior experience. Two patterns of expectation effect are commonly observed. One is contrast, and the other is assimilation. Contrast is a bias that magnifies the difference between prior expectation and posterior experience. Assimilation is a bias that diminishes expectation incongruence. In other words, the expectation effect may exaggerate or diminish the perception of expectation disconfirmation. Therefore, the expectation effect is a key factor in the design of a visual-tactile incongruity that elicits surprise along with positive or negative emotions.
In food science, Cardello and Sawyer (1992) investigated the effects of visual expectations with regard to food and its actual taste. They reported that assimilation effects emerged in most cases when disconfirmation of expectations occurred.
Yanagisawa and Yuki (2011) investigated the effects of surface characteristics on somatosensory perceptions, such as the feeling of weight when lifting an object. They conducted an experiment using cylinder-shaped objects of identical shape and weight but with different surface characteristics, such as the degree of brightness, roughness, and gloss. Participants’ visual predictions coming from the objects’ surface characteristics affected their grip force and, thus, their weight perception while lifting the objects.
A Method to Identify the Visual Expectation Effect with Regard to Textural Quality
The present study evaluates the visual expectation effect on tactile quality and related physical attributes. To evaluate expectation effect (VT-T), incongruence (V-T) and disconfirmation (VT-V), participants were asked to evaluate the tactile quality of a target object under three perceptual mode conditions (V, VT, and T).
Existing materials are limited with regard to combinations of visual and tactile characteristics. Discovering new combinations of vision and touch with respect to expectation effects provides us with indicators that can be used for creating new materials and surface finishes. With this potential in mind, an experimental apparatus was developed for this study that virtually synthesizes pairs of tactile and visual evaluation samples using a half-mirror, as shown in Figure 1. Using this apparatus, we could synthesize objects made with different surface textures and materials, and then employ a method that enabled us to evaluate many combinations of tactile and visual samples in terms of the expectation effect.
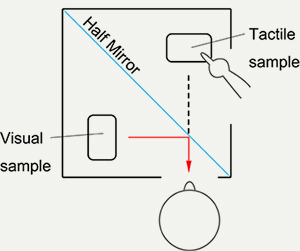
Figure 1. Synthesizing visual and tactile textures using the half-mirror apparatus.
Tactile quality consists of a combination of perceived features. The relationship between total tactile quality (such as “nice touch”) and perceived features may differ from person to person. In contrast, the meaning of a perceived feature, which corresponds to a certain physical feature, should be similar among participants. Therefore, the expectation effect of perceived features related to total tactile quality was evaluated.
Method
The experiment assessed the visual expectation effect, for different visual samples, on the perceived tactile features of surface textures frequently used in product design; this was done using the half-mirror apparatus (Figure 1). Because object shape can affect visual expectation and tactile perception, shape was controlled by using the same type of flat plate for all conditions. In this way, we were able to focus on extracting the visual expectation effect on tactile perception.
Evaluation criteria for total tactile quality ranged from “nice to touch” to “unpleasant to touch.” The selected perceived features relating to tactile quality were smoothness (roughness), hardness (softness), and stickiness, based on the results of a preliminary examination and on the three evaluation factors for texture proposed by Hollins et al. (2000).
We compared participants’ responses to perceived features, under the VT condition, between different visual samples synthesized with the same tactile sample. The differences in responses between the V and T conditions were used to explore the causes of the visual expectation effects for the VT condition. We also assessed the effects of perceived features on overall tactile quality to determine the nature of expectation effects on tactile quality.
Participants
Experiment evaluators were ten male volunteers (aged 21 to 24) who were undergraduate or graduate students studying mechanical engineering at the University of Tokyo.
Stimuli
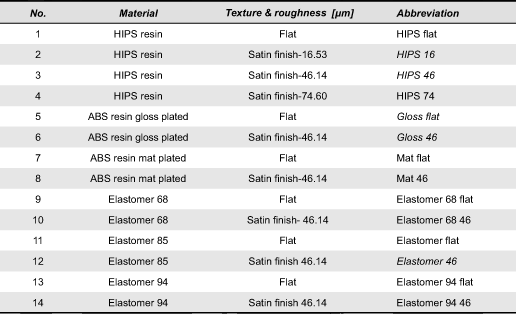
The evaluation samples were fourteen plastic plates (58 × 40 × 2 mm) with different surface textures, provided by the Japan Industrial Designers Association as samples of materials often used in product design. Figure 2 shows photos of the surface finish of the plates, and Table 1 shows the characteristics of the evaluation samples. These included high impact polystyrene (HIPS) and acrylonitrile butadiene styrene resin (ABS), which are both hard and solid, and elastomer, which is elastic and deformable. “Gloss” represents the plated surface. The numerical value next to “satin finish” in Table 1 denotes the average depth of the satin finish. The numerical value next to “elastomer” in Table 1 denotes the shore hardness of the elastomer. In the evaluation trial using the VT condition, five samples were selected with different levels of roughness, hardness, and gloss: HIPS 16 (no. 2), HIPS 46 (No. 3), Gloss flat (No. 5), Gloss 46 (No. 6), and Elastomer 46 (No. 12). These samples were used to verify whether the visual expectation effects and the related surface attributes could be identified using the proposed method.
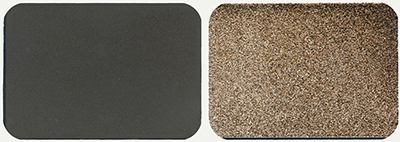
Figure 2. HIPS resin Satin finish 16.53 and ABS resin Satin finish 46.14 used as evaluation samples.
Table 1. Sample characteristics. Italic abbreviations denote samples for VT. All samples used for V and T.
For the VT condition, a combination of two samples—one for vision and another for tactile quality—were placed into the apparatus as shown in Figure 3. Inside the apparatus, a half-mirror plate was placed at 45 degrees, separating the box interior into two spaces. In one space, a visual sample was placed, and in the other space, a tactile sample was placed. Both samples were placed horizontally. Each space had a window, one for looking at the sample and one for touching it, and independent LED lights installed from above (Lighting #1 for the left space and Lighting #2 for the right space, as shown in Figure 3). We used a modulated light for both light sources so that we could adjust luminance using volume controls. By visually adjusting the luminance of the lights so that the left space, for the visual sample, was brighter than the right space, for the tactile sample, an observer could see the visual sample in the left space, and only a fuzzy finger and hand in the right space. The lighting for the left visual space was set so that the incidence angle to each visual sample was 15 degrees, and the reflection angle from the sample to the observer was approximately 60 degrees. We visually adjusted the luminance of the LED lights so that the appearance of the sample reflected by the half mirror was identical to the appearance of the same physical sample presented without the half-mirror. We confirmed that the tactile feeling of the samples synthesized with the consistent visual samples was almost the same as the tactile feeling of the actual physical samples.
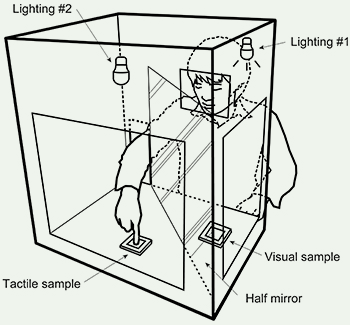
Figure 3. Schematic description of the evaluation apparatus.
For the V condition, a visual sample was placed in the left visual space of the apparatus. For the T condition, a tactile sample was placed in the right tactile space of the apparatus.
Procedure
Participants were invited to an isolated test room individually. Each participant was seated on a chair in front of the apparatus, which was placed on a table, as shown in Figure 3. After obtaining informed consent, each participant received written instructions for the procedure. The experiment consisted of three sets of evaluation trials. In the first set, conducted under the T condition, an evaluation sample—randomly selected among the 18 samples—was presented. Participants were asked to touch the sample using their right index finger and to evaluate the tactile feeling using four opposite adjective pairs (“nice to touch–unpleasant to touch,” “smooth–rough,” “hard–soft” and “sticky–slippery”). Between each adjective pair was a scale comprised of five ranks. Participants responded to each adjective scale by marking the rating on a questionnaire sheet. The questionnaire employed a semantic differential (SD) scale. Subjects evaluated all 18 samples using the same procedure.
The second set of evaluations was conducted under the V condition. The view window of the apparatus was covered with a black cloth, and a sample, randomly selected from the 18 samples, was placed in the left visual space. The black cloth was then lifted, and the participant was asked to evaluate his expectation of tactile quality without touch, using the same adjective scales that were employed under the T condition. Participants evaluated all 18 samples using the same procedure.
The third set of evaluations was conducted under the VT condition. Two duplicate sets of five samples with different levels of roughness, hardness, and gloss were selected: samples No. 2, 3, 5, 6, and 12. All combinations of the five samples were synthesized, so that the total number of combinations was 52 = 25. A combination of two samples from the sample sets was randomly selected and placed in the apparatus. Participants were asked to predict tactile quality and its perceived features for each visually presented sample, which was presented for viewing for several seconds in the left space. Participants then touched a tactile sample presented in the right space. Participants evaluated all combinations of the visual and tactile samples, and the same evaluation criteria were used in all sets of the experiment. Participants took a short break between each set of evaluation trials.
Data Analysis
We compared responses to the three perceived features (“smooth–rough,” “hard–soft,” and “sticky–slippery”) under the VT condition between visual samples synthesized with each tactile sample. A two-way repeated measures ANOVA was conducted with Visual sample and Tactile sample in the VT condition as independent variables to investigate the effects of visual expectation on responses to perceived tactile features. A significant effect of Visual sample or an interaction between Visual sample and Tactile sample would suggest that the perceived tactile feature varied depending on the synthesized visual sample. Paired comparisons were used to compare visual expectation effects of perceived features between visual samples. Significant differences between congruent combinations, in which the visual and tactile samples were identical, and incongruent combinations, in which the tactile sample was synthesized with a different visual sample, suggest that the visual sample in the incongruent combination modulated responses to the perceived feature.
We compared responses to each of the three perceived features for each sample under the V and T conditions. A two-way repeated measures ANOVA was conducted with Sample and Condition (V and T) as factors. A significant effect of Condition or an interaction between Sample and Condition would suggest that the perceived feature differs between modality conditions.
To analyze the effects of expectation for each perceived feature on tactile quality, we performed a multivariate regression analysis using responses to the three perceived features as explanatory variables and “nice to touch/unpleasant to touch” responses as the dependent variable.
Effect of Visual Expectation on Perceived Tactile Features
Figure 4 shows average “smooth–rough” responses for each synthesized combination under the VT condition. Positive values indicate that participants judged the texture as smooth, and negative values indicate that participants judged the texture as rough. Each line denotes responses for the same tactile sample synthesized with different visual samples. Differences in scores between synthesized visual samples for each tactile sample represent differences in expectation effects depending on the synthesized visual sample. For example, participants perceived tactile sample Gloss 46 (x plots in Figure 4) as slightly smooth when paired with visual sample HIPS 46, whereas they perceived it as slightly rough when paired visual sample Gloss flat. As another example, the average scores for tactile samples HIPS 46 and Elastomer 46 were almost identical when they were synthesized with visual samples HIPS 16 and Elastomer 46, but differed when the synthesized visual samples were HIPS 46, Gloss flat, and Gloss 46.
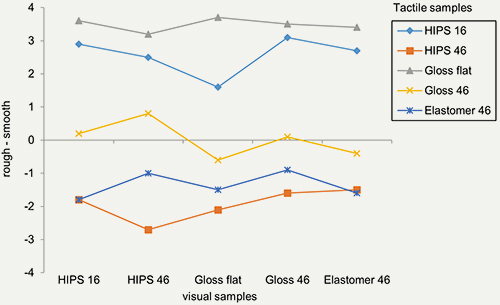
Figure 4. Average “smooth–rough” responses for each visual sample synthesized with each tactile sample (lines) in VT.
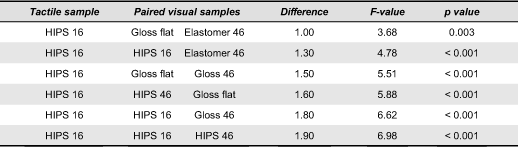
To quantify these differences, we conducted a two-way repeated measures ANOVA with Visual sample and Tactile sample as independent variables and “rough-smooth” scores in the VT condition as the dependent variable. We observed a significant interaction between Visual sample and Tactile sample [F(16, 2.37) = 1.69, p = .05] and a significant main effect of Tactile sample [F(4, 284.4) = 37.1, p < .001]. The main effect of Visual sample was not significant [F(4, 2.49) = 1.98, p = .12]. We tested simple effects of Visual sample for each tactile sample. We found significant simple effects of Visual sample for tactile samples HIPS 16 [F(4, 3.38) = 2.77, p = .029] and Gloss 46 [F(4, 3.02) = 2.47, p = .046]. To test the differences between visual samples for tactile samples HIPS 16 and Gloss 46, we conducted Bonferroni-corrected paired comparisons. Table 2 shows the pairs of visual samples with the significant differences. We found statistically significant differences between congruent and incongruent combinations (i.e., differences between visual samples HIPS 16 and Gloss flat for tactile sample HIPS 16, and between Gloss 46 and Gloss flat for tactile sample Gloss 46). For tactile sample Gloss 46, we found statistically significant differences between combinations of positive (“smooth”) and negative (“rough”) scores (i.e., differences between visual samples HIPS 46 and Gloss flat). For tactile samples HIPS 16 and Gloss 46, visual sample Gloss flat made the tactile perception rougher than in the congruent combination.
Table 2. Results of paired comparisons of “smooth–rough” responses between visual samples for each tactile sample.
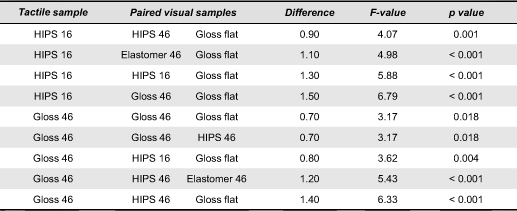
Figure 5 shows average “hard–soft” responses for each synthesized combination in the VT condition. Positive values indicate that participants judged the sample as hard, and negative values indicate that participants judged the sample as soft. Elastomer 46 is elastic and deformable, while HIPS, ABS, and Gloss are solid and made of hard plastic. The average score for the congruent combination for Elastomer 46 shows that participants perceived the sample as hard. By contrast, for the incongruent combination in which a different visual sample was synthesized with Elastomer 46, participants perceived the sample as soft.
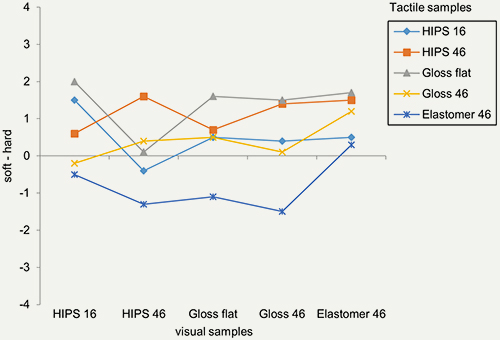
Figure 5. Average “hard–soft” responses for each visual sample synthesized with each tactile sample (lines) in VT.
We conducted a two-way repeated measures ANOVA with Visual sample and Tactile sample as independent variables and “hard–soft” scores in the VT condition as the dependent variable. We observed significant main effects of Visual sample [F(4, 6.44) = 3.61, p = .014] and Tactile sample [F(4, 36.7) = 3.81, p = .011]. The interaction between Visual sample and Tactile sample was not significant [F(16, 3.47) = 1.48, p = .11]. There was a marginally significant simple effect of Visual sample for tactile sample Elastomer 46 [F(4, 5.32) = 2.38, p = .053]. We conducted Bonferroni-corrected paired comparisons to compare the average scores between synthesized visual samples for tactile sample Elastomer 46. Table 3 shows the pairs of visual samples with the significant differences for Elastomer 46. Average “soft–hard” scores were significantly different between the congruent and incongruent combinations in which Elastomer 46 was synthesized with visual samples HIPS 46, Gloss flat, and Gloss 46. In other words, the incongruent visual information made participants perceive Elastomer 46 as softer.
Table 3. Results of paired comparisons of “hard–soft” responses between visual samples for each tactile sample.
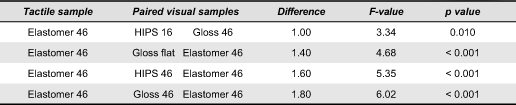
Figure 6 shows the average “sticky–slippery” responses for each synthesized combination in the VT condition. Positive values indicate that participants judged the sample as sticky, and negative values indicate that participants judged the sample as slippery. Overall, participants characterized tactile samples Gloss flat and Elastomer 46 as sticky, and rough and hard surfaces such as HIPS 46 and Gloss 46 as slippery. Responses to tactile sample HIPS 16 changed depending on the synthesized visual sample.
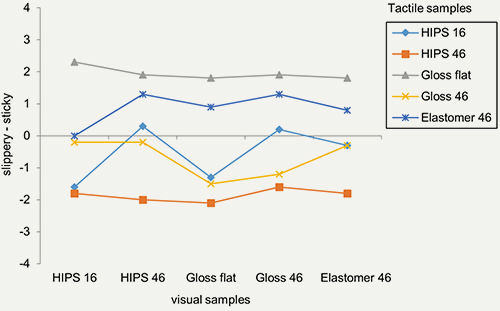
Figure 6. Average “sticky–slippery” responses for each visual sample synthesized with each tactile sample (lines) in VT.
We conducted a two-way repeated measure ANOVA with Visual sample and Tactile sample as independent variables and “slippery-sticky” scores in the VT condition as the dependent variable. We observed a significant main effect of Tactile sample [F(4, 108.8) = 8.02, p = .001]. The main effect of Visual sample [F(4, 4.1) = 2.05, p = 0.10] and the interaction between Visual sample and Tactile sample [F(16, 2.73) = 1.51, p = .10] were marginally significant. There was a significant simple effect of Visual sample for the tactile sample HIPS 16 [F(4, 7.53) = 4.07, p = .0035]. We compared the average scores between visual samples for tactile sample HIPS 16 using Bonferroni-corrected paired comparisons. Table 4 shows the pairs of visual samples with the significant differences. We found significant differences between the congruent and incongruent combinations, in which HIPS 16 was synthesized with visual samples Elastomer 46, Gloss 46, and HIPS 46. These visual samples tended to moderate the perception of slipperiness compared to the original congruent combination.
Table 4. Results of paired comparisons of “sticky–slippery” responses between visual samples for each tactile sample.
Perceived Features in the V and T Conditions
Figure 7 shows average “smooth–rough” responses for each sample evaluated in the V and T conditions. Samples are sorted by average responses in the V condition. Participants judged hard plastic plates, such as Mat 46, HIPS 74, Gloss 46, and HIPS 46, as rough. They judged elastomers with rough surfaces (Ra 46) as smooth in the V condition. However, in the T condition, they judged elastomers with rough surfaces as rough, and hard plastic plates with Ra 46 roughness as soft. Participants judged all flat surfaces and HIPS 16 as smooth in both V and T conditions.
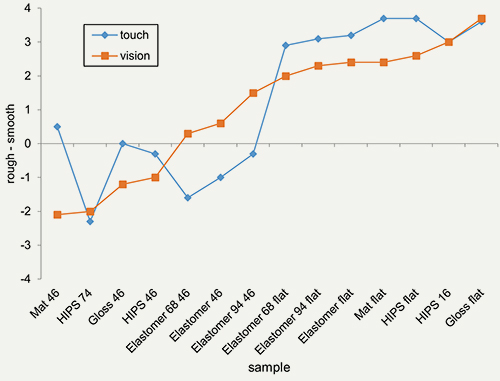
Figure 7. Average “smooth–rough” responses for each sample evaluated in V and T conditions.
We conducted a two-way repeated measures ANOVA on “smooth–rough” responses with Sample and Condition (V and T) as independent variables. We observed a significant main effect of Sample [F(13, 77.6) = 33.3, p < .001] and a significant interaction between Sample and Condition [F(13, 8.54) = 4.27, p < .001]. There were significant simple effects of Condition for Mat 46 [F(1, 33.8) = 15.7, p < .001], Elastomer 68 46 [F(1, 18.1) = 8.38, p = .005], Elastomer 46 [F(1, 12.8) = 5.93, p = .016], and Elastomer 94 46 [F(1, 16.2) = 7.52, p = .007].
Figure 8 shows average “hard–soft” responses for each sample evaluated in the V and T conditions. In the V condition, participants judged all elastomers as soft and tended to judge Gloss and Mat surfaces as harder than solid surfaces of hard plastics. In the T condition, they judged elastomers with flat surfaces to be slightly hard, except elastomer 46, which was the experiment’s softest material in terms of physical property.
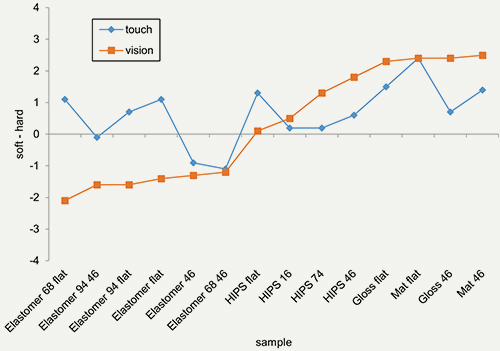
Figure 8. Average “hard–soft” responses for each sample evaluated in V and T conditions.
We conducted a two-way repeated measures ANOVA on “hard–soft” responses with Sample and Condition as independent variables. There was a significant main effect of Sample [F(13, 28.9) = 7.76, p < .001] and a significant interaction between Sample and Condition [F(13, 12.01) = 5.29, p < .001]. We observed significant simple effects of Condition for Elastomer 68 flat [F(1, 51.2) = 19.3, p < .001], Elastomer 94 46 [F(1, 11.3) = 4.25, p = .042], Elastomer 94 flat [F(1, 26.5) = 9.99, p = .002], Elastomer flat [F(1, 31.3) = 11.8, p < .001], and Gloss 46 [F(1, 14.5) = 5.46, p = .021].
Figure 9 shows the average “sticky–slippery” responses for each sample evaluated in the V and T conditions. In the V condition, participants tended to judge elastomers as sticky. In the T condition, they judged elastomer 94 46, which is the hardest elastomer in the experiment, as slippery. They judged Gloss flat as sticky, whereas the average responses were close to neutral in the V condition.
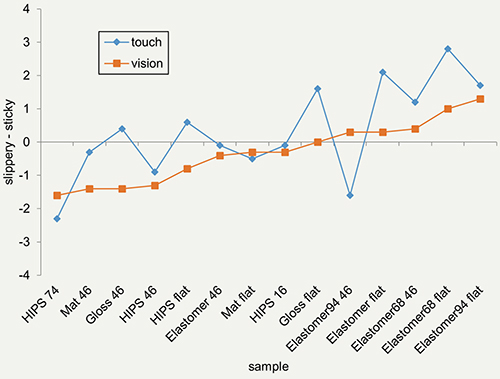
Figure 9. Average “sticky–slippery” responses for each sample evaluated in V and T conditions.
We conducted a two-way repeated measures ANOVA on “sticky–slippery” responses with Sample and Condition as independent variables. There was a significant main effect of Sample [F(13, 23.5) = 4.69, p < .001] and a significant interaction between Sample and Condition [F(13, 5.83) = 1.92, p = .034]. There were significant simple effects of Condition for Gloss 46 [F(1, 16.2) = 5.07, p = .026], Gloss flat [F(1, 12.8) = 4.0, p = .048], Elastomer flat [F(1, 16.2) = 5.07, p = .026], and Elastomer 68 flat [F(1, 16.2) = 5.07, p = .026].
Relationships between Perceived Features and Total Tactile Quality
Figure 10 shows average responses regarding tactile quality (“nice to touch/unpleasant to touch”), indicated as bar plots, and the three perceived features, indicated as line plots, for each combination of visual and tactile samples synthesized in the VT condition. The combinations are sorted by average “nice to touch/unpleasant to touch” responses. Combinations with positive responses to tactile quality (i.e., nice to touch), such as combinations with tactile sample HIPS 16, tended to be perceived as smooth, and neither sticky nor slippery. In contrast, combinations rated as having a negative tactile quality (i.e., “unpleasant to touch”), such as combinations with tactile sample Elastomer 46, tended to be perceived as rough and not slippery. Samples for which tactile quality was rated close to neutral, such as combinations with tactile sample Gloss flat, were perceived as smooth and sticky. There were no relationships between “hard–soft” ratings and tactile quality.
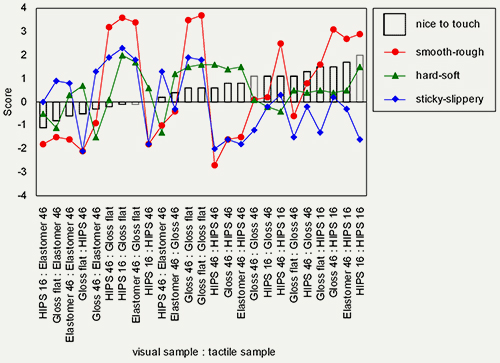
Figure 10. Average responses to perceived features and tactile quality in the VT condition.
Based on Figure 10, we hypothesized that the perceptions of “smooth–rough” and “sticky–slippery” positively and negatively affected tactile quality, respectively. To test this hypothesis, a multivariate regression analysis was conducted with responses to the three perceived features as explanatory variables and “nice to touch/unpleasant to touch” responses as the dependent variable. The regression was significant (R = 0.84, R2 = 0.7). The partial regression coefficients were significant for “smooth–rough” [partial regression coefficient = 0.37, standard partial regression coefficient = 0.99, F = 35.9, t = 5.99, p < .001] and “sticky–slippery” [partial regression coefficient = -0.55, standard partial regression coefficient = -0.95, F = 35.96, t =-5.99, p < .001]. Thus, the statistical analysis supported this hypothesis.
Discussion
From the analysis of participants’ responses to perceived features in the VT condition, we determined the tactile samples for which the simple effects of Visual sample were significant. For such tactile samples, the participants’ responses differed depending on the visual sample synthesized with the tactile sample using the half-mirror apparatus. For example, participants’ responses regarding tactile roughness for HIPS 16 and Gloss 46 varied depending on the synthesized visual sample (Figure 4). This suggests that there is a visual expectation effect on tactile perception, and this expectation effect differs depending on the visual information being used as the cue prior to touch.
The results of paired comparisons between visual samples synthesized with the same tactile sample showed significant differences in participants’ responses between the congruent combinations, in which visual and tactile samples were identical, and incongruent combinations, in which visual and tactile samples differed, for all three perceived features. Thus, by using the proposed method, we found visual information that changed tactile perception. For example, the visual information from Gloss flat diminishes the perceived smoothness of both HIPS 16 and Gloss 46 (Fig. 4 and Table 2).
In the analysis of participants’ responses to perceived tactile features in the V and T conditions, we observed a significant main effect of Sample and a significant interaction between Sample and Condition (V and T). We found samples in which participants’ responses significantly differed between the V and T conditions. For example, participants visually predicted that elastomers were softer than the actual tactile perception in the T condition. Such differences in congruent combinations in the VT condition create an incongruence between visual prediction and tactile perception.
Using information from such incongruences, we can identify the type of expectation effect (i.e., the contrast and assimilation discussed in the previous section of this paper on “Effect of Expectation in Transition between Different Sensory Modalities”). To determine the types of expectation effect, we created graphs of expectation effect (VT-T) as a function of expectation incongruence (V-T) by referring to Fig 5.3 in Schifferstein’s earlier paper (2001). Figure 11 shows the graph for “smooth–rough” responses. Each plot denotes visual and tactile combinations (visual : tactile) in the VT condition. For the horizontal axis, positive values represent responses in V being smoother than responses in T, whereas negative values represent responses in V being rougher than responses in T. For the vertical axis, the positive value represents responses in VT being smoother than responses in T, whereas the negative value represents responses in VT being rougher than responses in T.
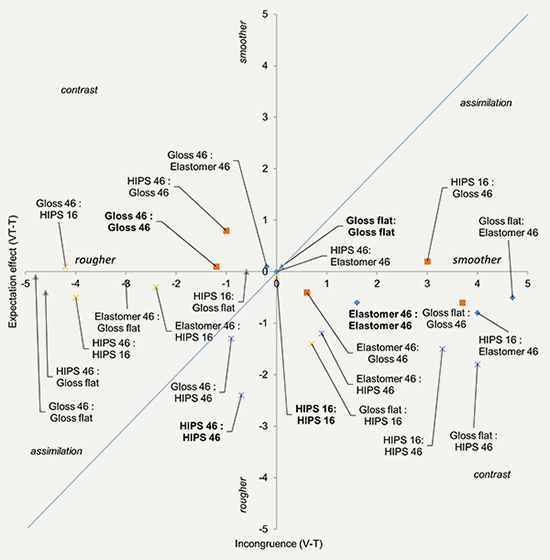
Figure 11. Expectation effect as function of expectation incongruence for “smooth–rough” response of each visual:tactile combination.
Plots around the diagonal line, where the expectation effect and incongruence are identical, may represent combinations involving assimilation effect. By contrast, plots in the second and the fourth quadrants may represent the combinations involving contrast effects. For example, most of the combinations with a visual sample Gloss flat occur in the second quadrant. In such combinations, the visual expectation (V) was smoother than the tactile perception in T, and the tactile perception in VT shifted towards a rougher sensation from tactile perception in T. As shown in Figure 7, participants perceived Gloss flat as smooth in both V and T conditions. Thus, the incongruences between such smooth visual surfaces and the relatively rough tactile stimuli may have been magnified due to contrast effect. Another example is the combination HIPS 16 : HIPS 46. Roughness is the only physical property difference between HIPS 16 and HIPS 46. This combination may have caused a contrast effect, with the visual and tactile incongruence being magnified. On the other hand, we found a congruent combination HIPS 46 : HIPS 46 with a high expectation effect value in the third quadrant. The degree of the expectation effect is more than the degree of expectation incongruence (|VT-T| > |V-T|). This is unlikely to be an instance of the assimilation effect because assimilation is a bias that diminishes expectation incongruence. The participants rated HIPS 46 as the roughest surface in both V and T (Figure 7). Thus, the visual and tactile combination may synergistically increase the perceived roughness.
Figure 12 shows the expectation effect of each combination in the VT condition as a function of expectation incongruence for “sticky–slippery” responses. In the third quadrant, visual samples HIPS 16, HIPS46, and Elastomer 46, with tactile sample Gloss 46, showed assimilation effects. Gloss 46 was slightly sticky in the T condition. With these visual samples, the tactile perception of Gloss 46 shifted more towards slippery. The congruent combination “Gloss 46: Gloss 46” shows the largest expectation effect as assimilation in all combinations with tactile sample Gloss 46. This result suggests that the physical congruency between vision and touch does not guarantee perceptual congruence, and that perceptual congruence may cause the expectation effect.
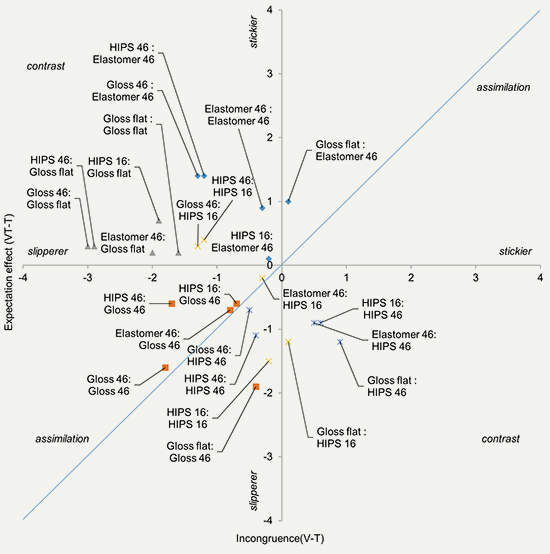
Figure 12. Expectation effect as function of expectation incongruence for “sticky–slippery” response of each visual:tactile combination.
The results of the multivariate regression analysis showed that smoothness and slipperiness significantly affected overall tactile quality (“nice to touch”). We determined combinations of visual and tactile samples that caused expectation effects related to smoothness and slipperiness. Thus, we can use expectation effects to increase the perception of tactile quality (e.g., visual sample HIPS46 increased “nice to touch” responses to Gloss 46 by increasing the perception of smoothness).
Existing materials have limitations with respect to combinations of appearance and touch. Creating new materials that have new combinations of appearance and touch takes both time and funding, and is therefore restricted by available production technology. Based on the experimental results using the proposed evaluation method, a designer can easily test and explore combinations of appearance and tactile characteristics using existing materials.
In the earlier stage of design, designers define a design concept and draw sketches. Since sketches tend to express largely visual information, designers may focus on visual characteristics of texture. They then select materials and surface finishes that satisfy the required visual characteristics. However, the tactile quality of selected materials and surface finishes may not fit the design concept. Designers can subsequently select the surface texture that best satisfies the tactile quality using existing materials, and they can synthesize combinations of selected visual and tactile samples using the half-mirror apparatus developed in the present study. By collecting responses to existing materials in T, V, and VT conditions in advance, designers can easily find the tactile samples that satisfy a target tactile quality using visualized results—such as found in Figures 4, 7, and 11—with the expectation effect in mind.
We should note that, as this experiment used plastic plates of all the same shape for each of the different surface textures, shape differences might affect the characteristics of expectation effects. Further studies using different shapes are necessary, but we believe that the proposed evaluation method is applicable to different shapes. However, the method is limited in that the shape of the visual and tactile samples must be identical, and the positions of both samples must be synchronized. Another approach will need to be considered for tactile manipulations involving large deformations and position changes.
Conclusion
We have proposed a method to assess the effects of visual expectation on tactile perception of texture surface using a half-mirror apparatus that virtually synthesizes visual and tactile stimuli. By applying this method to plastic textured plates, we demonstrated that different visual stimuli altered participants’ responses to tactile samples in terms of perceived tactile features such as roughness, hardness, and stickiness. We found synthesized combinations of visual and tactile stimuli that create different perceived qualities to that of the original samples. Comparing responses between V and T conditions helped determine the type of expectation effect at work (e.g., contrast effect). Perceived features of tactile quality produced meaningful expectation effects on tactile quality.
We believe that this method can help designers explore and plan visual-tactile combinations that involve expectation effects when selecting materials and creating new textures. Although this experiment used plates of the same shape for each of the different surface textures, we believe the method can be applied to objects with different shapes.
This method enables designers to concentrate on either the visual or the tactile characteristics of the object, and to test characteristic combinations. This allows designers to try new combinations of visual and tactile properties that current production technology cannot realize, but that may be possible with future technology.
Acknowledgments
This work was supported by KAKEN (No. 23760127), the Design Innovation (DI) Lab at the University of Tokyo and its corporate partners. We would like to thank to Mr. Satoshi Nakagawa, project professor of DI and CEO of Tripod Design Co. Ltd. for giving us helpful advice from a designer’s point of view. We would like to thank Dr. Tamotsu Murakami, professor at UT, and Dr. Kazutaka Ueda, project lecturer at UT, for supporting this project.
References
- Cardello, A. V., & Sawyer, F. M. (1992). Effects of disconfirmed consumer expectations on food acceptability. Journal of Sensory Studies, 7(4), 253-277.
- Fenko, A., Schifferstein, H. N. J., & Hekkert, P. (2010). Looking hot or feeling hot: What determines the product experience of warmth? Materials & Design, 31(3), 1325-1331.
- Flanagan, J. R., & Beltzner, M. A. (2000). Independence of perceptual and sensorimotor predictions in the size-weight illusion. Nature Neuroscience, 3(7), 737-741.
- Guest, S., & Spence, C. (2003). What role does multisensory integration play in the visuotactile perception of texture? International Journal of Psychophysiology, 50(1-2), 63-80.
- Hollins, M., Bensma S., Karlof, K., & Young, F. (2000). Individual differences in perceptual space for tactile textures: Evidence from multidimensional scaling. Attention, Perception, & Psychophysics, 62(8), 1534-1544.
- Karana, E., Hekkert, P., & Kandachar, P. (2008). Material considerations in product design: A survey on crucial material aspects used by product designers. Materials & Design, 29(6), 1081-1089.
- Klatzky, R. L., Lederman, S. J., & Matula, D. E. (1993). Haptic exploration in the presence of vision. Journal of Experimental Psychology: Human Perception and Performance, 19(4), 726-743.
- Lederman, S. J., Thorne, G., & Jones, B. (1986). Perception of texture by vision and touch: Multidimensionality and intersensory integration. Journal of Experimental Psychology: Human Perception and Performance, 12(2), 169-180.
- Ludden, G., Schifferstein, H., & Hekkert, P. (2009). Visual-tactual incongruities in products as sources of surprise. Empirical Studies of the Arts, 27(1), 61-87.
- Ludden, G., Schifferstein, H., & Hekkert, P. (2012). Beyond surprise: A longitudinal study on the experience of visual-tactual incongruities in products. International Journal of Design, 6(1), 1-10.
- Nagai, Y., & Georgiev, G. V. (2011). The role of impressions on users’ tactile interaction with product materials: An analysis of associative concept networks. Materials & Design, 32(1), 291-302.
- Oliver, R. (1980). A cognitive model of the antecedents and consequences of satisfaction decisions. Journal of Marketing Research, 62(4), 480-486.
- Picard, D., Dacremont, C., Valentin, D., & Giboreau, A. (2003). Perceptual dimensions of tactile textures. Acta Psychologica, 114(2), 165-184.
- Schifferstein, H. N. J., & Cleiren, M. P. H. D. (2005). Capturing product experiences: A split-modality approach. Acta Psychologica, 118(3), 293-318.
- Schifferstein, H. N. J. (2001). Effects of product beliefs on product perception and liking. In L. Frewer, E. Risvik, & H. Schifferstein, (Eds.), Food, people and society. An European perspective of consumers’ food choices (pp. 73-96). London, UK: Springer Verlag.
- Spence, C., & Walton, M. (2005). On the inability to ignore touch when responding to vision in the crossmodal congruency task. Acta Psychologica, 118(1), 47-70.
- Wastiels, L., Schifferstein, H. N. J., Heylighen, A., & Wouters, I. (2012a). Red or rough, what makes materials warmer? Materials & Design, 42, 441-449.
- Wastiels, L., Schifferstein, H. N. J., Heylighen, A., & Wouters, I. (2012b). Relating material experience to technical parameters: A case study on visual and tactile warmth perception of indoor wall materials. Building and Environment, 49, 359-367.
- Wastiels, L., Schifferstein, H. N. J., Wouters, I., & Heylighen, A. (2013). Touching materials visually: About the dominance of vision in building material assessment. International Journal of Design, 7(2), 31-41.
- Yanagisawa, H., & Yuki, N. (2011). Deviation of visual expectation from somatosensory experience in emotional quality (Effects of surface characteristic in context of “lifting object”). In Proceedings of ASME International Design Engineering Technical Conferences & Computers and Information in Engineering Conference (pp. 825-832). Washington, DC: American Society of Mechanical Engineers. doi:http://dx.doi.org/10.1115/DETC2011-47568
