
An Application of Implementing a Cognitive Structure Model to Obtain Consensus from Consumers
Ming-Hsuan Hsieh 1, Cheng-Yong Huang 2,* , Ding-Bang Luh 3, Shuo-Fang Liu 3, and Chia-Hsiang Ma 3
Department of Industrial Engineering and Management, Overseas Chinese University, Taichung, Taiwan
Department of Arts and Design, National Dong Hwa University, Hualien County, Taiwan
Department of Industrial Design, National Cheng Kung University, Tainan, Taiwan
Consumer-oriented design has become a key element in a successful product development process. However, since consumers have constantly changing needs, their cognition toward a product is abstract and unclear, and designers do not have a method to effectively incorporate consumers’ opinions during the design process. Designers and consumers have cognitive differences when it comes to the ‘meaning’ of a product. The main purpose of this study is to develop a cognitive structure model in order to understand the differences and similarities between designers and consumers’ cognitions, and furthermore to help designers obtain consensus with consumers on the meaning of a product. The first step in the procedure is to use mind mapping to present designers’ cognition, and then an implication matrix to conduct research on consumers’ cognition. Four areas (positive consensus, negative consensus, designer’s subjectivity, and consumers’ subjectivity) are defined based on the cognitive similarities and differences of designers and consumers. Finally, a streamlined hierarchical value map is used to present design guidelines. Through the case study on “beach toys design” and its process of developing design guidelines, it is proved that this cognitive structure model is operational and practical. Consequently, this model effectively enables designers and consumers to reach a common ground on product cognitions.
Keywords – Consumer-oriented, Product Meaning, Cognitive Similarities and Differences, Cognitive Consensus, Design Guidelines.
Relevance to Design Practice – The focus of this structure model is on the product idea generation stage in the hope that it can provide the industry with a technique that can accurately uncover the cognitive consensus between designers and consumers, and effectively develop product design guidelines.
Citation: Hsieh, M.–H., Huang, C.–Y., Luh, D.–B., Liu, S.–F., & Ma, C.–H. (2013). An application of implementing a cognitive structure model to obtain consensus from consumers. International Journal of Design, 7(2), 53-65.
Received May 16, 2012; Accepted April 28, 2013; Published August 31, 2013.
Copyright: © 2013 Hsieh, Huang, Luh, Liu, & Ma. Copyright for this article is retained by the authors, with first publication rights granted to the International Journal of Design. All journal content, except where otherwise noted, is licensed under a Creative Commons Attribution-NonCommercial-NoDerivs 2.5 License. By virtue of their appearance in this open-access journal, articles are free to use, with proper attribution, in educational and other non-commercial settings.
*Corresponding Author: yong@mail.ndhu.edu.tw
Ming-Hsuan Hsieh received his Ph.D. in industrial design from National Cheng Kung University, Taiwan. He is currently an assistant professor in the Department of Industrial Engineering and Management at Overseas Chinese University, Taichung, Taiwan. His research interests include consumer research, system design methodology, industrial design, and marketing management.
Cheng-Yong Huang received his Ph.D. in industrial design from National Cheng Kung University, Taiwan. He is currently an assistant professor in Department of Arts and Design at National Dong Hwa University (Hualien, Taiwan, R.O.C.). His research interests are focused on human-computer interface, industrial design, and design management.
Ding-Bang Luh received his Ph.D. in design from Illinois Institute of Technology, USA. He is currently a full professor in Department of Industrial Design at National Cheng Kung University, Tainan, Taiwan. His research interests include design management, creative education, service innovation, and cultural and creative industries.
Shuo-Fang Liu received his B.S. and the M.S.E. degrees from the Department of Industrial Design at the National Cheng-Kung University, Tainan, Taiwan, R.O.C., in 1986 and 1993, respectively, and his Ph.D. degree from the Department of Electrical Engineering at the National Central University, Chung-Li, Taiwan, in 2002. He is now an associate professor in the Department of Industrial Design at the National Cheng-Kung University. His current research activities include QFD and product design development, human/computer interface, augmented reality, and Multimedia applications.
Chia-Hsiang Ma received his M.S. in industrial design from University of Essen, Germany. He is currently an adjunct associate professor in the Department of Industrial Design, National Cheng Kung University (Tainan, Taiwan, R.O.C.). His research interests include industrial design, product design, system design methodology, and human-computer interface.
Introduction
In order to satisfy consumers’ needs, many product manufacturers adopt consumer-oriented design guidelines. Kramer (2003) has proved that, assuming all other variables remain constant, products co-produced with participating consumers will better meet consumers’ preferences. However, the majority of consumers lack the capability to clearly and comprehensively describe their needs; this leads to the fact that designers cannot truly understand consumers’ preferences (Chang, Lai, & Chang, 2006). Ulwick (2002) believes that it is no use asking consumers about their needs; they only know what they have experienced and have no ideas about new technology, new materials, etc., to which they have not been exposed. Needless to say, there is a limitation on what can be collected from the voice of the customer. Therefore, when conducting consumer research, designers must put more focus on how consumers feel about the product and how their needs are formed and influenced.
A product can convey various special meanings to various consumers, and these meanings are the results of cognition; this also influences the evaluation as to whether a purchase decision will be made (Kapoor & Kulshrestha, 2009; Zanoli & Naspetti, 2002). Thus, the meanings that a product conveys are ultimately determined by consumer cognition rather than by the nature of the products. Therefore, during the design process, designers should give priority to consumers’ cognition toward the product. Armstrong and Kotler (2000) state that cognition is a process in which a consumer selects, organizes, interprets the external information, and then internalizes it, thus creating meaning. However, due to the fact that designers and consumers have different backgrounds, a product does not quite convey the same meaning to the two parties. In other words, there is a discrepancy between designers’ and consumers’ cognitive models (Chuang, Chang, & Hsu, 2001). A product’s meaning, created by a designer, may not be well recognized and interpreted by a consumer. Consumers today have constantly changing needs, and designers should not design products solely based on their trained and internalized thinking model.
Van Kleef, van Trijp and Luning (2005) point out that a new product development cycle has four major stages: opportunity identification, development, optimization, and launch. Whether or not a new product can be successfully developed is strongly influenced by the quality insights gained at the opportunity identification stage, especially the involvement of the unmet consumers’ needs. Alam and Perry (2002) employed case studies to analyze the importance of consumers at each stage of new product development and found that idea generation is the most important stage, followed by idea screening, and the formation of a cross-functional team. If an organization can integrate consumers’ opinions as well as eliminate ideas that are not feasible as early as the idea generation stage, unnecessary losses can be effectively minimized. Diverse design methods and approaches have been devised to address the consumers’ needs and help conduct the design. These methods and approaches show an increasing concern on understanding the consumer experience (Frascara, 2002; Reynolds & Olson, 2001), context-of-use (Chamorro-Koc & Popovic, 2009; Sleeswijk Visser, Stappers, & Sanders, 2005), and request that designers involve consumers’ experience in product design process (Henson, Barnes, Livesey, Childs, & Ewart, 2006; Kouprie & Visser, 2009; Maletz, Blouin, Schnedl, Brisson, & Zamazal, 2007). Designers and researchers use these techniques which are still under development to gain deeper insight into the demands and preferences of potential consumers of new products. As most of these techniques have assisted designers in gathering information about consumer needs, they have not helped to further understanding of the specific ways in which visual representation is employed to identify difference between designers’ and consumers’ thoughts.
Although it is widely recognized that consumers’ cognition and needs are essential and that there are research techniques related to these, designers still lack the fundamental understanding of how their cognition differs from that of the consumers’, and how they can leverage the understanding and apply it to product design. Below are the research points this study is trying to answer:
- Failure to listen to consumers’ voice. At the product idea generation stage, designers mostly conduct brainstorming, and the consumers’ needs are determined by the cognition from the designers’ brainstorming, which is overly subjective.
- Limited scope of the consumer’s voice. When consumers are involved in the design process, due to the fact that they provide their personal viewpoints or suggestions based on their limited experiences and knowledge, breakthrough innovation and creativity gained from consumer insights are hardly seen. Therefore, designers must successfully guide consumers into a field with which they are unfamiliar or unaware of, instead of limiting designers to consumers’ current cognition.
- Identification of the similarities and differences between the cognition of designers and that of consumers. What designers want to convey might not be the same as what is received by the consumers. Clearly understanding the similarities and differences between designers’ and consumers’ cognition toward a product will benefit the selection process of product ideas. Therefore, this study strives to build a cognitive structure model in the hope that designers and consumers can reach a consensus on cognition toward a product at the idea generation stage, and thus help to develop suitable design guidelines.
Literature Review
In order to collect information that can be used as a guide for consumers and expand the “the limited scope of consumers’ voice,” this paper will review mind mapping, a tool that can be used to conduct radiant creative thinking to facilitate the decision-making process and information integration and to present designers’ cognition. In order to counter the fact that product ideas are overly subjective to designers’ cognition and to solve the problem of “failure to listen to consumers’ voice,” the implication matrix will be briefly introduced. Through an implication matrix, it is possible to quantify the degree of correlation among elements from respondents, so that consumer data can be analyzed. In order to understand consumers’ cognitive structure toward a product and to help “identify the similarities and differences between the cognition of designers and that of consumers,” the means-end chain (MEC) will be introduced, a method that classifies a product’s meaning into three levels (attributes, consequences, and values), thus helping researchers to appreciate consumers’ experiences and cognition.
Mind Mapping
Mind mapping is a structured and radiant thinking model, where the information is organized based on hierarchies and categories (Budd, 2004); it is an outline where sub-subjects flow from a central subject. Each branch (a keyword, image or symbol) becomes a central concept itself, and more associations can flow from each branch. Since mind mapping can help people to retrieve knowledge from memory and visualize the relationships between different ideas and concepts, it can be a good tool when it comes to solving problems in a creative way (Buzan, 2005). Johari et al. (2011) believe that mind mapping is an effective and efficient method for idea generation; each idea has its own connections to other ideas and concepts. Mind mapping not only gives a holistic view of the main topic, but also helps us to understand the relationships between details as well as the relationships between the details and the whole. Designers should not limit themselves to the current cognitive structures, and instead they need to successfully reorganize and stimulate their ideas from professional experiences. Concept design is the summary of designers’ refining their sudden and emotional thoughts. Utilizing mind mapping appropriately in concept design could help designers keep the balance of logical and imaginary thoughts, so that designers’ potential could be fully developed.
Mind mapping can be described as a visual technique, for in an individual’s mind structure, mind mapping represents the knowledge, ideas, concepts and their correlations on a two-dimensional plane (Evrekli, İnel, & Balım, 2010). According to their empirical experiences, Paykoç et al. (2004) believe that at the product brainstorming session, mind mapping can facilitate critical thinking and integrate the ideas of the team; therefore, both the quality and quantity of the ideas can be improved. A graphical method that unleashes the potential of the brain, mind mapping can categorize ideas and arrange them in hierarchies based on their correlations, thereby eliciting unlimited creative ideas from designers and helping to reorganize their ideas from the past, so a new thinking structure can be created.
Implication Matrix
Reynolds and Gutman (1988) state: “such a matrix will be a square matrix with a size reflecting the number of elements one is trying to map” (p. 20). Van Rekom and Wierenga (2002) believe that an implication matrix shows the connections between ideas. The items shown in the rows and columns of a matrix are classified elements: the row-items stand for means and the column-items stand for ends. All of the interactions among the elements that originate from the qualitative data are verified. Therefore, an implication matrix is a method that can bridge the gap between qualitative and quantitative findings; it quantifies the correlations between elements: the higher the value between two elements, the stronger the linkage relationship between the two (de Souza Leão & de Mello, 2007; Veludo-de-Oliveira, Ikeda, & Campomar, 2006). Through summing up the number of direct and indirect relations between all the pairs mentioned by respondents, an aggregated implication matrix can be constructed (Phillips & Reynolds, 2009). Direct relation means two elements are adjacent to each other; indirect relation means two elements are linked through a third element.
Researchers need to successfully draw consumers’ attention to those that seem unimportant or neglected. Implication matrix can help researchers to integrate and quantify an understanding of consumers’ cognitive orientations by linking relations among all the elements. This result is also the foundation for drawing a means-end chain.
Means-End Chain
As the paper is interested in the different cognitive structures between the users and the designers when it comes down to the product, the means-end chain approach is a suitable approach to correlate the values and benefits of the users with designers’ intentions (product attributes). Means-end chain theory proposes that product knowledge is stored in consumers’ memory in a hierarchical manner: during the linkage process of product attributes, consumption consequences and personal values, certain attributes are important if they can be linked to a more abstract value level (Chiu, 2005; de Ferran & Grunert, 2007; Klenosky, 2002). Attributes are physical or observable features of a product or a service; consequences refer to the benefits or consequences after using a product or service; values mean highly abstract motivations which can guide usage behaviors. The means-end chain is a method to discover what important meanings consumers have given to a product or service; this method shows the extracts of the cognitive structure and connects cognitive concepts using one-on-one linear types (Voss, Gruber, & Szmigin, 2007). By understanding the process from the lower level (attributes) to the higher level (values), it is possible to explain how the product information is interpreted in terms of consumers’ motivation, and prioritize certain attributes or consequences, as well as clearly understand the rationale behind it. The earlier work in this field helped to employ product knowledge in order to resolve issues, such as product positioning or brand value (Gutman, 1982; Olson & Reynolds, 1983). Later, researchers successfully applied means-end chain to areas in consumer decision-making behavior, strategic marketing and sales management (Deeter-Schmelz, Kennedy, & Goebel, 2002; Gutman & Miaoulis, 2003; Pieters, Baumgartner, & Allen, 1995; Van Rekom, Van Riel, & Wierenga, 2006; Reynolds & Olson, 2001).
Laddering, a technique used to collect means-end chain information is divided into two types: 1. Personal interviews: One-on-one in-depth interviews are conducted through direct elicitation or free sorting in order to determine consumers’ psychological levels, step by step (e.g., Deeter-Schmelz et al., 2002; Peffers, Gengler, & Tuunanen, 2003; Valette-Florence, 1998). 2. Laddering questionnaires: Walker and Olson (1991) developed a paper and pencil version of the laddering interview. Botschen and Hemetsberger (1998) proposed a revised version in which respondents fill in structured questionnaires. This method was used in some successful cases to collect means-end chain information (e.g., Botschen, Thelen, & Pieters, 1999; Goldenberg, Klenosky, O’Leary, & Templin, 2000; Voss et al., 2007). The main advantage of the questionnaire version is that interviewer’s prejudice can be avoided and respondents feel less stressed when answering questions. Another advantage is that it is more economical and effective compared to traditional in-depth interviews. The author once tried to use the laddering technique to interview consumers regarding the idea generation of a new product and found the following problems in consumers’ opinions.
- Inflexibility of features: consumers already have pre-existing fixed thoughts on the features of a certain product or service, and these thoughts are hard to change.
- Insufficiency of experience and knowledge: due to the fact that consumers have a limited understanding of current technology and expertise, they are unable to effectively express their needs or they may have ideas which cannot be realized in a short time frame.
Model Construction
In the following subsections the authors construct a mind map in a radial manner (values–consequences–attributes) to present designers’ cognition regarding a product, and this cognition becomes the material to guide consumers. Second, an implication matrix is created, and consumers are provided with an opportunity to express their opinions by evaluating and giving values to elements in pairs, on two levels: attributes-consequences and consequences-values. Third, cognitive similarities and differences of designers and consumers are distinguished. In this way, designers can understand how their cognitive structure is different from consumers’, thus a cognitive consensus can be reached by both parties and can be used as a basis when developing guidelines for product design.
Designer Cognitions (Data Collection)
After confirming the design topic, designers start using mind mapping to conduct ideas generation for the new product. Here are some tips for drawing a mind map (Buzan, 2002; Gelb, 1998; Reed, 2005): 1. Put the main topic (a word or an image) in the center of the paper, and the main branches span out from the center. 2. Smaller branches are spanned from the main branches, and only one keyword is marked on each branch. Any association is allowed and there is no restriction or criticism imposed. 3. All the smaller branches spanned from each main branch form node-like structures; the thickness of the main branches and smaller branches differ. 4. Two association methods can be applied: brain flow and brain bloom. With brain flow, only one keyword is associated and generated from the other keyword. Brain bloom means more than one keyword is associated and generated from the other keyword. 5. Lines can be drawn after keywords if respondents are unable to come up with keywords right away. These blank lines will help the respondents to fill in the information later. 6. Keywords are categorized into hierarchies using a systematic thinking process, “Basic Ordering Ideas (BOIs) .”
One critical step when creating a mind map is to generate effective BOIs, for it can help to integrate other affiliated ideas into the structure. For example, one “attribute,” such as “sound and light effect,” is written on the main branch when the idea generation process is conducted using a radial mind mapping method for a central topic, “beach toys design”; the ideas on the branches spanning from “sound and light effect” will be restricted and this causes thought stagnation. BOIs can be used as a source for prompting thoughts so the thought process can be traced. BOIs dissect the keyword association process and categorize keywords, so a structured thinking process is created in the human brain; once the main ideas are presented, the secondary ideas can be easily and quickly generated. In this study, BOIs employ a means-end chain methodology: values are the closest to the center, followed by consequences and then attributes. The ideas are categorized and put in a hierarchy, as shown in Figure 1. When using mind mapping to write down keywords and to describe the correlations between keywords, participants constantly think, select, and comprehend related information; thus, the process helps them with decision making.
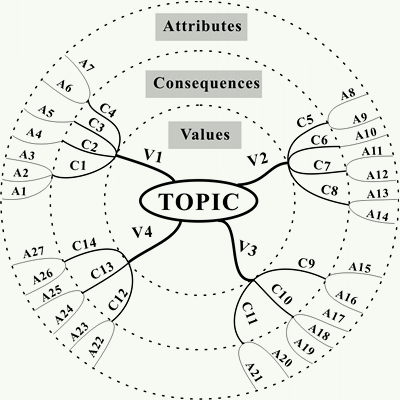
Figure 1. BOIs for this study’s mind map.
Consumer Cognitions (Data Analysis)
Attributes, consequences, and value elements generated from mind mapping provide the basis for developing questionnaires for attribute-consequence (AC) and consequence-value (CV) implication matrices. In other words, after designers obtain elements from mind mapping, an implication matrix can be used to conduct research on consumers’ cognition regarding the correlations between these elements, and the matrix will help to connect those elements valued most by consumers. The traditional implication matrix aggregates the number of times two elements are connected. What sets the matrix in this study apart from the traditional matrix is that questionnaires with rating scale questions are answered by respondents, and they rate the degree of correlation of elements in pairs. In an implication matrix, attribute elements are listed in columns and the consequence elements in rows, resulting in a table of all combinations of attribute and consequence elements. Each column also contains an importance factor that allows respondents to indicate the perceived importance between two elements, using a five-point linguistic rating scale. Figure 2 partially shows the format for an AC implication matrix (a CV implication matrix has the same format). The information in the modified implication matrix is weighted, which makes respondents’ answers show the degree of difference rather than just whether or not two elements are correlated; this ensures that the research accurately reflects the opinions of respondents.
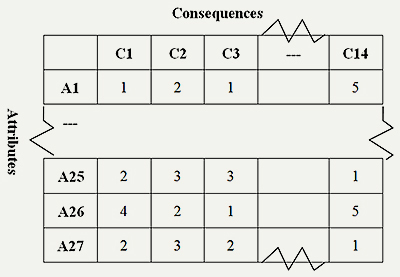
Figure 2. Format of the AC implication matrix.
Similarities and Differences between the Cognition of Designers and that of Consumers (Data Interpretation)
The application of an implication matrix can help researchers to understand the orientation of consumers’ cognition and gain insights into consumers’ cognitive structure of product knowledge. Besides the cognitive similarities and differences between designers and consumers, two situations can occur within each party’s cognition. Therefore, four areas can be formed, as shown in Figure 3. In Figure 3, Ai–Cj indicates one attribute: consequences are linked, Ai![]() Cj indicates no attributes: consequences are linked; Cj–Vk indicates one consequence: values are linked, Cj
Cj indicates no attributes: consequences are linked; Cj–Vk indicates one consequence: values are linked, Cj![]() Vk indicates no consequences: values are linked. A description of the four areas follows:
Vk indicates no consequences: values are linked. A description of the four areas follows:
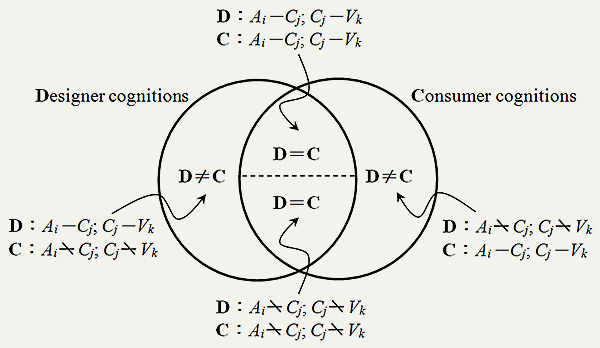
Figure 3. Types of designer and consumer cognitions.
- Designers and consumers have the same cognitions (D = C). There are two types of the same cognition: one is both designers and consumers think there is a linkage (Ai–Cj; Cj–Vk), this is “positive consensus”; the other is when both designers and consumers think there is no linkage (Ai
 Cj; CjVk), this is “negative consensus.”
 - Designers and consumers have different cognitions (D≠C). There are two types of different cognitions: one is when designers think there is a linkage (Ai–Cj; Cj–Vk) but consumers do not think there is a linkage (AiCj; CjVk); this is “designer’s subjectivity.” The other is when designers think there is no linkage (AiCj; CjVk) but consumers think there is linkage (Ai–Cj; Cj–Vk); this is “consumer’s subjectivity.”
This study will focus on the area (Ai–Cj; Cj–Vk) where designers and consumers both think there is a linkage. This area represents the cognitive consensus between designers and consumers, and the information in this area can be used as design guidelines at the initial stage of product development. A hierarchical value map (HVM) will be employed to clearly present the network relationships of the mean-end chain in this area. The purpose of creating HVM is to visualize the data analysis result from the implication matrix, and this HVM can represent most people’s thoughts most of the time; this further helps researchers to understand the current market conditions.
Case Study
In this chapter, the case study “beach toys design” explains step-by-step how consumers examine the ideas generated by designers and then how both parties reach a consensus. At the beginning of the study, designers conduct idea generation using mind mapping techniques and determine 37 “attribute” elements, 18 “consequence” elements, and 6 “value” elements. Then, an implication matrix is used to integrate the correlations between elements rated by 92 respondents, so consumers’ and designers’ cognitive similarities and differences on “beach toys design,” as well as the linkage relationships between them, can be clarified. Finally, streamlined HVM is employed to represent the area where designers and consumers have “positive consensus” (both have the same cognition and both think there is a linkage), and use the information in this area as the product design guideline.
Designers Employ Mind Mapping to Generated Product Ideas
Toys play an important role in human life, attracting not only children but also people of all ages. Generally speaking, toys should be objects for intellectual inspiration, sense training, interactive entertainment, social learning, and emotional expression. Beach toys are used as the theme in this case study; three designers spent 1.5 hours brainstorming using a mind mapping methodology. Elements generated on the main branches at the “values” level are “novel and fun,” “memory,” “exploration,” “safety,” “durability,” and “creation.” Sub-branches are expanded for consequences, and the branches stemming from these sub-branches to the next level are the attributes. Based on their personal experiences and knowledge, along with the principle of stratifying and categorizing keywords, designers conduct a creative thought process in order to clarify their cognitive structure of “beach toys.” The result is as shown in Figure 4.
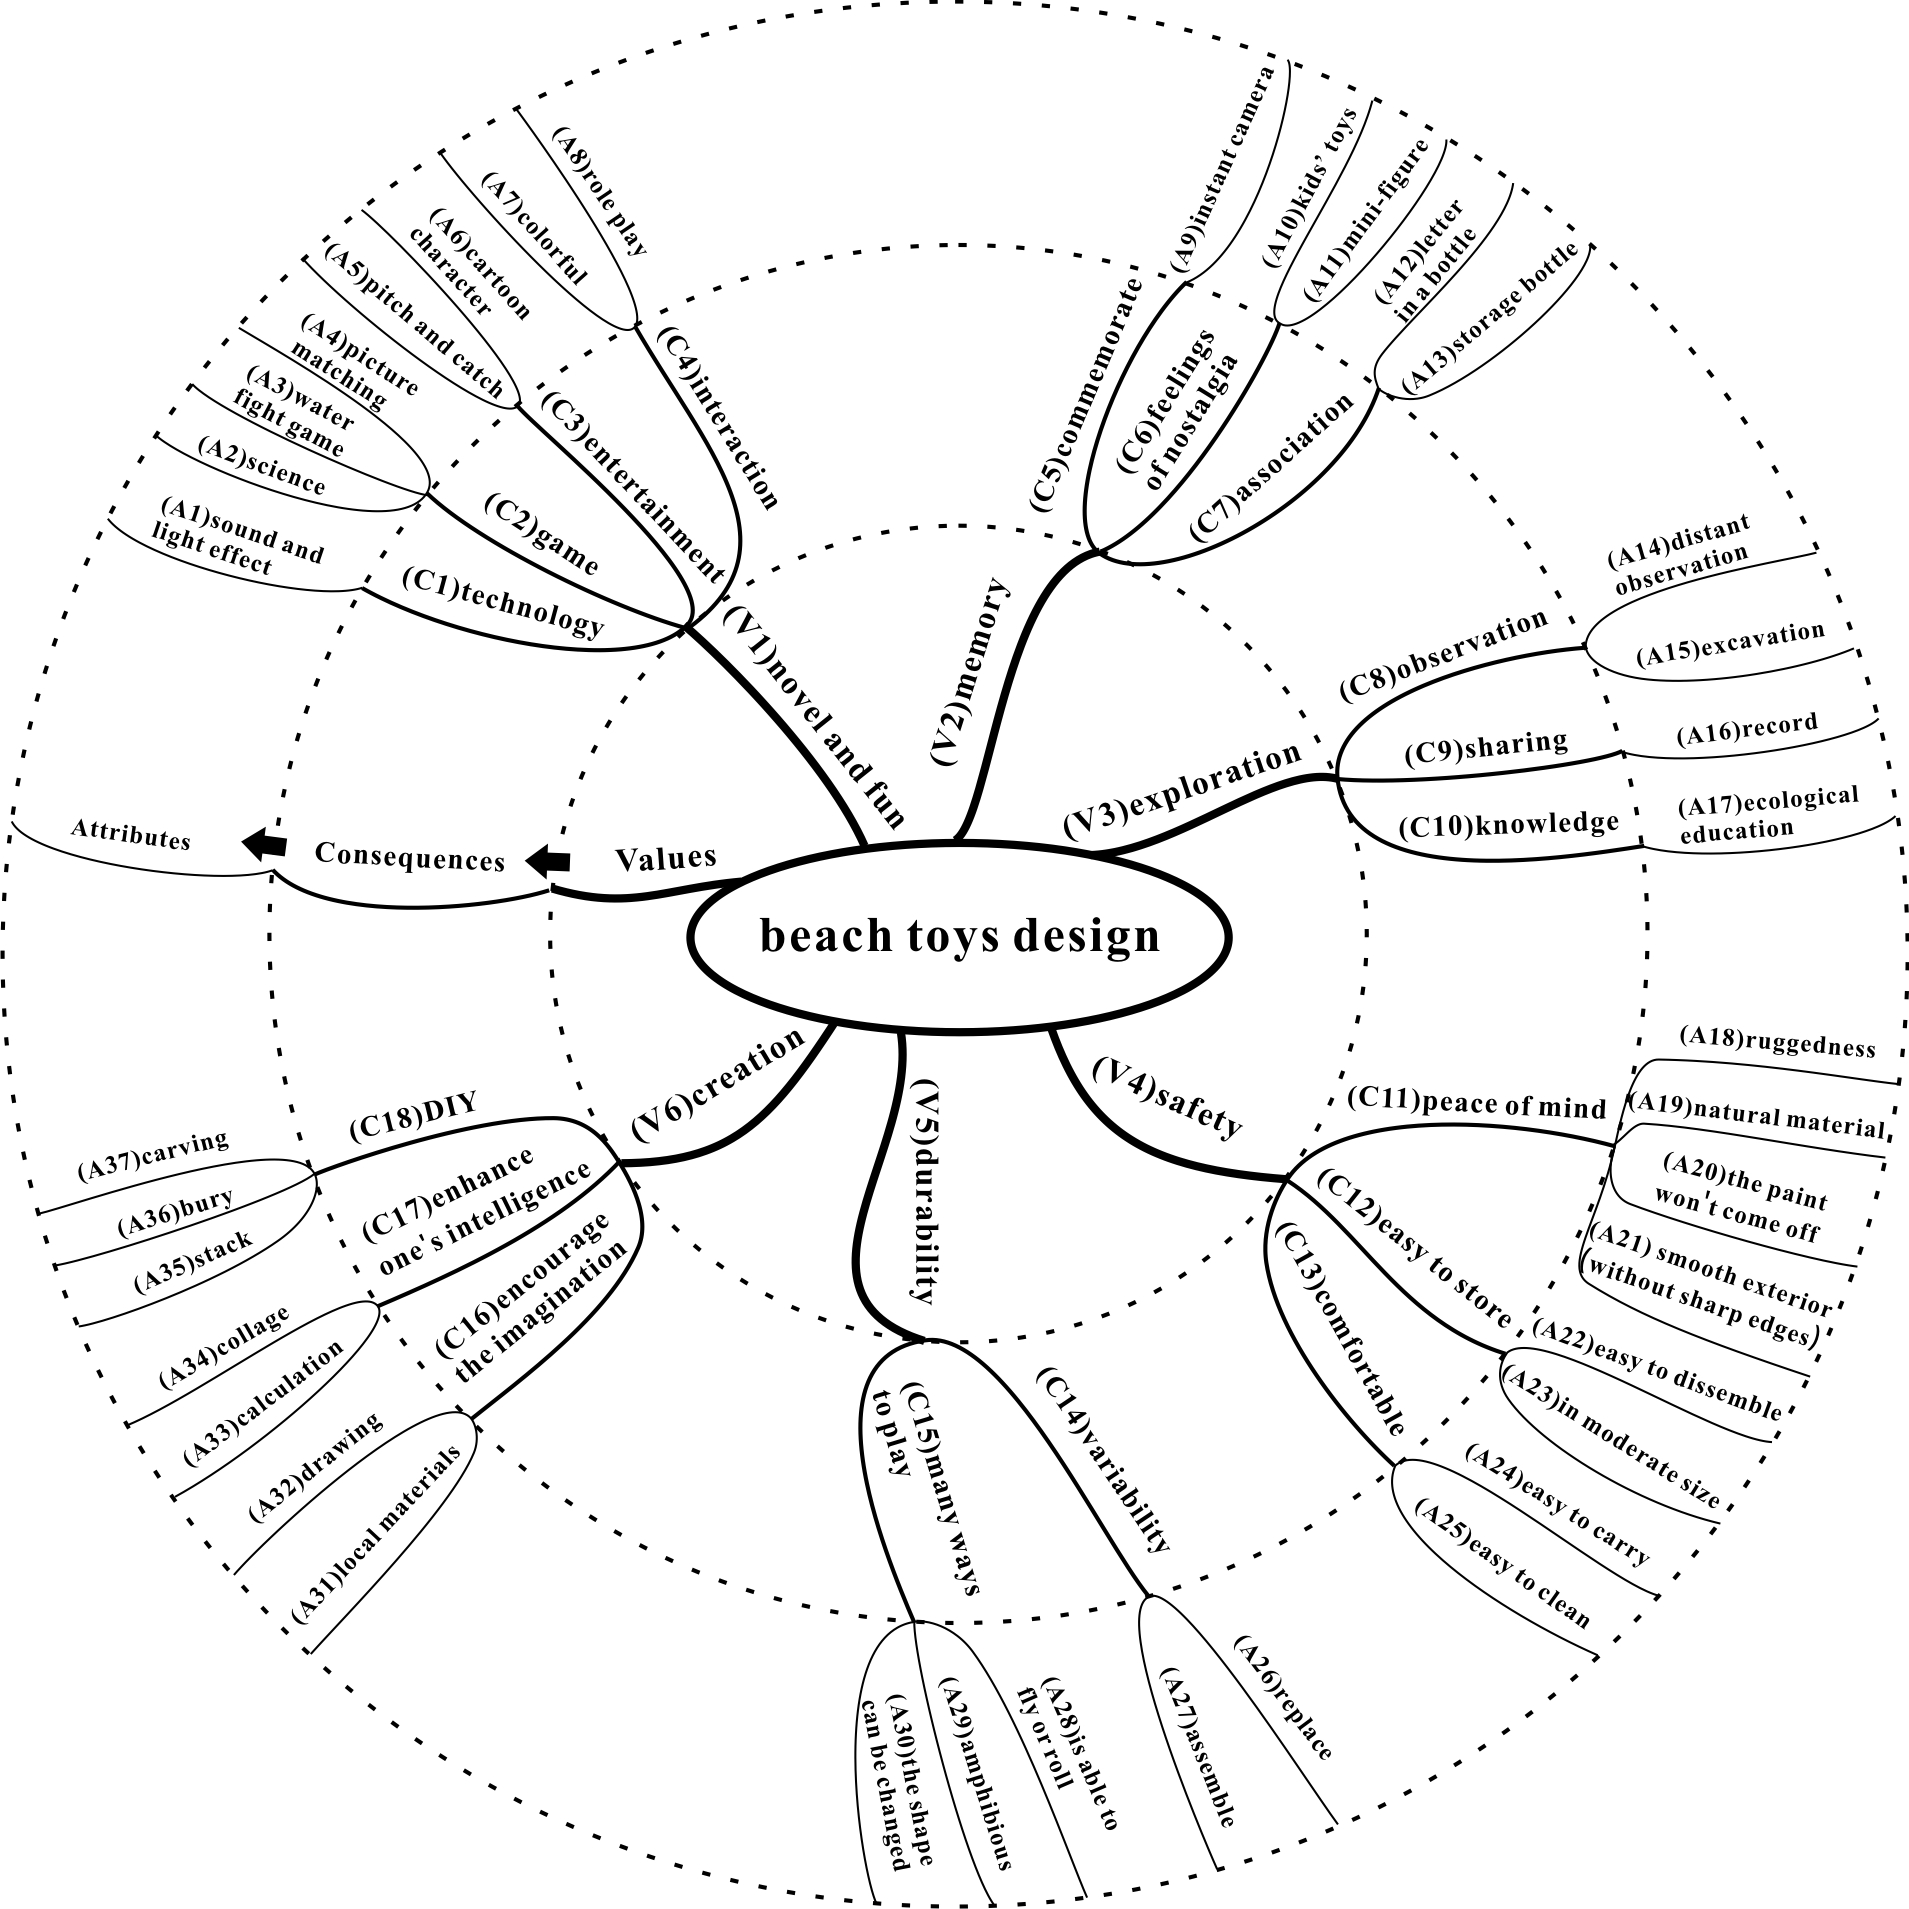
Figure 4. Mind map for beach toys design.
Reliability analysis was used for coded information. Three coders who were familiar with means-end chains and content analysis, coded, and classified the elements. Mutual agreement between the three coders was used as the criteria for judging reliability. Wimmer & Dominick (2006) suggested a reliability of more than 0.9. Reliability can be obtained through the following formula:
|
(1) |

where n represents the number of coders; mutual agreement = (2 × M) / (N1 + N2), where M is the number of questions with the same responses; N1 is the number of questions coded by the first coder, and N2 is the number of questions coded by the second coder. The overall reliability was 0.957, a satisfactory level.
The Application of the Implication Matrix to Conduct Research on Consumers’ Cognition
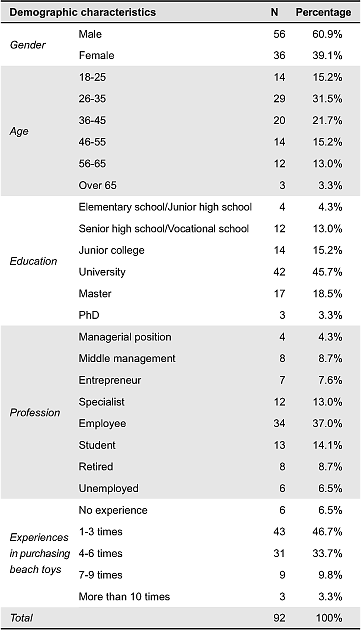
The elements categorized in Figure 4 form the AC and CV implication matrices. In the beginning, the attributes were in rows and the consequences were in columns, forming an AC matrix. The respondents indicated the perceived associations with regard to each consequence in each attribute. The evaluation used a five-point scale: very strongly associated is 5; strongly associated, 4; average, 3; slightly associated, 2; and not associated, 1. Similarly, the CV matrix listed the consequences and values. The questionnaire (including AC and CV) was given to 111 respondents. The final sample was a population of 92, giving a response rate of 83%. Table 1 reveals the demographic characteristics of the respondents.
Table 1. Profile of respondents. (N = 92)
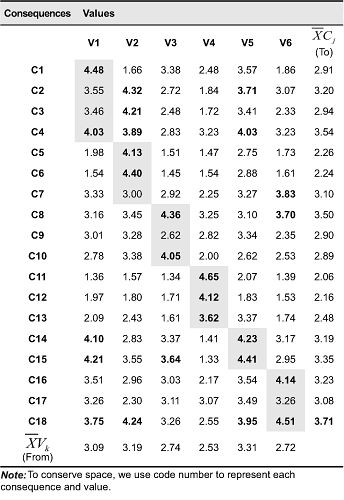
An aggregate implication matrix was then produced based on the data provided by the 92 respondents, as shown in Table 2 and 3. The average association rating was calculated by adding all respondents’ rating for each cell in the implication matrices and dividing by the number of respondents. The formula for calculating the association weight of each cell in the aggregate AC implication matrix is as follows:
|
|
(2) |
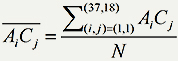
where i is the number of attributes, ranging from 1 to 37; j is the number of consequences, ranging from 1 to 18; N the number of respondents, which is 92; and ![]() is the average association rating between the attribute i and the consequence j, ranging from 1 to 5.
is the average association rating between the attribute i and the consequence j, ranging from 1 to 5.
Using the implication matrix, all the respondents’ perceived associations could be quantified, and the HVM was drawn based on this. In addition, Table 2 and 3 sum up all the elements’ “mean ratings” (![]() ) to further calculate the intensity of each linkage, which is discussed in more detail in the next section. The mean association rating was calculated by adding all average association rating for each row or column in the implication matrices and dividing by the total number of row or column cell.
) to further calculate the intensity of each linkage, which is discussed in more detail in the next section. The mean association rating was calculated by adding all average association rating for each row or column in the implication matrices and dividing by the total number of row or column cell.
|
|
(3) |
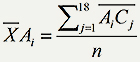
where i is the number of attributes, ranging from 1 to 37; j is the number of consequences, ranging from 1 to 18; n is the total number of consequences, with the value of 18; and ![]() is the mean association rating of attribute i, ranging from 1 to 5.
is the mean association rating of attribute i, ranging from 1 to 5.
Table 2. AC implication matrix summary for beach toys design.
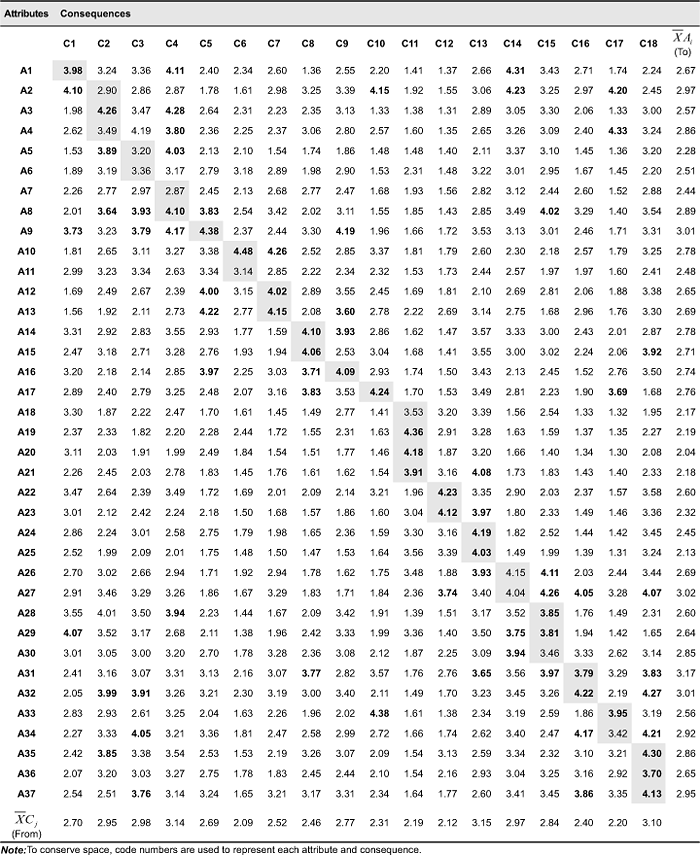
Table 3. CV implication matrix summary for beach toys design.
The Use of a Streamlined Hierarchical Value Map to Develop Product Design Guidelines
The linkages shown in Figure 4 are highlighted in gray in Tables 2 and 3; these represent the designers’ cognition. On the other hand, referring to Nielsen’s (1993) study which shows that if the mean for a five-point scale is larger than 3.60 (the numbers are in boldface in Table 2 and Table 3), it means the question has a “positive” value, meaning consumers believe that there is significant correlation between the two elements. If a rating is highlighted in gray and is in boldface, it indicates that designers and consumers reach “positive consensus”; if the rating is highlighted in gray but not in boldface, it indicates “designers’ subjectivity”; if the rating is in boldface but not highlighted in gray, it indicates “consumers’ subjectivity”; if the rating is neither highlighted in gray nor in boldface, it indicates designers and consumers reach “negative consensus.” The other criterion for inclusion on the final rating scale of an indicator is a standard deviation less than 1.2 (Smith & Kendall, 1963). The relatively low standard deviation indicates a high level of agreement by the respondents about the relative importance of the indicator. The results of this questionnaire show that all linkages of positive consensus are along with standard deviations less than 1.2 (see Table 4), which is indicating relatively good agreement. The rating results for four areas are shown in Figure 5. In Figure 5, i.j.k represents the Ai–Cj–Vk linkage; for example, 19.11.4 represents the A19–C11–V4 linkage. Since there are too many linkages in the “negative consensus” area and it is not worth discussing its results, this area shows no ratings and is marked with diagonal lines.
Table 4. The standard deviations for positive consensus.
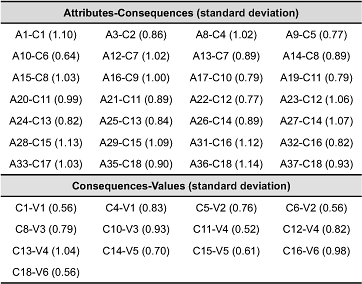
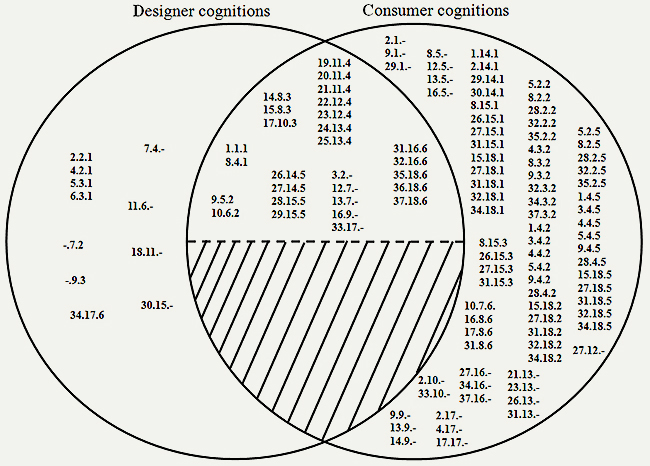
Figure 5. Rating results for designers’ and consumers’ cognitive similarities and differences.
(symbol “-” indicates the elements are absent)
There are 23 complete means-end chains and 5 incomplete ones in the “positive consensus” area in Figure 5. Each chain’s intensity can be obtained by referring to Tables 2 and 3, and summing up the “From and To” values of every element in each chain. For example, for the chain A27→C14→V5, the “From” value for A27 is 0 and its “To” value is 3.02. The “From” value for C14 is 2.97 and its “To” value is 3.19. The “From” value for V5 is 3.31 and its “To” value is 0. Therefore, the strength of this chain is expressed as follows:
(0 + 3.02) + (2.97 + 3.19) + (3.31 + 0) = 12.49
It is too complex for all the correlations of the elements in the “positive consensus” to be drawn into HVM, and it cannot clearly show the truly important linkages. Therefore, based on their needs, designers can use a few linkages with the highest intensities to develop design guidelines. Figure 6 shows the HVM for the top 5 linkages; A8→C4→V1 is the most critical linkage and its intensity is 12.66. This linkage can be called the critical path, for it explains how respondents pay attention to “role play” attributes; there is also the hope that they can “interact” with other people and, furthermore, feel that the beach toys are “novel and fun.”
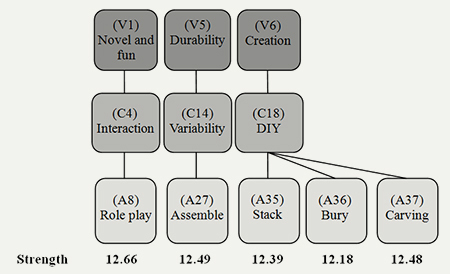
Figure 6. Streamlined hierarchical value map.
Discussion and Limitations
When developing a new product, designers and researchers aspire to gather correct and comprehensive information on consumers’ needs. However, most of them tend to collect a large amount of generic consumer data, and most of the time these data only shows superficial consumer information and obviously has its limitations. These data are just the starting point for eliciting consumers’ needs; however, most of the techniques involved deal with the decision making in regard to features and functions. Few research studies focus on understanding the differences between designers and consumers in terms of cognitive structure and factors, and using the findings to further develop product design guidelines. This study closely combines mind mapping with the implication matrix to resolve the problems of “not listening to consumers’ voice” and “the limited scope of consumer’s voice.” The main contribution of this study is that it demonstrates the effectiveness of the cognitive structure model when it comes to consumers’ participation in design and developing design guidelines. The other contribution is that designers’ and consumers’ cognitive similarities and differences were divided into four area to resolve the problem: “designers and consumers have different cognitive structures”; this helps the designers, as early as at the stage of idea generation, to obtain an in-depth understanding of differences between them and consumers when it comes to ideas about a product.
Consumers usually have rigid, pre-existing thoughts about the features and functionalities of every product, and it is difficult to change this mentality. In addition, consumers may lack technology knowledge and demand experiences from products in a new field, thus there is little help derived from them regarding suggestions for the attribute levels of innovative products. Although consumers may not be able to express what they need, understanding how consumer needs are shaped and influenced is still very important. However, most related studies focus on the features and functionalities of products and the instant satisfaction brought to consumers, but they ignore the emotional benefits behind the products. Consequently, they cannot fully understand consumers’ intangible thoughts, true feelings and the forces that drive them. Therefore, when designers conduct an innovative product design concepts, more focus should be put on consumers’ suggestions for the “consequences” and “values” levels, and it is also the core value of this study. When applying to other design cases, the focal point is that using this cognitive structure model to obtain designers and consumers’ opinions for the consequences and values levels in the positive consensus area, and then conduct designing.
Though this study effectively develops product design guidelines for beach toys, it is unable to evaluate their accuracy. The focus of this study is to employ mind mapping to generate ideas, to employ an implication matrix to understand respondents’ cognitive orientations, and to define the types of cognitive similarities and differences between designers and consumers in order to resolve problems such as designers tending to be subjective at the ideas generation stage and consumers having unclear needs.
This study also has limitations. First, the fact that the 92 respondents either had involvement in beach activities or had not bought beach toys for a while might have influenced their five-point rating scale. The best candidates for testing should be those subjects who often participate in beach activities or those who just purchased beach toys. Second, in order to describe the contents of the four types of designers’ and consumers’ cognition (positive consensus, designer’s subjectivity, consumer’s subjectivity, and negative consensus), the linkages of elements in adjacent levels were taken into consideration, and this created a burden for respondents. If the only need were to obtain findings for the “positive consensus” area, only the linkages shown in Figure 4 would need to be considered. Finally, in the mind map for beach toys, keywords were used in order for readers to clearly understand the meaning of each branch. When individuals or teams use mind mapping to exercise their product idea generation, they can first use drafts to express and exchange their ideas. Once they begin to conduct consumer research, they can translate those ideas into keywords which later become the elements in an implication matrix.
Conclusion
To meet consumers’ constantly changing needs, businesses must react to the marketing environment in a timely manner and must be highly flexible when it comes to product designs and productions. The cognitive structure created in this study has some advantages: first, mind mapping effectively organizes designers’ seemingly disorganized ideas during the creative thinking process, and creates comprehensive as well as visible new associations to add value to the product innovation. Second, unlike the data collection method of the traditional means-end chain, this study generates the questionnaire content through mind mapping, and then asks respondents to directly rate the correlations of the elements in pairs in each hierarchy. Third, streamlined HVM puts the focus on the cognitive structure of the consumer market and makes it easier to detect the key linkages; this helps designers in developing product guidelines, and helps marketers in decision-making. Finally, this cognitive structure model can facilitate the communication between designers and consumers in terms of cognition, and the accuracy and creativity of problem-solving can be raised so that consumers’ needs can be more perfectly met. To sum up, designers can use mind mapping to conduct brainstorming to show their cognition towards a product. The implication matrix is used for designing consumer questionnaires and can clarify the discrepancies between designers’ and consumers’ cognitive structures. Streamlined HVM can detect important linkages that need to be considered first, and it helps designers to effectively develop product design guidelines.
When conducting the research on “beach toys design,” it was found that since this cognitive structure model meets two important principles, “easy to use” and “useful,” it would be universally accepted and adopted in the future. Researchers who employ this model will have a number of advantages. 1. Consumers can become effectively involved in product design. Consumers play a quite important role during the product development process. The earlier that their opinions or concerns can be recognized and understood, the better, since in this way, designers can eliminate their purely subjective ideas. 2. The cognitive similarities and differences of consumers and designers are clearly distinguished; this not only helps researchers tell the cognitive differences between the two parties, but also helps designers to objectively understand how their ideas are positioned in the consumer market. 3. Design guidelines are statistically based. The implication matrix is used to conduct research analysis, and consumers directly rate the correlation of elements. After the four areas are determined, a few important linkages are calculated and identified in the “positive consensus” area; this helps designers define design guidelines more easily and clearly.
This paper mainly introduces a cognitive structure model that effectively helps designers to find a common ground in product needs with their clients. Through dividing designers’ and consumers’ cognitive similarities and differences into four areas, designers can confirm whether their own ideas were approved or not by consumers, and unacceptable ideas can be excluded as early as possible. When changes in the market occur, the cognitive structure model can be applied to help businesses quickly change the direction of designs and at the same time take important consumer feedback into consideration. The goal of this model is to make sure that designers focus not simply on product features and functionalities but the higher level consequences and values that drive customer behavior. When practically applying this model in the design industry, the design team can brainstorm the attribute, consequence, and value elements for the new products first. Later, the market analysis team designs a questionnaire, composed of the resulting elements to survey consumer cognition, and can thus obtain consumers’ needs and preferences. Finally, the results with a positive consensus between designers and consumers will be feedback to the designers, and thus help to develop design guidelines. Designers can then conduct concept development of the next phase following the guidelines. Among the four areas, the “positive consensus” area is the only area that this study focuses on, and the information from this area is used to develop product design guidelines. In the future, if different consumers groups or markets are targeted, more discussions on “designer’s objectivity” and “consumer’s objectivity” can be expected, so potential product ideas will not be neglected. To conclude, the cognitive structure model in this study employs mind mapping to specify new product ideas, and then uses an implication matrix to focus on consumers’ needs. Finally, a streamlined HVM is employed to develop new product guidelines.
References
- Alam, I., & Perry, C. (2002). A customer-oriented new service development process. Journal of Services Marketing, 16(6), 515-534.
- Armstrong, G., & Kotler, P. (2000). Marketing: An introduction (5th ed.). Upper Saddler River, NJ: Prentice Hall.
- Botschen, G., & Hemetsberger, A. (1998). Diagnosing means-end structures to determine the degree of potential marketing program standardization. Journal of Business Research, 42(2), 151-159.
- Botschen, G., Thelen, E. M., & Pieters, R. (1999). Using means-end structures for benefit segmentation: An application to services. European Journal of Marketing, 33(1/2), 38-58.
- Budd, J. W. (2004). Mind maps as classroom exercises. The Journal of Economic Education, 35(1), 35-46.
- Buzan, T. (2002). How to mind map: The ultimate thinking tool that will change your life. London, UK: Thorsons.
- Buzan, T. (2005). Mind map handbook: The ultimate thinking tool. London, UK: Thorsons.
- Chamorro-Koc, M., & Popovic, V. (2008, July 18). Context-of-use and the design of user-product interactions: Exploring causal relationships. Paper presented at The 4th Biennial Conference of the Design Research Society, Sheffield Hallam University, Sheffield, UK. Retrieved May 15, 2009, from http://shura.shu.ac.uk/480/
- Chang, H.-C., Lai, H.-H., & Chang, Y.-M. (2006). Expression modes used by consumers in conveying desire for product form: A case study of a car. International Journal of Industrial Ergonomics, 36(1), 3-10.
- Chiu, C.-M. (2005). Applying means-end chain theory to eliciting system requirements and understanding users perceptual orientations. Information & Management, 42(3), 455-468.
- Chuang, M. C., Chang, C. C., & Hsu, S. H. (2001). Perceptual factors underlying user preferences toward product form of mobile phones. International Journal of Industrial Ergonomics, 27(4), 247-258.
- Deeter-Schmelz, D. R., Kennedy, K. N., & Goebel, D. J. (2002). Understanding sales manager effectiveness: Linking attributes to sales force values. Industrial Marketing Management, 31(7), 617-626.
- Evrekli, E., İnel, D., & Balım, A. G. (2010). Development of a scoring system to assess mind maps. Procedia Social and Behavioral Sciences, 2(2), 2330-2334.
- de Ferran, F., & Grunert, K. G. (2007). French fair trade coffee buyers’ purchasing motives: An exploratory study using means-end chains analysis. Food Quality and Preference, 18(2), 218-229.
- Frascara, J. (2002). Design and the social sciences: Making connections. New York, NY: Taylor & Francis.
- Gelb, M. J. (1998). How to think like Leonardo da Vinci: Seven steps to genius every day. New York, NY: Delacorte.
- Goldenberg, M. A., Klenosky, D. B., O’Leary, J. T., & Templin, T. J. (2000). A means-end investigation of ropes course experiences. Journal of Leisure Research, 32(2), 208-224.
- Gutman, J. (1982). A means-end chain model based on consumer categorization processes. Journal of Marketing, 46(2), 60-72.
- Gutman, J., & Miaoulis, G. (2003). Communicating a quality position in service delivery: An application in higher education. Managing Service Quality, 13(2), 105-111.
- Henson, B., Barnes, C., Livesey, R., Childs, T., & Ewart, K. (2006). Affective consumer requirements: A case study of moisturizer packaging. Concurrent Engineering: Research and Applications, 14(3), 187-196.
- Johari, J., Wahab, D. A., Sahari, J., Abdullah, S., Ramli, R., Yassin, R. M., & Muhamad, N. (2011). Systematic infusion of creativity in engineering design courses. Procedia Social and Behavioral Sciences, 18, 255-259.
- Kapoor, A., & Kulshrestha, C. (2009). Consumers’ perceptions: An analytical study of influence of consumer emotions and response. Direct Marketing: An International Journal, 3(3), 186-202.
- van Kleef, E., van Trijp, H. C. M., & Luning, P. (2005). Consumer research in the early stages of new product development: A critical review of methods and techniques. Food Quality and Preference, 16(3), 181-201.
- Klenosky, D. B. (2002). The “pull” of tourism destinations: A means-end investigation. Journal of Travel Research, 40(4), 385-395.
- Kouprie, M., & Visser, F. S. (2009). A framework for empathy in design: Stepping into and out of the user’s life. Journal of Engineering Design, 20(5), 437-448.
- Kramer, T. (2003). The effect of preference measurement on preference construction and responses to customized offers (Unpublished doctoral dissertation). Stanford University, Stanford, CA.
- de Souza Leão, A. L. M., & de Mello, S. C. B. (2007). The means-end approach to understanding customer values of a on-line newspaper. Brazilian Administration Review, 4(1), 1-20.
- Maletz, M., Blouin, J.-G., Schnedl, H., Brisson, D., & Zamazal, K. (2007). A holistic approach for integrated requirements modeling in the product development process. In F. L. Krause (Ed.), Proceedings of the 17th CIRP Design Conference (pp. 197-207). Berlin, Germany: Springer.
- Nielsen, J. (1993). Usability engineering. Boston, MA: Academic.
- Olson, J. C., & Reynolds, T. J. (1983). Understanding consumers’ cognitive structures: Implications for marketing strategy. Lexington, MA: Lexington Books.
- Paykoç, F., Mengi, B., Kamay, P. O., Önkol, P., Özgür, B., Pilli, O., & Yıldırım, H. (2004). What are the major curriculum issues? The use of mindmapping as a brainstorming exercise. In Proceedings of the 1st International Conference on Concept Mapping (pp. 457-467). Pamplona, Spain: Universidad Pública de Navarra.
- Peffers, K., Gengler, C. E., & Tuunanen, T. (2003). Extending critical success factors methodology to facilitate broadly participative information systems planning. Journal of Management Information Systems, 20(1), 51-85.
- Phillips, J. M., & Reynolds, T. J. (2009). A hard look at hard laddering: A comparison of studies examining the hierarchical structure of means-end theory. Qualitative Market Research: An International Journal, 12(1), 83-99.
- Pieters, R., Baumgartner, H., & Allen, D. (1995). A means-end chain approach to consumer goal structures. International Journal of Research in Marketing, 12(3), 227 -244.
- Reed, W. (2005). Mind mapping for memory and creativity (in Japanese). Tokyo, Japan: Forest.
- Van Rekom, J., Van Riel, C. B. M., & Wierenga, B. (2006). A methodology for assessing organizational core values. Journal of Management Studies, 43(2), 175-201.
- Van Rekom, J., & Wierenga, B. (2002). Means-end relations: Hierarchies or networks? An inquiry into the (a)symmetry of means-end relations. (ERIM report series research in management, No. ERS-2002-36-MKT). Rotterdam, the Netherlands: Erasmus University.
- Reynolds, T. J., & Gutman, J. (1988). Laddering theory, method, analysis, and interpretation. Journal of Advertising Research, 28(1), 11-31.
- Reynolds, T. J., & Olson, J. C. (2001). Understanding consumer decision making: The means-end approach to marketing and advertising strategy. Mahwah, NJ: Lawrence Erlbaum.
- Sleeswijk Visser, F., Stappers, P. J., van der Lugt, R., & Sanders, E. B.-N. (2005). Contextmapping: Experiences from practice. CoDesign, 1(2), 119-149.
- Smith, P. C., & Kendall, L. M. (1963) Retranslation of expectations: An approach to the construction of unambiguous anchors for rating scales. Journal of Applied Psychology, 47(2), 149-155.
- Ulwick, A. W. (2002). Turn customer input into innovation. Havard Business Review, 80(1), 91-97.
- Valette-Florence, P. (1998). A causal analysis of means-end hierarchies in a cross-cultural context: Methodological refinements. Journal of Business Research, 42(2), 161-166.
- Veludo-de-Oliveira, T. M., Ikeda, A. A., & Campomar, M. C. (2006). Discussing laddering application by the means-end chain theory. The Qualitative Report, 11(4), 626-642.
- Voss, R., Gruber, T., & Szmigin, I. (2007). Service quality in higher education: The role of student expectations. Journal of Business Research, 60(9), 949-959.
- Walker, B. A., & Olson, J. C. (1991). Means-end chains: Connecting products with self. Journal of Business Research, 22(2), 111-118.
- Wimmer, R. D., & Dominick, J. R. (2006). Mass media research: An introduction (8th ed.). Belmont, CA: Wadsworth.
- Zanoli, R., & Naspetti, S. (2002). Consumer motivations in the purchase of organic food: A means-end approach. British Food Journal, 104(8), 643-653.
