
Effects of Visual-Auditory Incongruity on Product Expression and Surprise
Department of Industrial Design, Delft University of Technology, Delft, The Netherlands
Product experience is influenced by information from all the senses. Our experiments provide insight into how sounds contribute to the overall experience of a product's expression. We manipulated the sounds of dust busters and juicers so that they either did or did not fit the expressions of the products' appearances. In some, but not all cases, we found an inverse relationship between the degree-of-fit of a sound and the degree of surprise evoked. Furthermore, we found in some cases that the expression of a product's sound influenced the overall expression of that product.
Keywords - Product Experience, Product Expression, Product Sound.
Relevance to Design Practice - The results of this study suggest that designers can influence how products are perceived, not only by designing their appearance, but also by designing the sounds they produce. However, our study shows that it is relatively difficult for designers to modify or contribute to the expression of a product by altering its sound. If they wish to do so, an iterative process of creating and testing sounds seems essential.
Citation: Ludden, G. D. S., & Schifferstein, H. N. J. (2007). Effects of visual–auditory incongruity on product expression and surprise. International Journal of Design, 1(3), 29-39.
Received August 31, 2007; Accepted October 17, 2007; Published December 1, 2007
Copyright: © 2007 Ludden & Schifferstein. Copyright for this article is retained by the authors, with first publication rights granted to the International Journal of Design. All journal content, except where otherwise noted, is licensed under a Creative Commons Attribution-NonCommercial-NoDerivs 2.5 License. By virtue of their appearance in this open-access journal, articles are free to use, with proper attribution, in educational and other non-commercial settings.
*Corresponding Author: h.n.j.schifferstein@tudelft.nl
Introduction
In one of his symphonies, later nicknamed the “surprise symphony” (Symphony No. 94 in G Major), the famous composer Joseph Haydn used a loud “surprise” chord after a relatively tranquil opening. Following the chord, the music immediately returns to tranquility. Haydn incorporated a surprise in this musical piece to make it sound new and interesting to the public (Griesinger, 1963). This anecdote illustrates the importance of sound patterns in perceiving music. More specifically, it illustrates how a sound that listeners are not expecting to hear can influence the listeners' experience of a piece of music.
As in music, patterns in the sounds of everyday products are important for the perception of these products. After all, every time people with normal hearing use products, they hear sounds. Whether or not the perceived sounds are as expected will influence how people evaluate the products. For example, a product that makes an unexpected irregular sound may lead the user to suspect that the product is not functioning well. Nevertheless, for a long time, the design of product sounds was neglected in the product design process, because designers and engineers were focusing only on reducing the sound level rather than on the specific characteristics of sounds (Özcan & van Egmond, 2004).
Traditionally, studies on auditory perception have not focussed on everyday sounds, such as product sounds. However, this area has gained attention recently. In an overview of research on everyday sounds (Giordano, 2003), most studies were found to investigate the recognition of sound source features, such as shape, material, and hollowness. For example, Kunkler-Peck and Turvey (2000) found that participants were able to identify shape and material properties at levels above chance upon hearing impact sounds. Lederman (1979) compared the effectiveness of tactile and auditory information in judging the roughness of a surface. Judgments on the basis of auditory information were similar, but not identical, to corresponding judgments for tactile information. When both sources of information were available, subjects tended to use the tactile cues. Zampini and colleagues (Zampini, Guest, & Spence, 2003; Zampini & Spence, 2004, 2005) showed that sound characteristics can influence the perceived tactual characteristics of products. In their study, participants heard real-time manipulated sound through headphones as they used the products. By increasing the overall sound level and/or by amplifying the high frequencies of product sounds, electric toothbrushes were perceived as less pleasant and rougher, sodas as more carbonated, and potato chips as crisper and fresher.
Next to physical characteristics, such as color, size, or shape, people also perceive expressive or personality characteristics of products, for example, the toughness or the femininity of a product (Govers, Hekkert, & Schoormans, 2004). Janlert and Stolterman (1997) emphasized that all the senses add to the 'character of things.' Hence, besides enabling people to identify certain material properties of objects, sounds can also influence their perceived expressive characteristics. With respect to visual appearance, the car on the left in Figure 1 may be perceived as cute, whereas the car on the right may be perceived as tough. Similarly for sounds, a product that makes a very soft, high-pitched sound may be perceived as cute, whereas a product that makes a rattling, low-pitched sound may be perceived as tough.
Designers can manipulate a product's expression to influence the experience of a product (van Rompay, Hekkert, Saakes, & Russo, 2005). For example, the flimsy sound of a car door closing may lead to low expectations of the car's driving characteristics. Lageat, Czellar, and Laurent (2003) investigated the perceived luxury of sounds produced by lighters. For a classic flip-open lighter, they found that luxury was associated either with sounds that were matte, even, and low in pitch, or with sounds that were clear, resonant, and clicking. Harley Davidson even tried to register their engine sound as a trademark (Lyon, 2003; Sapherstein, 1998) in order to maintain an exclusive 'Harley Davidson experience.'
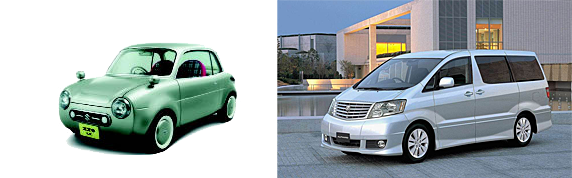
Figure 1. A 'cute' car (left) and a 'tough' car (right).
Designers are usually aware of the effect of a product's appearance on its expression but are generally much less concerned with how a product's sound influences this expression. This may lead to a perceived mismatch between the visual and auditory expression of a product. As a result, the total product experience may not be the one that the designer tries to achieve. In addition, a sound that is not congruent with a product's appearance may cause a surprise reaction. For example, a small vacuum cleaner that generates an incredible amount of noise during usage may surprise users. Similarly, a pink hair dryer with rounded curves that expresses softness may surprise users when its sound is rattling and rough.
In this paper, we study the effects of (in)congruent sounds on product expression by examining people's reactions to the sounds of electronic products. Upon seeing the product, the perceiver will form an expectation of how the product will sound when it is turned on. Such an expectation may not always be equally accurate. For electronic products, the sound is often a result of many interacting mechanical parts, which makes it hard to predict the exact sound properties. Tolman (1932) states that expectations can be formed based on “memories of actual experiences, perceptions of current stimuli, and inferences drawn from related experiences, such as trial of other objects.” In the case of unfamiliar electronic products, previous experiences with similar products will largely determine whether someone can form an accurate expectation. Later, when the actual sound of the product is heard, this actual perception will be compared to what was expected. In those cases where the deviation between the actual perception and the expectation is large, a surprise reaction can occur, which can comprise multiple physiological and behavioral reactions (Ludden, Schifferstein, & Hekkert, 2009).
The Present Study
The present study comprises three separate tests. Together, they tested whether the expressions of product sounds contribute to the expressions of products. Furthermore, they investigated how sensory (in)congruity between a product's appearance and its sound is evaluated. Finally, the experiments show several steps that are likely to occur when designing product sounds, such as adjusting previously designed sounds to implement them into a product and determining its effect on the product's expression. As such, our experiments serve as a case-study that provides insight into the product sound design process.
We manipulated sounds of electronic products so that they were either congruent or incongruent with the visual expression of the product. We chose to use electronic products, because people claim that the sound is relatively important for such products during usage (Schifferstein, 2006). Therefore, we expect that sound characteristics will have a large influence on the expressions of these products. In addition, it is relatively easy to manipulate the sounds of these products.
We selected products from two product categories, juicers and dust busters. These two product categories were chosen, because they contain products with a wide range of different expressions. From these categories, we selected pairs of products with contrasting expressions: flimsy versus robust for juicers and tough versus cute for dust busters (see Table 1). We selected these two pairs of expressions, because they were easily recognizable in the wide range of products and also because these characteristics were relevant to the product sound. The flimsy versus robust contrast seems particularly relevant, because several researchers have mentioned that the sound of a product has an effect on the perceived quality of that product (see e.g., Janlert & Stolterman, 1997). Furthermore, the tough versus cute contrast is often mentioned as a straightforward example of opposites in product expression (e.g., Govers, 2004). Therefore, we expected it to be easily recognizable.
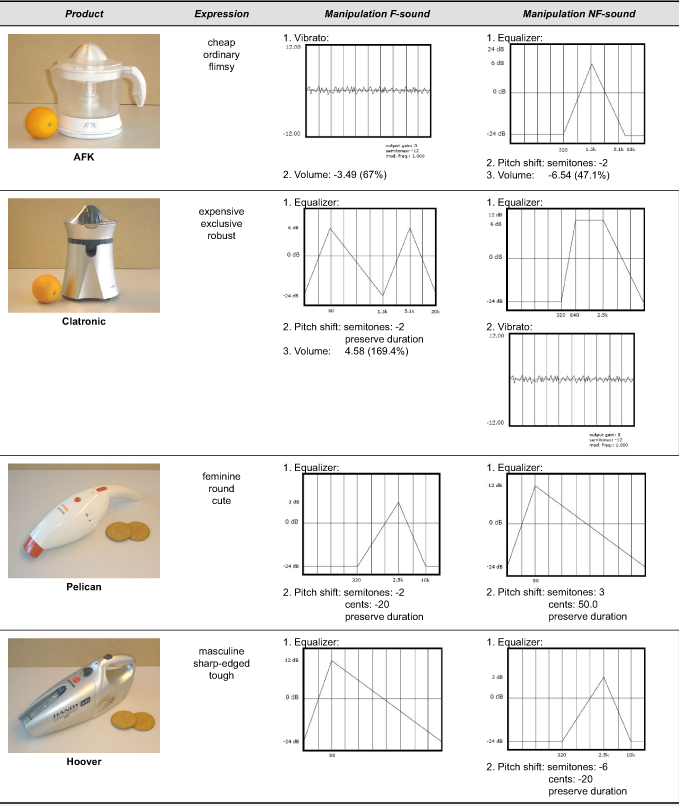
We selected a juicer that was relatively small; had simple, rounded shapes; and was made out of white and transparent plastic; giving it a cheap, flimsy appearance (brand: AFK). In contrast to this product, we selected a juicer that had a tall, vertical main form; was shaped with smooth curves; and had a silver metallic and black color combination; making it look robust, stylish, and expensive (brand: Clatronic). We selected a dust buster that was relatively big, had sharp edges, and a silver metallic color, together creating a powerful, tough, masculine appearance (brand: Hoover). We also selected a dust buster with mainly round, curved shapes and a creamy white and orange color combination, making it look cute, round, and feminine (brand: Philips Pelican).
For the first experiment, two new sounds were generated for each product, one that was expected to fit the visual expression of the product better than the actual sound and one that was expected not to fit the visual expression. In the experiment, we determined the degree of fit between the sounds and the visual appearance of each product. In the second experiment, we re-created the fitting and non-fitting sounds using a comparable, but slightly different procedure to be able to use and test these sounds in real-time. We pre-tested the new stimuli to evaluate whether they still had the desired properties. In the main experiment, we tested whether or not the incongruent sounds were found surprising, and we assessed the effects of the (in)congruent sounds on the evaluation of the product expression.
Table 1. Products used as stimuli, key expressions, and sound manipulations
Experiment 1
Experiment 1 was set up to test whether we were able to manipulate the perceived expression of product sounds and to test whether sounds that were evaluated as similar in expression to the appearance of the product were also evaluated as a better fit for the product. Therefore, participants evaluated the visual expressions of the four selected products and the expression of the manipulated sounds. They then determined whether or not the manipulated sounds matched the products.
Method
Forty participants (17 males and 23 females, aged 21-47, mean 24.8) participated in this experiment. All but six participants were students from the Department of Industrial Design Engineering at Delft University of Technology.
For the evaluation of the visual expression of the products, color photographs (10x15 cm) were used. As a size reference, the juicers were photographed together with an orange and the dust busters together with two biscuits (Table 1).
For each product, 3 different sounds were used. Besides the actual sound (A-sound) of the product, a sound 'fitting' (F-sound) and a sound 'not fitting' (NF-sound) the product's visual expression was created. We started with the actual recorded sounds of the products to make the F-sounds and NF-sounds. We recorded the sounds during product usage using a Sony Minidisc recorder. The recordings for the juicers were made by placing the microphone of the recorder at a distance of approximately 30 cm from the product as someone juiced an orange. The recordings for the dust busters were made while someone was vacuuming the surface of a table. All recordings were 13-15 s long.
The sounds were digitally manipulated using Sony Sound Forge. We manipulated the sounds mainly by boosting certain frequencies in the sound spectrum and attenuating others, as shown by the equalizers in Table 1. For each product category, the sounds were manipulated to emphasize or attenuate their specific expressive characteristics. Therefore, the sounds of the juicers were manipulated based on the expressive characteristics of cheap, flimsy as opposed to expensive, robust, whereas the sounds of the dust busters were manipulated based on the expressive characteristics of tough, masculine as opposed to cute, feminine. Table 1 shows that the manipulations for the F- and NF-sounds were cross-linked within each product category. For example, we used similar manipulations to create the F-sound for the Pelican dust buster and the NF-sound for the Hoover dust buster. We used a vibrato for some of the sounds of the juicers to increase the irregularity of the sound. This irregularity was expected to make the products sound cheaper and flimsier. We used a pitch shift for some of the sounds, which resulted in higher or lower pitched sounds. We expected higher pitched sounds to sound cuter and more feminine and lower pitched sounds to sound tougher and more masculine. Finally, for some sounds, we adjusted the volume, resulting in softer or louder sounds that were expected to affect the perceived robustness of the products.
Each participant was presented with all stimuli for a single product category: each participant first evaluated 6 sounds, then 2 pictures, and finally 2 sets of a combination of one picture with its three sounds. The order in which the stimuli were presented was randomized within the stimulus types. Nineteen participants evaluated the stimuli for the juicers, and 21 participants evaluated the stimuli for the dust busters.
Procedure
Upon entering the room, participants were seated in a chair in front of a table with an IBM laptop. The participants were instructed to listen carefully to the sounds and to answer the questions intuitively. Participants were provided with a wireless headphone (Philips HC 8410) and carried out the task autonomously. The participants could play the sound as many times as they wanted by clicking a button on the screen. The next screen showed the first 7 of a total of 14 nine-point semantic scales. On the following screen, the remaining 7 scales were presented. We selected items that measured aspects of the expressive product characteristics (cute-tough and flimsy-robust) and that were relevant for both visual and auditory stimuli. The 14 scales had endpoints: unobtrusive – obtrusive, powerful – powerless, extrovert – introvert, small – big, quiet – busy, robust – flimsy, ordinary – exclusive, masculine – feminine, not sharp – sharp, expensive – cheap, tough – cute, not stylish – stylish, funny – serious, and round – edgy. The scales were presented in two different orders to different participants. After evaluating all 6 sounds, the two pictures were evaluated with a similar procedure.
Finally, combinations of one picture with three sounds belonging to that product were presented. Participants could play the sounds in random order and were allowed to listen to all three sounds as many times as they wanted. Subsequently, participants rated the degree to which the sounds fit the picture on a nine-point scale with end points 'does not fit at all' – 'fits very well.' This procedure was repeated for the second combination of a picture with three sounds. The complete task took between 20 to 30 minutes.
Results
For each product, repeated measures ANOVAs were carried out on the ratings for how well the sounds fit the pictures (Degree of fit). We examined mean differences between the three sounds for each product in paired comparisons with Bonferroni adjustment for multiple comparisons (Table 2).
Table 2. Mean scores and F-values for Degree of fit
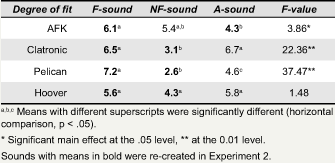
We found main effects of Type of sound on Degree of fit for the Pelican dust buster and for the AFK and Clatronic juicers. A successful manipulation would mean that the F-sounds score significantly higher on Degree of fit than the NF-sounds. Therefore, we first examined differences between these F- and NF-sounds. From Table 2, we see that for the Clatronic juicer and the Pelican dust buster, ratings for the F-sounds were significantly higher than for the NF-sounds. However, for the AFK juicer, ratings for the NF-sound were not significantly lower than those for the F-sound. Because the lowest fit was found for the A-sound of the AFK juicer, we used the A-sound as the NF-sound for this product in all further analyses.
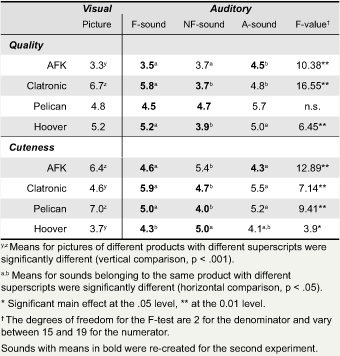
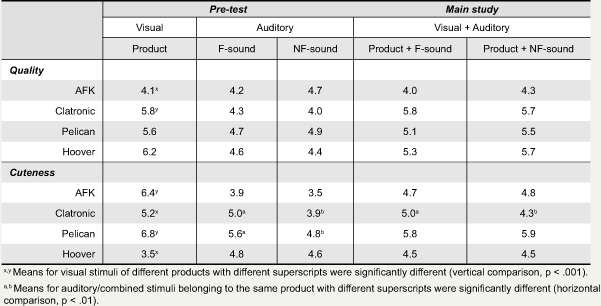
Responses on the 14 semantic scales were used to construct evaluative factors. Separate Principal Component Analyses were carried out on the data from Experiments 1 and 2. The original analyses on the data from Experiment 1 led to three factors, whereas the analyses on the data from Experiment 2 led to only two factors. The latter factors were highly similar to two of the factors that we found in Experiment 1. Therefore, we decided to construct two scales based on the items with high loadings on these two factors from both analyses. The consistency of these scales (Cronbach's α) proved to be sufficient. The two factors reflect the two dimensions we used to select the stimuli: Quality (5 items with positive end points powerful, robust, exclusive, expensive, and stylish; Cronbach's α = 0.80), and Cuteness (6 items with positive end points small, quiet, feminine, not sharp, cute, and round; α = 0.79). The means for the 4 products on these scales (for 1 picture and 3 sounds per product) are given in Table 3.
The expressions of the appearances of the 4 products can be evaluated by comparing the means in the 2nd column of Table 3. These picture data confirm our expectations that the Clatronic juicer appears superior in quality over the AFK juicer and that the Pelican dust buster looks cuter than the Hoover dust buster. A difference in expression that we had not anticipated was that the AFK juicer looks cuter than the Clatronic juicer (paired two-tailed t-test, 36 < df < 40, all p < 0.001).
For each product, the sound data were subjected to separate repeated measures ANOVAs for Quality and Cuteness with Type of sound (3 levels) as the explanatory variable. We examined mean differences between the three sounds in pairwise comparisons with Bonferroni adjustment for multiple comparisons. Horizontal comparisons between means for the 3 sounds in Table 3 showed main effects of Type of sound on Cuteness and Quality in all but one case: we found no main effect on Quality for the Pelican dust buster.
In accordance with our manipulations, the sounds for both juicers differed on Quality and the sounds for both dust busters differed on Cuteness. For the AFK juicer, the sound that was rated as the least fitting of the product (the A-sound) scored higher on Quality than the F-sound, and for the juicer Clatronic, the F-sound scored higher on this variable than the NF-sound. For the Pelican dust buster, the F-sound scored higher on Cuteness than the NF-sound; and, as expected, for the Hoover dust buster, the results were the opposite. However, we also found differences between the sounds that we had not anticipated: the F-sound for the Clatronic juicer scored higher on Cuteness than the NF-sound, and the F-sound for the Hoover dust buster scored higher on Quality than the NF-sound.
Table 3. Mean scores on Quality and Cuteness for visual and auditory stimuli
Discussion
The results show that we were successful in selecting pairs of products that differed in visual expression on the predicted variables, Cuteness and Quality. We found one difference that we had not anticipated: the appearance of the AFK juicer scored higher on Cuteness than the appearance of the Clatronic juicer. This may be explained by the difference in the height to circumference ratio between these products: The Clatronic juicer is taller while the AFK juicer is stockier.
The data also show that we were successful in creating sounds that were perceived and evaluated as having different expressions. The sounds that were selected for the second experiment are indicated in bold in Tables 2 and 3. For all but one product, we selected the manipulated F- and NF-sounds. For the AFK juicer, we selected the A-sound instead of the manipulated NF-sound, because it was evaluated as less fitting the product than the NF-sound.
With these pairs of sounds, the mean rating for the best fitting sound was generally closer to the mean for the picture on the target variable (Quality or Cuteness) than the least fitting sound. For the Clatronic juicer, the F-sound as well as the picture showed high ratings on Quality, and for the AFK juicer, the Quality rating was lower for the F-sound and thus better matches the picture than the A-sound. For the Pelican dust buster, the Cuteness rating was higher for the F-sound and thus better matches the picture than the NF-sound, whereas for the Hoover dust buster, opposite results were found for Cuteness. A comparison of Tables 2 and 3 thus shows that in general sounds and appearances with similar expressions are evaluated as having a higher degree of fit.
Experiment 2
Similar to Zampini et al. (2003), in Experiment 2, the sounds of the products were manipulated in real time to simulate a real use environment. To avoid influences that may result from the participants touching the products, the experimenter used each product as the participants watched and listened. In Experiment 1, participants evaluated recordings of manipulated sounds. To manipulate sounds while each product was being used, we had to use an alternative set-up with comparable, but slightly different, sound-manipulations. Therefore, we first pre-tested the sounds manipulated in real time. In the main study, we presented participants with combinations of sounds and products in real-time to test the effects of the expression of the sounds on the complete product expression. The same 4 products that were used in Experiment 1 were again used in Experiment 2. In both the pre-test and the main experiment, two sounds were presented to participants for each product (juicer and dust buster). In addition to the photographs that were used as visual stimuli in Experiment 1, we also presented participants with the actual products in this experiment.
Pre-test
Method
A total of 20 participants (10 males and 10 females, aged 19-26, mean 23.5) evaluated the stimuli. All participants were students from the Department of Industrial Design Engineering at Delft University of Technology.
For all 4 products, one F-sound and one NF-sound was used. The real-time manipulations were made as much as possible to resemble the sounds created for the first experiment. Using Max/MSP (Cycling '74), eight presets of real-time sound manipulations were made that could be easily accessed during the trials. These pre-sets mimicked the sound manipulations developed for Experiment 1. During the trials, a wireless microphone (AKG PT50), placed at approximately 30 cm from the product, picked up the sound of the product. This signal was sent to a receiver (AKG SR50) and then to a laptop where it was manipulated according to the appropriate preset in Max/MSP. The manipulated sound was sent to wireless headphones (Philips HC8410). Each participant was presented with all stimuli for both product categories following a procedure similar to the one used in Experiment 1.
<Procedure
Upon entering the room, participants were asked to sit at a table. The complete set-up of the experiment was hidden behind a screen.
For the evaluation of sounds, the experimenter explained that the participants had to listen carefully while she performed tasks behind the screen. The experimenter then selected the appropriate preset on the laptop and performed the first task. For the juicer product category, the experimenter juiced half an orange. For the dust buster product category, the experimenter vacuumed a table surface of approximately 30x30 cm2 partly covered with cookie crumbs. After each task, the participants filled out a questionnaire containing the same 14 semantic scales that were used in Experiment 1. All 8 sounds were evaluated with this procedure.
For the evaluation of visual appearances, a product was placed on a table approximately 1 m away from the participant for approximately 15 s. The participant was encouraged to look at the product (but was not allowed to touch it). The product was then taken away, and the participant evaluated this product on the same 14 scales. All 4 products were evaluated in this way.
For the evaluation of product-sound combinations, the actual product was shown to the participant for approximately 10 s. Then a color photograph of the product was put on the table in front of the participant. The experimenter selected the appropriate preset and performed the task for the product behind the screen. The photograph was then removed and the participant evaluated how well the sound fits the product presented on a nine-point scale with end points 'does not fit at all' – 'fits very well.' Next, the actual product was presented again. After approximately 10 s, the photograph again replaced the product, and the experimenter repeated the task with the other preset in Max/MSP for that product. The picture was then removed and the participant evaluated the Degree of fit of the sound. In this way, eight product-sound combinations were evaluated.
Results & Discussion
To examine differences on Degree of fit between F- and NF-sounds, we performed repeated measures ANOVAs per product. We found an effect of Type of sound on the Degree of fit variable only for the Clatronic juicer. The F-sound (5.8) created for this product was evaluated as significantly better in fitting the product than the NF-sound (4.0) (F(1,19) = 8.6, p < 0.01).
The same evaluative items as those in Experiment 1 were used to calculate ratings for Quality (α = 0.76) and Cuteness (α = 0.80). The means for the visual appearances confirmed our expectations and the results of Experiment 1 (2nd column in Table 4, two-tailed t-test, df=38). We subjected the ratings for sounds to repeated measures ANOVAs per product. We found effects on the Cuteness variable for two products (3rd and 4th column in Table 4). The F-sound for the Clatronic juicer scored significantly higher on Cuteness than the NF-sound for this product (F(1,19) = 16.1, p < 0.001). Furthermore, the F-sound for the Pelican dust buster also scored significantly higher on this variable than the NF-sound for this product (F(1,19) = 11.5, p < 0.01). No effects were found on the Quality variable.
The data from the pre-test show that we were able to replicate only two of the six differences between F- and NF-sounds found on Quality and Cuteness in Experiment 1. Comparing Tables 3 and 4 shows that even in these two cases, although the difference between the F- and NF-sounds was in the same direction, the mean responses shifted by 0.6 to 0.9. As a result, means for the F-sounds for the Clatronic juicer and the Pelican dust buster became even closer to the means for the visual appearances on the Cuteness variable. In the main study, we assessed the effects of the differences in Cuteness for the sounds of the Clatronic juicer and the Pelican dust buster on the complete product expression.
Table 4. Mean scores on Quality and Cuteness for visual and auditory stimuli in pre-test and for combined stimuli in main study
The real-time manipulations used in this pre-test were made to resemble the manipulations used in Experiment 1 as much as possible and were made by manipulating the same variables (boosting or attenuating certain frequencies, pitch shifts, adjusting vibrato and volume). However, the sounds were evaluated differently. The two different software packages that we used to manipulate the sounds (Sony Sound Forge and Max/MSP) have considerably different interfaces and options. Therefore, in some cases, we had to use a somewhat different approach to achieve a similar effect on the sound. For example, in Sound Forge, adding a vibrato to a sound was a standard option, whereas in Max/MSP we had to create a vibrato by using a low-frequency oscillator to continuously modulate the frequency of a tone. Although both software packages suited our purposes during the different stages of our sound design process, it seems that using two different sound editing tools caused hardly noticeable but nevertheless significant differences in our sound manipulations. We will further discuss the use of sound editing software in the general discussion.
Main Study
We expected that the differences we found in the expression of the manipulated sounds would be reflected in the expression of the products when presented with these different sounds. Thus, we expected the Clatronic juicer and the Pelican dust buster to score higher on Cuteness when presented with the F-sound than with the NF-sound. We also asked participants to indicate the extent to which they were surprised by the sounds of the stimuli. We expected that the NF-sound for the Clatronic juicer (that scored significantly lower on Degree of fit than the F-sound for this product), would elicit higher ratings on surprise. Finally, to gain further insight into what sound properties influenced people's evaluation of the expression of sounds, this study determined to what extent the perceived sounds differed from what people expected to hear upon visual inspection of the products. We also included the two products for which no effects of sounds were found in the pre-study to check whether any other unexpected changes in expression occurred for these products.
Method
A total of 106 participants (66 males and 40 females, aged 18-29, mean 23.6) participated in the main study. All participants were students from the Department of Industrial Design Engineering at Delft University of Technology. Participants were paid for their participation.
Participants were presented with real-time combinations of products and sounds. We used the 8 product-sound combinations that were used in the pre-test. The set-up for creating the real-time manipulated sounds was similar to the one used in the pre-test.
Each participant evaluated two products, one from each product category. The order in which the products were presented was randomized. Each product-sound combination was evaluated by 25-27 participants.
Procedure
The procedure followed was similar to the one used in the pre-test, except that the experimenter performed the tasks in a kitchen at a distance of approximately 3 m in full sight of the participants. After each task, the participants filled out a questionnaire. The complete session took 15-20 min.
The questionnaire consisted of three parts. All responses were given on 9-point scales. In the first part of the questionnaire, three questions about surprise were asked: 'The [product] sounded exactly as I thought,' 'I am surprised about how the [product] sounds,' and 'I am amazed about how the [product] sounds' with end points 'do not agree at all' and 'agree completely.' In the second part of the questionnaire, we asked about the incongruity between the expected and the actual perception of sound: 'When the [product] was used, it sounded … than I expected' on scales with end points 'more variable – more stable,' 'higher – lower,' 'sharper – more muffled,' 'fuller – emptier,' 'less rough – rougher,' 'less irritating – more irritating,' and 'louder – quieter.' These scales were selected based on perceptual judgements mentioned in the sound identification literature (see e.g., Ballas, 1993; Lederman, 1979) and on their relevance for our sound manipulations (see Table 1). Finally, participants evaluated the products on the same 14 semantic scales as used in the previous tests to determine scores on the scales for Quality and Cuteness.
Results & Discussion
Evaluation of Expression of Product-sound Combinations
After calculating the ratings for Quality (α = 0.80) and Cuteness (α = 0.79), we analyzed effects of Type of sound on these variables for each product separately in 8 ANOVAs. We found only one main effect of Type of sound on the dependent variable Cuteness for the Clatronic juicer (F(1,50) = 7.24, p < 0.01). As expected for the Clatronic, scores on Cuteness were significantly higher when the product was presented in combination with the F-sound than when it was presented with the NF-sound (5th and 6th column in Table 4). We did not find the expected effect on Cuteness for the Pelican dust buster (F(1,51) = 0.13, p > 0.20). This implies that only one of the two effects expected on the basis of the results from the pre-test was found in the main experiment.
Surprise
The three questions that were used to measure surprise were combined into one variable (3 items, Cronbach's α = 0.92). ANOVAs with Type of sound (F-sound and NF-sound) as the explanatory variable and Surprise as the dependent variable were carried out on the data for each product separately. For the Clatronic juicer, we found an effect of Type of sound on Surprise (F(1,51) = 9.31, p < 0.01). As expected, the mean score for the NF-sound (5.5) on Surprise was significantly higher than for the F-sound (3.7).
Incongruity between Expectation and Actual Perception of Sound
The reported deviations between what participants expected to hear based on their visual perception and what they actually heard can be used as measures of visual-auditory incongruity. Therefore, we tested whether mean responses on all 7 incongruity scales differed significantly from the center of the scale ( = 5) (two-tailed t-tests, df = 25-26, Table 5). In general, both the F- and NF-sounds for the juicers sounded rougher, more irritating, and louder than expected. This suggests that all juicer sounds were somewhat incongruent. For the dust busters, significant incongruities occurred only incidentally.
The reported deviations can also provide insight into participants' expectations about product sounds. Therefore, we tested whether deviations from expectations differed significantly between F- and NF-sounds. For the AFK juicer, the F-sound sounded significantly more variable than the NF-sound. For the Clatronic juicer, the NF-sound sounded significantly higher and sharper than the F-sound. For the Hoover dust buster, the NF-sound sounded significantly less irritating than the F-sound (see Table 5).
Table 5. Deviations in sound characteristics between expectation and actual experience
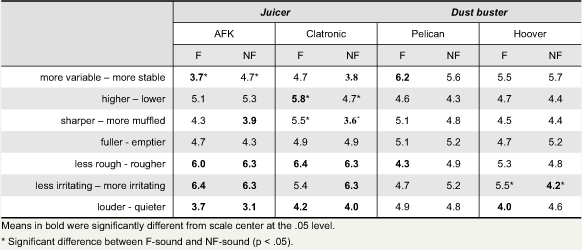
The difference in sound variability that we found for the AFK juicer is probably related to the different ratings on Quality found in Experiment 1. Similarly, the difference in irritability that we found for the Hoover dust buster is probably related to the different ratings on Cuteness found in Experiment 1 for this product. However, these differences in expression were not replicated in the pre-test of Experiment 2. In the case of the Clatronic juicer, the difference in highness and sharpness is probably related to difference found on the Cuteness dimension in both Experiment 1 and the pre-test of Experiment 2. Although we expected higher sounds to sound cuter, in this case it seems that the higher sounds were perceived as sharper and therefore as less cute. Apparently, although some sound manipulations were perceived in the main study of Experiment 2, these differences did not always lead to differences in perceived expression as measured on the Cuteness and Quality scales.
General Discussion
This study investigated the effect of incongruent sounds on surprise and the effects of the expressions of sounds on the overall product expression. In addition, we tried to gain further insight into how certain sound properties can influence people's evaluation of the expression of sounds. At the same time, these experiments form a case-study that can provide insight into the steps a designer is likely to take in order to design a desired product sound. We first discuss the different effects of our sound manipulations on product expression and the elicitation of surprise, then we elaborate on the process of designing a product sound.
Effects of Sounds
In this study we assessed the effects of sound manipulations on the product expression of Cuteness and Quality and on the feelings of surprise. Our study shows that predicting the effect of sounds that differ in expression on the complete product expression is difficult. In one case, a difference in the expression of sound was reflected in the expression of the complete product: when the Clatronic juicer was presented with a 'cuter' sound, this juicer was evaluated as 'cuter.' For the Pelican dust buster, however, this effect was not found.
Note that we have used a limited set of products in this experiment with relatively complex sounds. We chose to use electronic products, because users report that sound is relatively important during usage for such products (Schifferstein, 2006). However, this may reflect the importance of sounds for the product's functional use and may not necessarily reflect the role of sound in the product's expression. For other product categories and for simpler sounds, the sound might influence the expression of the product to a larger extent. However, more research is necessary to investigate the different roles sounds can play in the overall expression of products.
As for the element of surprise, in one instance, we found that a sound evaluated as less fitting with the product evoked stronger feelings of surprise than a sound that fits the product. Apparently, people have expectations on how a product will sound. If designers have sufficient insight into these expectations, they can cater to them and either avoid or create surprise reactions.
The complexity of the sounds generated by the products in our experiments may have been of influence on the feelings of surprise. The sounds tested were based on the interaction among multiple parts made of various materials. Although people are in many cases capable of determining the size, the material, or the texture of an object when they hear its sound (Klatzky, Pai, & Krotkov, 2000; Kunkler-Peck & Turvey, 2000; Lederman, 1979), forming an expectation of how complex products will sound during usage may be too complicated, especially since most interacting parts cannot be seen. This may lead to fuzzy, uncertain expectations about how the product will sound, making it less plausible that a surprise will occur. People are possibly better capable of forming expectations of sounds if these are produced by simpler (interactions of) objects. For example, in the design and evaluation of haptic controllers, O'Modhrain and Essl (2004) obtained surprise reactions by manipulating the sounds of direct interactions with simple objects, such as touching pebbles in a box and grains in a bag.
Designing Product Sound
The results of the experiments show considerable differences. In Experiment 1, we found six differences in the expressions of NF- and F-sounds (Table 3). In the pre-test of Experiment 2, only 2 of these were replicated (Table 4). Nevertheless, our analysis of how perceived sounds differed from what people expected to hear in the main study of Experiment 2 showed that for three products, the F- and NF-sounds differed on one or two of the sound properties that were evaluated (Table 5). However, only for one product did this difference result in a difference in product expression.
Apparently, our sound manipulations for Experiment 2 were not as accurate or strong as those for Experiment 1. The different software packages that we used may have been responsible for these differences in manipulations. To manipulate sounds, a range of software packages can be used that differ in complexity, options, and applicability (see Bernardini, Cirotteau, Ekanayaka, & Glorioso, 2004). Product designers can effectively use such software packages in the early stages of designing a sound, because in most cases sounds are easily manipulated using these tools. However, selecting the proper application to perform the task at hand may not be as easy. Different software packages use various theoretical frameworks for thinking about sound and hearing, which leads to different types of manipulation options. Although the types of manipulations that reflect accepted theory in psychoacoustics are often standardized (Gaver, 1997), exchanging files between different software packages (or even between different versions of the same package) or using files on different computer platforms is often not possible (Bernardini & Rocchesso, 2002). Analogously, the results of our experiments show that translating a desired sound manipulation to another application can cause unexpected side effects. It will most likely be even more difficult to perform similar translation steps in design practice, where sounds often need to be built up from the interaction of multiple parts of a product and are therefore difficult to predict and control. For comparison, one might think of the translation step that designers are confronted with when they design a visual effect in a 3D modeling software package like Solidworks or Maya: an effect on a virtual 3D model will never look completely the same on the final physical product.
Özcan, van Egmond, and Huijs (2006) argue that to design product sounds both time and cost effectively, the desired characteristics of the sounds should be defined early in the design process and developed in an iterative process together with other aspects of the product, such as the appearance of the product and the selection of its sound producing parts. A strong benefit of this approach is that the sound will not just be consequential and a complete surprise for product designers at the end of the process. Instead, developing the sound becomes an integral part of the complete product design. We support such an approach and would like to stress the importance of testing the effects of the different sounds that are created. Our study indicates that during unavoidable translation steps in the design of a product sound, consequential subtle differences in sounds can alter the desired effect of the sound. Therefore, predicting the effects the sounds will eventually have on the product's expression is difficult. This makes an iterative process of creating sounds, (re)producing components, and testing sounds and products essential.
Conclusion
In accordance with previous studies (e.g., Lageat et al., 2003), the present study found that different sounds are perceived to have different expressions. Theories on sensory synergy suggests that making all sensory messages congruent with the intended overall experience may lead to more preferred products (Hekkert, 2006; Lindstrom, 2005). If this is indeed the case, designers can certainly benefit from designing congruent sensory messages. However, further research has yet to prove this claim.
We have illustrated how the sound of a product can influence the overall perceived expression of that product. However, our findings were not always consistent, and we are far from answering the question of how the different senses work together when people evaluate products. What our experiments do show is that this issue is of great importance for designers. Different types of sensory information are always present in a product. Knowledge of how people use and combine this information can help designers understand how to capitalize on all the sensorial aspects of the products that they design. Extensive research, using a variety of products with controlled manipulations as stimuli, can eventually be very useful for designers in creating multi-modally designed products.
Acknowledgements
This research was supported by MAGW VIDI grant number 452-02-028 of the Netherlands Organization for Scientific Research (N.W.O.) awarded to H.N.J. Schifferstein.
We thank Samantha Hosea and Hein Bles for their assistance in manipulating the sounds and in carrying out the experiments. Furthermore, we thank Paul Hekkert and René van Egmond for their thoughtful comments on an earlier version of this manuscript.
References
- Ballas, J. A. (1993). Common factors in the identification of an assortment of brief everyday sounds. Journal of Experimental Psychology: Human Perception and Performance, 19(2), 250-267.
- Bernardini, N., Cirotteau, D., Ekanayaka, F., & Glorioso, A. (2004). Making sounds with numbers, six years later. In G. Evangelista & I. Testa (Eds.), Proceedings of the 7th International Conference on Digital Audio Effects (pp. 350-355). Naples: DAFx'04.
- Bernardini, N., & Rocchesso, D. (2002). Making sounds with numbers: A tutorial on music software dedicated to digital audio. Journal of New Music Research, 31(2), 141-151.
- Gaver, W. W. (1997). Auditory interfaces. In M. G. Helander, T. K. Landauer, & P. V. Prabhu (Eds.), Handbook of human-computer interaction (2nd ed., pp. 1003-1041). Amsterdam: Elsevier Science.
- Giordano, B. L. (2003). Everyday listening: An annotated biography. Retrieved July 29, 2005, from http://www.soundobject.org/SObBook/SObBook_JUL03.pdf.
- Govers, P. C. M. (2004). Product personality. Unpublished doctoral dissertation, Delft University of Technology, Delft, The Netherlands.
- Govers, P. C. M., Hekkert, P., & Schoormans, J. P. L. (2004). Happy, cute and tough: Can designers create a product personality that consumers understand? In D. McDonagh, P. Hekkert, J. van Erp, & D. Gyi (Eds.), Design and emotion. The design of everyday things (pp. 345-349). London: Taylor & Francis.
- Griesinger, G. A. (1963). Joseph Haydn: Eighteenth century gentleman and genius. Madison, WI: University of Wisconsin Press.
- Hekkert, P. (2006). Design aesthetics: Principles of pleasure in design. Psychology Science, 48(2), 157-172.
- Janlert, L. E., & Stolterman, E. (1997). The character of things. Design Studies, 18(3), 297-314.
- Klatzky, R. L., Pai, D. K., & Krotkov, E. P. (2000). Perception of material from contact sounds. Presence, 9(4), 399-410.
- Kunkler-Peck, A. J., & Turvey, M. T. (2000). Hearing shape. Journal of Experimental Psychology: Human Perception and Performance, 26(1), 279-294.
- Lageat, T., Czellar, S., & Laurent, G. (2003). Engineering hedonic attributes to generate perceptions of luxury: Consumer perception of an everyday sound. Marketing Letters, 14(2), 97-109.
- Lederman, S. J. (1979). Auditory texture perception. Perception, 8(1), 93-103.
- Lindstrom, M. (2005). Brand sense: Build powerful brands through touch, taste, smell, sight, and sound. New York: Free Press.
- Ludden, G. D. S., Schifferstein, H. N. J., & Hekkert, P. (2008). Visual - tactual incongruities in products as sources of surprise. Empirical Studies of the Arts, in press.
- Lyon, R. H. (2003). Product sound quality - From perception to design. Sound and Vibration, 37(3), 18-22.
- O'Modhrain, S., & Essl, G. (2004). Pebblebox and crumblebag: Tactile interfaces for granular synthesis. In Proceedings of the 2004 International Conference on New Musical Interfaces [On-line]. Retrieved March 15, 2007, from http://www.nime.org/2004/NIME04/paper/index.html.
- Özcan, E., & van Egmond, R. (2004). Pictograms for sound design: A language for the communication of product sounds. In Proceedings of the 4th Conference on Design & Emotion [CD ROM]. Ankara: Middle East Technical University.
- Özcan, E., van Egmond, R., & Huijs, E. (2006). An inspirational tool for designing product sounds. In Proceedings of the 5th conference on Design & Emotion [CD ROM]. Göteborg: Chalmers University.
- Sapherstein, M. B. (1998). The trademark registrability of the Harley-Davidson roar: A multimedia analysis. Retrieved July 22, 2007, from http://www.bc.edu/bc_org/avp/law/st_org/iptf/articles/content/1998101101.html#fnB24.
- Schifferstein, H. N. J. (2006). The relative importance of sensory modalities in product usage: A study of self-reports. Acta Psychologica, 121(1), 41-64.
- Tolman, E. C. (1932). Purposive behavior in animals and men. New York: Appleton-Century-Crofts.
- van Rompay, T., Hekkert, P., Saakes, D., & Russo, B. (2005). Grounding abstract object characteristics in embodied interactions. Acta Psychologica, 119(3), 315-351.
- Zampini, M., Guest, S., & Spence, C. (2003). The role of auditory cues in modulating the perception of electric tooth brushes. Journal of Dental Research, 82(11), 929-932.
- Zampini, M., & Spence, C. (2004). The role of auditory cues in modulating the perceived crispness and staleness of potato chips. Journal of Sensory Studies, 19(5), 347-363.
- Zampini, M., & Spence, C. (2005). Modifying the multisensory perception of a carbonated beverage using auditory cues. Food Quality and Preference, 16(7), 632-641.
