
Understanding Design Utilizations in China: Investigating Design Award-Winning Products Based on Innovation Pyramid Framework
Peiyao Cheng 1,* and Cees de Bont 2
1 Design Department, School of Social Sciences and Humanities, Harbin Institute of Technology (Shenzhen), P.R. China
2 School of Design and Creative Arts, Loughborough University, United Kingdom
Learning from developments in other countries, Chinese firms heavily invest in design to develop products with differentiated advantages to upgrade their value chains. This research investigates Chinese firms’ design utilization performance by analyzing award-winning products in the past decade. Specifically, we first investigate on what level leading Chinese companies utilized design. Through a content analysis based on the jury’s comments on each award-winning product, results show that Chinese companies mainly utilized the functional and styling roles of design. Next, we further investigate the competitiveness of Chinese firms’ utilization of design in Chinese markets and non-Chinese markets. The comparison of consumers’ evaluations of selected award-winning products was conducted between products from leading Chinese brands and international brands. Results showed that in Chinese markets, consumers evaluated products from Chinese brands more positively than the international ones on all four dimensions (i.e., aesthetics, usage, meaning, and typological). In non-Chinese markets, represented by Dutch markets, western consumers evaluated international brands more positively than Chinese brands overall as well as on the dimension of meaning. Taken together, this research indicates that leading Chinese firms mainly utilize the styling and function roles of design. In terms of competitiveness of design utilization, Chinese firms are competitive on products’ aesthetics and usage, both at the national and international levels. They, however, lack the ability to leverage design at the international level through generating new meanings.
Keywords - Chinese Design, Consumer Evaluation, Innovation Pyramid Framework, Product Differentiation, Value of Design.
Relevance to Design Practice – Chinese firms and policymakers can use the findings to utilize strategic roles of design. Western firms can benefit from understanding their design strengths and weaknesses compared to leading Chinese firms in China and in their home markets.
Citation: Cheng, P., & de Bont, C. (2022). Understanding design utilizations in China: Investigating design award-winning products based on innovation pyramid framework. International Journal of Design, 16(3), 115-130. https://doi.org/10.57698/v16i3.07
Received January 07, 2022; Accepted December 10, 2022; Published December 31, 2022.
Copyright: © 2022 Cheng & de Bont. Copyright for this article is retained by the authors, with first publication rights granted to the International Journal of Design. All journal content is open-accessed and allowed to be shared and adapted in accordance with the Creative Commons Attribution 4.0 International (CC BY 4.0) License.
*Corresponding Author: chengpeiyao@hit.edu.cn
Peiyao Cheng is an Assistant Professor in the Design Department in the School of Social Sciences and Humanities at Harbin Institute of Technology (Shenzhen), China. Her research focuses on the intersection of product design and consumer behavior to explore the values and influences of design. Her research areas include consumer adoption of intelligent products, product design and consumer behavior, and visual marketing. She has published her works in such journals as the International Journal of Design, Design Studies, Journal of Engineering Design, Journal of Design Research, International Journal of Research in Marketing, and Journal of Retailing and Consumer Service.
Cees de Bont is currently the Dean of the School of Design and Creative Arts at Loughborough University, UK. Previously, he took up the deanship in the Faculty of Industrial Design Engineering of the Delft University of Technology in the Netherlands and the School of Design of the Hong Kong Polytechnic University. His research interests include early product-concept testing, consumer behavior, innovation adoption, and networked innovation. Among other journals, he has published in the International Journal of Design, Design Studies, Design Issues, Journal of Product Innovation Management, Journal of Engineering Design, She Ji, and Journal of Design, Business and Society.
Introduction
In the recent decade, increasing evidence has shown that design has become an indispensable driver for developing products with competitive advantages (D’Ippolito, 2014; Roy & Riedel, 1997). Along the new product development (NPD) process, the effective integration of design contributes to consumers’ responses to products (Yamamoto & Lambert, 1994), a product’s financial performance (Ravasi & Stigliani, 2012), and a brand’s identity (Beverland, 2005). Design can even mediate technological advancements and value creation (Chesbrough & Rosenbloom, 2002), contributing to a country’s economic growth. Many decades ago, Japan published effective state policies in establishing design competencies and encouraging their application, which turned out to be an integral part of the success of Japanese products in international markets (Heskett, 2017). Later, Korea followed this successful example and developed a strategic plan for design promotion (Chung, 1998).
When design is integrated into the NPD process, design can play different roles, including design as styling, design as process, and design as strategy (De Mozota, 2006). When design is utilized as a styling tool, designers are only involved in one stage of the NPD process, most of the time, the production and launch stage (Roper et al., 2016). As a result, the created products mainly differentiated aesthetically to satisfy different consumer segments. When using design as a process tool, companies integrate design in multiple stages in the NPD to facilitate knowledge sharing (Lawrence & McAllister, 2005) and improves creativity (Christiansen & Varnes, 2009), resulting in products with superior usability and functionality (Roper et al., 2016; Chiva & Alegre, 2007; De Mozota, 2006). On top of this, beyond design as styling and design as process, a company can leverage design as strategy, which can stimulate innovation (Jevnaker, 2000; Verganti, 2009).
Leveraging design’s different roles is a valuable way for companies to transform from low-level to high-level competition (Heskett, 2008). The difficulty of utilizing design’s different roles differ. The utilization of the styling role is relatively easy because it considers design as a functional activity and integrates design in one stage of NPD. In comparison to the styling role, the utilization of design as process becomes more difficult because it demands the integration of design along multiple stages of NPD (Roper et al., 2016; Chiva & Alegre, 2007; De Mozota, 2006), which requires that companies have a comprehensive understanding of design. The utilization of design as strategy can be significantly more challenging because it requires design as a central role in an organization (De Mozota, 2006). Companies need to integrate design into a company’s operations deeply, including management of command and control, management of design leadership, management as managing change, and utilizing design as an essential driver of business strategy (Jevnaker, 2000). The utilization of strategic design can lead to breakthrough innovations and generate considerable profits when appropriately utilized (Verganti, 2009).
China is in the middle of the transition of upgrading value chains (Liu, 2016), and design has been considered a way to achieve this transition. China started its manufacturing industry in 1978, at the beginning of the Open Policy. Due to the lack of technological capabilities, Chinese firms were initially mainly involved in the Original Equipment Manufacturer (OEM) business (Liu et al., 2018). Even when Chinese firms attempted to establish new brands and develop new products, they adopted imitation strategies more often than innovation strategies (de Bont & Liu, 2017). Consequently, products developed by Chinese firms lacked differentiated advantages and thus were often labeled as copycat products (Akdeniz Ar & Kara, 2014). However, the situation has been changing. With the basic technical knowledge acquired through OEM, Chinese firms attempted to move to value-added business, and they were involved in different activities to improve their technological and innovation capabilities, including adopting production lines from overseas, benefitting from consultancy services, and investing in design (Liu et al., 2018). The national government has realized the necessity and urgency of value chain upgrades, and they published the national policy of Made in China 2025 to transform from Made in China into Created in China, where design has been highlighted as the vital engine to achieve economic advantages (Liu, 2016; Lu, 2013).
Against this background, several Chinese brands heavily invested in design, and they have successfully utilized design to achieve market success. For example, Lenovo’s design and user experience team won the Reddot design team of the year 2013, which was the first time a Chinese firm was awarded for its design capability (Reddot, 2013). As a result, Lenovo has become a market leader in domestic markets, and they even take market shares from rivals in Europe and the USA. Another Chinese brand, Huawei, also recognized the values of design and, among other activities, spent extensive efforts on understanding users’ (potential) needs for picture-making with smartphones. Consequently, they developed extraordinary picture-making functions, such as integrating multiple cameras, collaborating with Leica cameras, and involving AI-supported picture optimization (Zhang, 2022). These unique functions quickly became differentiating advantages and attracted consumers. By the second Quarter of 2020, Huawei ranked first in the global smartphone market (Counterpoint, 2020).
The design utilization in Chinese firms also received attention for academic inquiry from different perspectives. More than one decade ago, Heskett and Liu (2009) outlined how Chinese firms utilized design along the NPD process and concluded typical patterns of design management, ranging from the design by no designers, design by external designers, and styling-focused design to firms being design-oriented. This study further suggested the paths for companies to improve their design capability: inviting external designers or acting design followers at first, then cultivating design awareness within the organization, and finally utilizing design on the strategic level. Moreover, Heskett and Liu (2009) indicated that to move design as styling to design as process or strategy, the integration of design activities with other activities in NPD is important. Zhang et al. (2011) specifically investigated how Chinese firms integrate design activities and marketing activities in the NPD process. Results showed that Chinese firms suffered from integrating design and marketing activities along all the stages of the NPD process, resulting in a largely discounted NPD performance.
Furthermore, several studies investigated how Chinese firms understand and utilize the strategic role of design (de Bont, 2016; de Bont & Liu, 2017; Liu & de Bont, 2017). These studies pointed out the specific barriers for Chinese firms in utilizing the strategic role of design, including consumers’ sensitivity to prices and the lack of brand loyalty, the designers’ lack of multidisciplinary backgrounds, the lack of strategic designers, the lack of appropriate industry policy, and the lack of suitable methods. Despite the challenges and difficulties, there are several companies that utilize design’ strategic role successfully. Liu and Rieple (2019) explored how a start-up company utilized design in knowledge-economy contexts effectively and eventually became a market leader in China.
In summary, many Chinese firms have recognized the value of design and have shown great interest and efforts in investing in design. Academic research also echoed this by investigating how Chinese firms utilize design (Heskett & Liu, 2009), what barriers Chinese firms encounter in effectively utilizing design, and the specific roles of design (e.g., strategic role of design; de Bont & Liu, 2017), and how to better utilize design in knowledge-economy context (Liu & Rieple, 2019).
Although these studies help us gain an overview of Chinese firms’ utilization of design in general, however, we still lack a detailed understanding of the performance of design utilization in Chinese firms. This research aims to fill in this gap by investigating design utilization performance in award-winning Chinese firms. Specifically, two research questions are proposed: 1) on what levels (i.e., design as styling, process, strategy) do Chinese firms utilize design? 2) in comparison to leading international brands, how well do Chinese firms utilize design on each level and in general? To address the above questions, this research first reviews the literature on design utilization performance. Specifically, this research reviews two perspectives on assessing the design utilization performance (i.e., process and outcome) and employs the Innovation Pyramid Framework (Rampino, 2011), which links design strategy to design outcomes. Next, the research design is presented, which includes a qualitative content analysis of the jury’s comments for award-winning products based on the Innovation Pyramid Framework (Study 1) and a quantitative study to compare consumers’ evaluations of selected award-winning products in Chinese (Study 2a) and non-Chinese contexts (Study 2b).
Literature Review
Assessing Design Utilization: Process vs. Outcome View
Current literature concludes two views assess companies’ design utilization performance (Candi & Gemser, 2010). One line of studies considers design as an activity, which refers to a range of activities in NPD to create products to be launched in markets (e.g., Candi, 2010; Candi & Saemundsson, 2011; Chiva & Alregre, 2007; Gemser & Leenders, 2001; Hertenstein et al., 2005). Following this view, in which design is viewed as activities along the NPD process, design utilization is mainly assessed by the efforts that companies’ investments in design-related activities (design emphasis) and companies’ abilities in conducting design-related activities (design capability). The involvement of design activities or designers along the NPD process can be used as indicators. Extensive studies follow the process view to investigate design utilization in various contexts, such as Irish manufacturers (Roper et al., 2016) and start-up technology companies in Hong Kong (Liu, 2021).
Another line of studies views design as outcomes resulting from the NPD process (e.g., Moody, 1984; Roy & Potter, 1990, 1993; Roy & Riedel, 1997; Talke et al., 2009; Walsh et al., 1988). In line with this outcome view, design utilization performance can be assessed through measuring the quality of design outcomes. Different indicators exist in the literature to assess the quality of design outcomes (Candi & Gemser, 2010), such as financial performance (Candi, 2010), consumer evaluations (Goodrich, 1994), and peers’ or experts’ opinions (Hertenstein et al., 2005; Platt et al., 2001). Financial performance is considered the most objective indicator, especially audited financial data (Henard & Szymanski, 2001). However, a product’s financial success relies not merely on its design but also on other factors (e.g., marketing strategy). Peers’ and experts’ evaluations can provide more comprehensive insights than financial data, including a product’s performance on multiple aspects (e.g., aesthetics, usability, functionality), possible short-term and long-term benefits, as well as differentiated advantages. Particularly, reports of design awards are a unique way of capturing expert evaluations. These reports signal the excellent quality of product designs recognized by experts in the jury (Self, 2014). Consumer evaluations are also important indicators for measuring the qualities of design outcomes because they link to consumers’ purchase behavior and predict a product’s market success to some extent. Considering the benefits and limitations held by each way of measuring, it is recommended to use the combination of different indicators to measure design utilization performance for high reliability and validity (Candi, 2016; Candi & Gemser, 2010).
Innovation Pyramid Framework: Linking Design Utilization Level and Design Outcomes
On what level a company utilizes design can not only be learned from investigating how design is embedded in the NPD process but also from examining the design outcomes. Research efforts have been paid to build the links between design utilization level and design outcomes. Rampino (2011) established the Innovation Pyramid Framework (see Figure 1), which proposes that designers can utilize three levers (i.e., form, technology, mode of use) and generate four types of innovations (i.e., aesthetic, usage, meaning, typological innovations). Design lever is a metaphorical description of how designers exert influence on product development. Rampino (2011) recognizes three levers that designers often use: form, mode of use, and technology. When using the design lever of form, designers aim to create a new form to express a product aesthetically or a new design language to change its meanings. With the lever of mode of use, designers dive into users’ contexts to uncover the unmet users’ needs and create products that can satisfy users’ needs in better ways. Through the lever of technology, designers pull off innovative ideas by applying a product technology or a process technology to a product or product category.
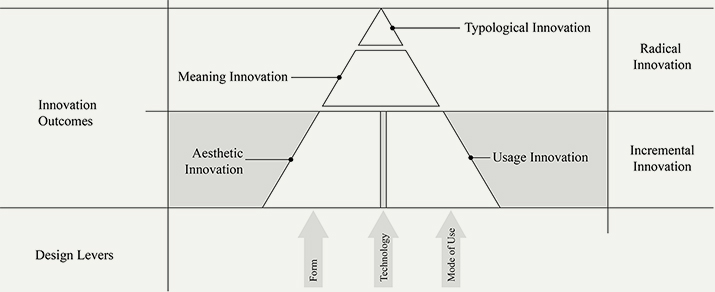
Figure 1. Innovation Pyramid Framework (Rampino, 2011).
Innovation Pyramid Framework further states that the different manipulations of design levers result in four types of product innovation: aesthetic innovation, usage innovation, meaning innovation, and typological innovation (Rampino, 2011; see Figure 1). Aesthetic innovation mainly relates to the innovations in a product’s morphological attributes. It relates to a product’s recognition at first sight. Usage innovation mainly refers to how a user interacts with a product. Usage innovation often includes improvements in usability and functionality. The meaning dimension goes beyond product semantics, and it captures the meaning that consumers attribute to a product (Verganti, 2009). It relates to the reflective level of design (Norman, 1988) and the emotional appeal that a product communicates (Ulrich & Eppinger, 1995). The typological dimension relates to the level of innovativeness (Garcia & Calantone, 2002). A product can be highly innovative and largely deviate from its category archetype. The aesthetics, usage, and meaning dimensions can jointly contribute to the typological dimension. For instance, the aesthetics of an innovative product (e.g., Dyson vacuum cleaners) contributes to the typological dimension when the new product looks markedly different from the category archetype. In comparison to developing aesthetic and usage innovation, developing meaning and typological innovation can be much more challenging. According to Rampino (2011), the percentage of each type of product innovation fits a pyramid shape (see Figure 1). The majority of product innovations generated by companies are aesthetic and usage innovations, occupying around 65% to 70%. Meaning innovation occupies 20%, while typological innovation only occupies 10%. Thus, meaning and typological innovation can be more innovative than aesthetic and usage innovation. Radical innovations are more likely generated from meaning and typological innovation.
This framework further points out the correspondence between the usage of design levers and design outcomes (Rampino, 2011). Specifically, the form lever results in aesthetic innovation. The mode of use lever leads to usage innovation. The technology lever can lead to both aesthetic and usage innovation depending on specific contexts. As for meaning innovation and typological innovation, they require the utilization of two (i.e., form and technology, mode of use and technology) or three levers (form, mode of use, and technology) together.
In Innovation Pyramid Framework, the links between design levers and design outcomes have been established (Rampino, 2011). We further build the links among design utilization level, design levers, and design outcomes (see Figure 2). As indicated by Rampino (2011), direct correspondences exist between form lever and aesthetic innovation as well as between mode of use lever and usage innovation. Therefore, when design is used as a styling tool, the design lever of form will be mainly used, resulting in aesthetic innovation. The lever of form can also be combined with technology when companies need to create differentiated forms to communicate the unique selling points of advanced technology. In this case, companies mainly deal with aesthetic differentiation, and they only integrate design in one specific phase of NPD. Furthermore, when design is utilized as process, the design lever of mode of use is mainly used. The lever of technology can also be combined because the usage innovation requires the support of technology. When utilizing design as process, companies need to integrate design with other NPD activities to deal with product usability and experience. In addition, when design is used strategically to drive innovations, companies need to use more design levers and utilize them more flexibly, such as the combination of different combinations. Designers play active roles in multi-functional teams (Roper et al., 2016), and companies need to integrate design in NPD more prominently, deeply, and centrally. Therefore, by analyzing design outcomes, we can gain insights into companies’ design utilization levels.
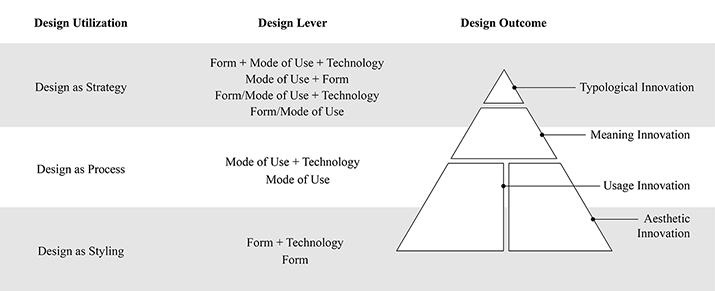
Figure 2. The links among design utilization level, design lever, and design outcomes.
Based on the established links among design utilization levels, design levers, and design outcomes, we are able to fulfill the research goal of understanding design utilization performance in Chinese firms. Different from previous studies on how Chinese firms utilize design (Heskett & Liu, 2009; Liu & de Bont, 2017; de Bont & Liu, 2017; Liu & Rieple, 2019), this research aims to learn more about the quality of design outcomes. Thus, we take the outcome view to assess design utilization by examining design outcomes of leading Chinese firms: the products that won design awards. Award-winning products serve as a proxy for excellent design quality (Xia et al., 2016). The receipt of design awards indicates the appreciation by experts based on pre-established criteria. Award-winning products also reflect that companies are aware of design’s value, and they are equipped with the capability of utilizing design effectively. Thus, award-winning products are proper research subjects, which makes it possible to further investigate what level of design is utilized and the competitiveness of design utilization. Using award-winning products/service as research subjects have been successfully used in current literature (Xia et al., 2016; Zhan et al., 2021), and thus the validity has been ensured.
Two studies are conducted to address the two proposed research questions. Specifically, Study 1 attempts to address the first research question of on what levels (i.e., design as styling, process, strategy) award-winning Chinese firms utilize design through conducting a content analysis of jury’s comments for award-winning products developed by Chinese firms. Specifically, the jury’s comments for award-winning products were collected. Then, a content analysis was conducted based on the Innovation Pyramid Framework, resulting in view of the levels at which award-winning companies utilize design. Next, Study 2 tackles the second research question of how well award-winning Chinese companies utilize design through comparing consumers’ evaluations of selected award-winning products developed by Chinese brands and those developed by leading international brands.
This investigation can extend previous conceptual works by obtaining empirical evidence on the design utilization performance in Chinese firms (de Bont & Liu, 2017; Liu & de Bont, 2017). Through mixed research methods, the research can reveal what levels design has been utilized in Chinese companies and how well they perform in comparison to their international competitors. The results can also provide actionable implications for design practice and policymakers. Moreover, following the observations of Heskett (2017) on the role of design in Japan’s and Korea’s economic growth in the 1980s when the industrial economy, as one of the paradigms described by Gardien et al. (2014), was dominant, this research, in contrast, focuses on China, a fast-growing economy in an era that moved beyond the industrial economy to the experience-, knowledge-, and transformational economy. The results provide insights into the relationships between design and economic growth and deepen our understanding of the nature of design’s value in the current progressive paradigms. These results may be helpful for other developing countries in the same way that Japan inspired Korea and Taiwan in the past.
Study 1: Assessing Design Utilization Levels of Chinese Firms
Methods
To fulfill the research goal, we conducted a content analysis based on the jury’s comments for award-winning products developed by Chinese brands. Specifically, among various design awards, we first considered the best four international design awards: iF, IDEA, Reddot, and Good Design award (Self, 2014; Sung et al., 2010). Good Design was not selected because it does not include international juries. As these design awards are organized through expert selection, the cultural background of the jury is highly important. IDEA was not included because it considers business performance in its selection criteria. As this research focuses on design utilization performance, we intend to focus on the utilization of design and avoid the consideration of business performance. As a result, we selected Reddot and iF design awards in this study.
Data Collection
Prior to collecting award-winning products, we first scanned the general information related to iF and Reddot awards from 2010 to 2020. For iF award, there are two awarding categories: iF award and gold award. For Reddot award, three awarding categories are included: Best of Best, honorable mention, and Reddot awards. For iF and Reddot awards, the chances of winning awards are around 30%, while the percentages for winning the highest awards remain 1%-2%. The detailed information can be found in the Appendix. Both awards invited a large group of jurors who were professionals and experts from different countries. Multiple-stage jury process was used in both awards (Sung et al., 2010; Zec, 2007). In the first stage, jurors evaluated each submitted entry and ranked them. Only a part of the entries will be selected and entered the next stage. In the next stage, the jury carefully assessed all the selected entries based on given criteria. They are also asked to give detailed and informative feedback on these entries in the final stage. Therefore, as the jury’s comments explain how the design is qualified to win the design awards, they can be used for conducting content analysis.
Next, from iF and Reddot design award’s official website, we collected award-winning products that were developed by Chinese firms. We collected basic information related to these products, including product names, manufacturer information, and jury’s comments. From the iF design award official website, we collected the award-winning products developed by Chinese brands from the most recent decade, from 2010 to 2020. For the Reddot awards, the record was available from 2012 to 2020. As a result, we collected 2126 products with Reddot awards and 2358 with iF awards, resulting in 4484 award-winning products in total.
Data Processing
The content analyses were performed deductively through following the Innovation Pyramid Framework (Rampino, 2011) as a coding schema.
Specifically, two researchers who were unaware of the research goals were asked to code the jury’s comments for all award-winning products. The Innovation Pyramid Framework was first presented and explained to them. They were asked to use it as the coding scheme. Examples of the jury’s comments that would fall into each code were provided to them. When the jury comments mentioned functional or usability improvements, the code of usage innovation was given. When the comments covered styling and design language, the code of aesthetic innovation was assigned. When the jury’s comments included more than one dimension, several codes were given. For example, for a speaker, the jury’s comment was, “the two-part solution of the h-E5 shows a coherent design and is a clever way to attach the speaker to objects.” This comment mainly mentioned the usage of the speaker, so the code usage was given. For a mobile charging station, the jury commented: “the AnkerBox is based on an innovative idea: using it is as straightforward as its minimalist appearance.” As this comment mentioned both using and appearance, we assigned both codes of aesthetic and usage.
Two researchers were asked to code the jury’s comments independently. After they finished coding, their results were initially reviewed and compared. The inconsistent codes were discussed until agreements were achieved. The final codes were used as results for further analysis.
Results
Based on the results of content analysis, we counted the prominent design utilization levels for each year, and the results can be found in Figure 3. It can be clearly seen that Chinese firms’ performance has improved dramatically in terms of winning design awards in this decade. In terms of Reddot awards, at the beginning of the 2010s, only around 50 products were awarded. This amount went up ten times in 2020. This change directly reflects the investments that Chinese firms made in design and the subsequent improvements in the design outcomes. A similar pattern can be found in winning the iF awards from 2010 to 2020.
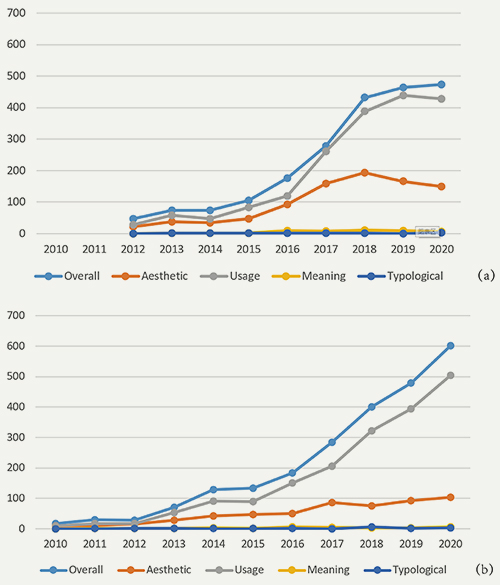
Figure 3. Results of content analysis: The number of award-winning products resulting from different design utilization levels (a) products that won Reddot awards, (b) products that won iF awards.
As for the design utilization levels, different patterns emerge. We calculated the percentage of each design utilization level manifested in the award-winning products (see Table 1). In the past decade, among the various design utilization levels, usage innovation appeared to be dominant, followed by aesthetic innovation. More specifically, the importance of the aesthetic dimension gradually decreased in the past ten years, from 59% in 2011 to 23% in 2020. The importance of the usage dimension increased from 53% in 2010 to 87% in 2020. The decreased importance of the aesthetic dimension and the increased importance of the usage dimension reflect the increased understanding in Chinese companies of the role of design. In 2015, the number of usage innovations took off, while the number of award-winning products capitalizing on aesthetic innovation remains similar. This coincides with the launch of the national policy of Made in China 2025 in 2015, which signals the recognition of design’s higher-level value, such as design as process and design as strategy.
Table 1. The weight of four dimensions in earning design awards quantified by percentage across ten years.
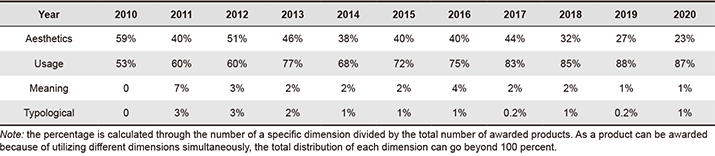
However, regarding the meaning and typological dimensions, the number of such design innovations still remained limited across the past decade. The weight of these innovations becomes even lower in 2020 (1% for meaning and typological dimension) in comparison to 2011 (7% for meaning dimension, 3% for typological dimension). The reduced weight of meaning and typological dimension is mainly caused by the increase in the total amount of award-winning products. In other words, the total number of products that exhibited meaning and typological innovations remained similar across the past ten years, but the total number of award-winning products dramatically improved.
Discussion of Study 1
Study 1 performed a content analysis of jury’s comments based on the Innovation Pyramid Framework. The results revealed that the majority of products were awarded because of improvements to the aesthetic and usage dimensions, while a few products were awarded because of meaning and typological innovations. These results suggest that, in the past ten years, the award-winning products mainly resulted from utilizing the functional and aesthetic roles of design. Limited numbers of award-winning products resulted from using the strategic role of design. If we compare these results with the design utilization level in Italian companies (Rampino, 2011), the utilization of the meaning and typological levels is 20% and 10%, respectively. This also suggests the limited usage of design’s strategic role in Chinese companies.
Although the results show the increasing number of award-winning products in Chinese firms in the last decade, the significant increase might be caused by a large number of manufacturers and design students in China. In the past decade, SMEs boosted in China and companies faced increasingly fierce market competition. Companies are encouraged to participate in design competitions to demonstrate their capabilities and gain international recognition. In other words, the increasing number of award-winning products reflects the huge efforts invested in design, but the competitiveness of design utilization remains unknown. Moreover, despite these results showing the emphasis that Chinese companies paid to design and on each role of design, however, the competitiveness of these innovative products in the marketplace remains unknown. In other words, we learned on what levels leading Chinese companies to utilize design, but how well these companies utilize design remains unknown. To address this, Study 2 is conducted to learn how competitive award-winning products developed by Chinese brands are in comparison to leading international brands.
Study 2: Assessing the Competitiveness of Design Utilization
To learn the competitiveness of products developed by Chinese firms, we compared consumer evaluation of award-winning products developed by leading Chinese firms and award-winning products developed by leading international brands. As these products are all winning similar design awards, the overall design quality is of a high standard, enabling us to conduct a comparative study. We conducted this comparison in Chinese markets (Study 2a) and in Western markets (Study 2b).
Study 2a: Comparing Chinese Consumers’ Product Evaluations between Chinese and International Brands
Methods
Experiment Design and Participants
A 2 (product origin: Chinese brands vs. international brands) × 4 (product category: smartphone, cleaning robot, TV, and washing machine) survey was designed, with product origin as a between-subject factor and product category as a within-subject factor. Participants were randomly assigned to one of the two conditions. They were either presented with products from Chinese brands or products from international brands. They were asked to evaluate four products. The presentation of four products was randomized.
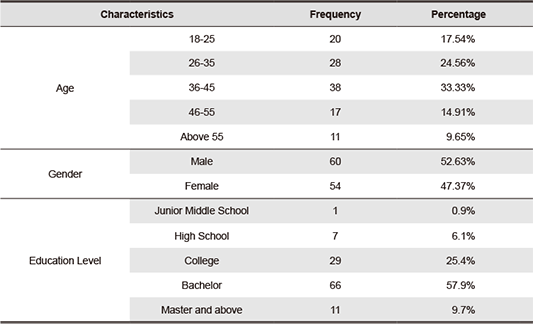
One hundred and fourteen participants were invited from a consumer panel. We invited participants from Tier 1 and Tier 2 cities to ensure they were frequently exposed to both Chinese and international brands. We also require participants’ demographic information to be similar to the general population in China. Next, a simple random sampling strategy was used. The descriptive analysis can be found in Table 2.
Table 2. Characteristics of participants in Study 2a.
Stimuli
We collected stimuli products from the collections in Study 1. We included four product categories to improve the generalizability of the findings. Four product categories were collected: smartphones, cleaning robots, TVs, and washing machines. These product categories are used for different purposes and different contexts. These product categories have a relatively high market penetration. As a result, consumers have a certain level of knowledge and expertise on these products, which ensures that they can evaluate these products. Next, four products were selected for each product category: two products from Chinese brands and two products from international brands, resulting in 16 products in total. While presenting products to participants, we included product picture(s), functional descriptions, and the country of origin of the product. It was clearly stated for each product whether the specific product came from a leading Chinese brand or a leading international brand.
Measurements
To measure consumer evaluations of product designs, different scales exist in the marketing research and design literature (Gielens, 2012; Homburg et al., 2015; Moon et al., 2015; Rampino, 2011). These scales share similarities in capturing consumers’ overall evaluations of product designs but differ in the specific dimensions’ numbers and contents. For instance, Gielens (2012) developed a three-dimensions scale to characterize a new product: intrinsic, extrinsic, and usage benefits. Intrinsic benefits relate to integrated technology and product functionality. Extrinsic benefits refer to the visible parts of a product, such as product appearance. Usage benefits are mostly about a new way to use a product, such as extending a product to a new usage context. Similarly, Moon et al. (2015) identified aesthetics, (functional) features, and ergonomics as three dimensions that capture consumers’ evaluations of a new product. Differently, the three-dimensions scale developed by Homburg et al. (2015) excludes the usability dimension but includes the symbolism dimension. The symbolism dimension relates to the messages that a product expresses regarding a consumer’s image (Belk, 1988; Bloch, 2011). Additionally, from a design perspective, the Innovation Pyramid Framework concluded four types of differentiated advantages that a product can provide: aesthetic, usage (aka innovation of use), meaning, and typological advantage. The meaning dimension, however, is a new aspect identified by Rampino (2011).
Because of the comprehensiveness of the Innovation Pyramid Framework, we followed this one. Specifically, consumers’ overall evaluation was measured by asking participants to respond to the question “how do you feel about this product?” by indicating their answers based on bad/good, negative/positive, unfavorable/favorable, dislike/like (α ranged from 0.90 to 0.94). Consumer evaluations of the aesthetic dimension of products were measured by asking participants to indicate to what extent they agree with the following statements: “The product is easily recognizable,” “The product introduces a new look,” and “The features of the product are presented in a new way” (α ranged from 0.87 to 0.92). The usage dimension was measured by 1) “The product is intuitive to use;” 2) “The product introduces new functions;” 3) “The product offers new features,” and 4) “What do you think of the technology integrated into the product? Not novel/very novel” (α ranged from 0.90 to 0.93). The meaning dimension was measured by the following three statements: 1) “The product is considered a status symbol;” 2) “The product is exciting,” and 3) “The product introduces new meaning to the product category” (α ranged from 0.90 to 0.93). The typological dimension was measured by asking participants to respond to the question “How is the product compared with other products in this category?” by answering “Not typical/very typical” and “Not usual/very usual” (r ranged from 0.12 to 0.21). All measures were based on a 7-point scale.
Procedure
The survey was conducted through the online research tool Qualtrics. The questionnaire was first made and tested in English. Next, it was translated into Chinese. Each participant was assigned to one of the conditions: rating products from Chinese brands or products from international brands. Each participant evaluated one product from each product category, resulting in the evaluation of four products in total. The order of presenting products was randomized.
Results
To examine the validity of the adopted measures, we first conducted a confirmatory factor analysis (CFA). Next, ANOVA analyses were conducted to reveal how Chinese consumers evaluate products developed by Chinese firms versus those developed by international firms.
Reliability and Validity of Measures
The internal consistency and convergent validity of the scales to measure consumers’ evaluations of products on aesthetics, usage, meaning, and the typological dimension were investigated by performing a CFA on all items of the latent variables using ML estimation in SPSS AMOS (ver. 24). The results indicated a good fit to the data (χ2/df = 4.38; GFI = 0.909, CFI = 0.960, TLI = 0.943, RMSEA = 0.086, RMR = 0.041). Furthermore, the reliability of each scale was explored by computing the reliability coefficient or Pearson’s correlation (αoverall evaluation = 0.93; αaesthetic dimension = 0.91; αusage dimension = 0.91; αmeaning dimension = 0.92; rtypological dimension = 0.208, p <. 01). Taken together, above indicators suggest that these models present a sufficient degree of reliability and validity.
Consumers’ Evaluation of Products Developed by Different Countries
To further understand consumers’ evaluation of products developed by Chinese brands in comparison to international brands, we conducted a series of ANOVA analyses by using country of origin as the independent variable and consumers’ evaluations as dependent variables. Results showed that country of origin has a significant impact on consumers’ evaluations. Specifically, Chinese participants reported higher scores for Chinese brands than for international brands in terms of overall evaluations [F(1,112) = 11.73, p < 0.05. MChinese_brand = 6.17 vs. Minternational_brand = 5.65], aesthetic dimension [F(1,112) = 6.42, p < 0.05. MChinese_brand = 5.68 vs. Minternational_brand = 5.20], usage dimension [F(1,112) = 8.83, p < 0.05. MChinese_brand = 5.87 vs. Minternational_brand = 5.34], meaning dimension [F(1,112) = 6.50, p < 0.05. MChinese_brand = 5.61 vs. Minternational_brand = 5.10], and typological dimension [M(1,112) = 9.79, p < 0.05. MChinese_brand = 5.17 vs. Minternational_brand = 4.65], suggesting that Chinese consumers generally perceive leading Chinese brands more positively than leading international brands (see Figure 4).
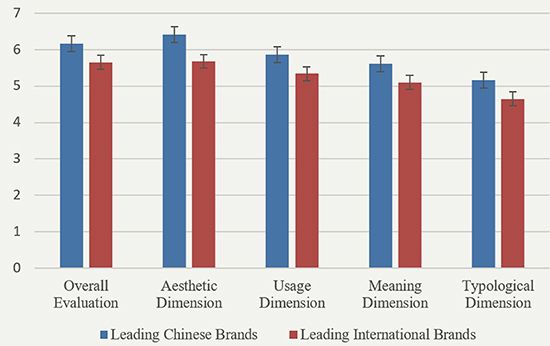
Figure 4. Chinese consumers’ evaluations of products developed by leading Chinese brands and leading international brands.
Discussion of Study 2a
In Study 2a, we compared Chinese consumer evaluations of products developed by leading Chinese and international brands. Results demonstrate the competitiveness of leading Chinese brands. Chinese brands utilize design highly effectively in Chinese markets. They are capable of developing products that are considered superior to leading international brands and provide differentiated advantages on aesthetics, usage, meaning, and typological dimension.
However, although the results reveal a positive evaluation of the leading Chinese brands, we should be careful to conclude that the leading Chinese brands universally outperform leading international brands. Specifically, consumers’ product evaluations can be influenced by ethnocentrism, which refers to the phenomenon that consumers often evaluate products from their own country more positively than foreign products (Booth, 1979; Luque-Martinez et al., 2000). For instance, American consumers evaluate US products more positively, whereas European consumers prefer European products over American products (Bannister & Saunders, 1978). There is evidence showing that Chinese consumers have a high tendency for consumer ethnocentrism, which makes them believe that it is inappropriate to purchase foreign-made products (Hsu & Nien, 2008; Shimp & Sharma, 1987). The high consumer ethnocentrism may trigger Chinese consumers to have more positive evaluations of products from Chinese brands than from international ones. Moreover, prior experience contributes to consumers’ loyalty toward a brand (Ozer, 2011). Leading Chinese brands occupy a much larger market share than leading international brands in Chinese markets. In 2019, Huawei, Xiaomi, Oppo, and Vivo, as examples of leading Chinese brands, occupied more than 80% of the Chinese smartphone market (Counterpoint, 2020). Chinese consumers are more likely to have positive attitudes towards products from Chinese brands because of their prior experience with these brands. Therefore, considering the above limitations, we cannot draw an objective conclusion on the impact of design on the competitiveness of products developed by Chinese brands. It is necessary to conduct an additional study by collecting consumer evaluations in different markets.
Study 2b: Comparing Dutch Consumers’ Product Evaluation between Chinese and International Brands
Study 2b was conducted to overcome the limitations of Study 2a by replicating the comparison in a non-Chinese market. Through conducting the comparison in a non-Chinese market, the influences of ethnocentrism and prior experience can be largely avoided. While selecting an economy to represent the non-Chinese contexts, we had the following considerations. First, we intend to select a well-developed and competitive economy where consumers are frequently exposed to both international brands and Chinese. Second, this study aims to eliminate the ethnocentrism effect, and thus it is important to avoid economies with many consumers of Chinese origin. Third, the selected economy should not hold negative attitudes towards Chinese brands, which may bring confounding effects. Forth, the selected economy should carry fewer varieties. Next, based on the above criteria, we considered Singapore, the U.S., Hong Kong, and the Netherlands, which were the most competitive economy according to the global competitiveness ranking (Schwab, 2019). We did not select Singapore (No.1) and Hong Kong (No.3) because they populate many consumers of Chinese origin, which may bring the confounding effects of ethnocentrism. U.S. (No.2) was not preferred because of its direct competition and trade disputes with China in 2018-2019 when this study was conducted. The trade disputes cause negative attitudes among consumers, which may potentially bring other confounding factors to research results. Thus, we selected the Netherlands, which ranks fourth in the global economy rank. Dutch consumers are open to adopting innovative products (Suriñach et al., 2009) and foreign products (Nijssen & Douglas, 2004), which makes them suitable for this study. The Netherlands is small and simple, which avoids the possible influences of market variability.
Methods
Participants and Design
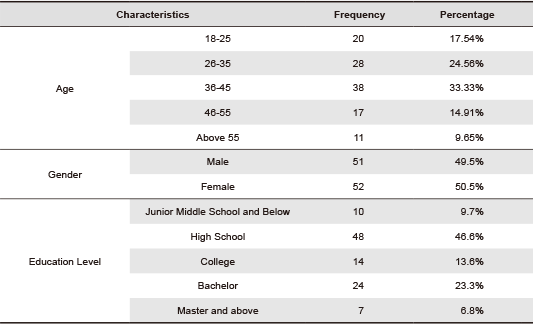
The same survey design and stimuli, as in Study 2a, were used in Study 2b. One hundred and three participants (mean age = 43.92, 49.5% male) were invited from a consumer panel (see Table 3 for details). Participants were collected from the urbanized western part of the Netherlands. Similar to Study 2a, the questionnaire was first made and tested in English. Next, it was translated into Dutch. While distributing the questionnaire, we controlled the sample size and demographic information to create the right balance in age and gender. Study 2b used the identical stimuli, measures, and procedures as in Study 2a.
Table 3. Characteristics of participants in Study 2b.
Results
Similar to data analysis in Study 2a, we firstly analyzed the validity of the measures and then conducted a series of ANOVA analyses. CFA was conducted and the results indicated a good fit to the data (χ2/df = 3.162, GFI = 0.924, CFI = 0.976 TLI = 0.965, RMSEA = 0.073, RMR = 0.092), which suggested that the adopted measures were valid and adequate. Next, a repeated measure ANOVA was conducted with product origin as a between-subject variable and product category as a within-subject variable. In comparison to the Chinese consumers, different results were found for Dutch consumers. Dutch consumers demonstrated higher scores for leading international brands than for leading Chinese brands on overall evaluation [F(1,101) = 5.66, p < 0.05. MChinese_brand = 4.71 vs. Minternational_brand = 5.23] and meaning dimension [F(1,101) = 4.05, p < 0.05. MChinese_brand = 3.79 vs. Minternational_brand = 4.36]. A statistical trend was detected for Dutch consumers’ evaluations regarding the typological dimension [F(1,101) = 3.44, p < 0.1. MChinese_brand = 4.14 vs. Minternational_brand = 4.55]. No significant differences were found in terms of usage dimension (p > 0.1) and aesthetic dimension (p > 0.1) between Chinese brands and international brands (see Figure 5).
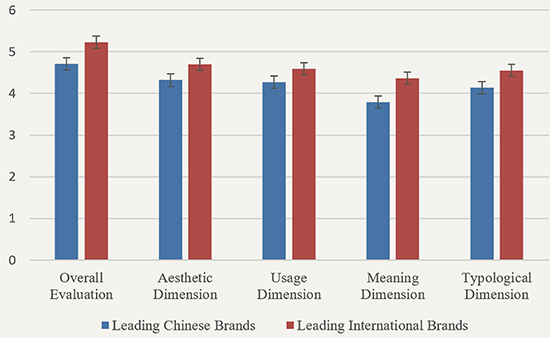
Figure 5. Dutch consumers’ evaluations of products developed by Chinese brands and international leading brands.
Discussion of Study 2b
Through using the same survey design and stimuli, Study 2b revealed different results from Study 2a. In comparison to Study 2a, these results reveal a relatively objective comparison between products from leading Chinese brands and leading international brands by eliminating the influence of the COO effect, ethnocentrism, and prior experience. In general, these results indicate that in the Western market, as represented by Dutch consumers in this study, consumers generally believed that products developed by leading international brands were superior to those developed by leading Chinese brands. The competitive advantages provided by leading international brands are mainly attributed to the meaning dimension. The products developed by leading international brands were perceived as more meaningful than products developed by leading Chinese brands. Dutch consumers also showed a marginally significant positive evaluation on the typological dimension, suggesting that they perceived products developed by leading international brands as slightly more innovative. Dutch consumers did not report significant differences in terms of usage and aesthetic dimensions, indicating that products developed by leading Chinese brands and international brands performed similarly on these dimensions.
Conclusion and General Discussion
This research was driven by the intention to understand Chinese firms’ design utilization performance. Study 1 was conducted to address the research question of on what levels (i.e., design as styling, process, strategy) Chinese firms utilize design. Through a content analysis of the jury’s comments for award-winning products developed by Chinese firms, Study 1 revealed that leading Chinese firms mainly utilized the process role of design, resulting in products that provided usage and functional improvements. At the same time, leading Chinese firms also utilize the styling role of design, leading to products with improvements in the aesthetic dimension. However, leading Chinese firms barely utilize the strategic role of design. Consequently, limited products won design awards because of meaning or typological innovation.
Study 2 was performed to address the research question of how well Chinese firms utilize design on each level and in general, in comparison to leading international brands. Specifically, Study 2 further investigates the competitiveness of products developed by leading Chinese firms by comparing consumers’ evaluations between Chinese brands and leading international brands in Chinese markets (Study 2a) and Western markets (Study 2b). Results show that the competitiveness of products developed by leading Chinese firms is subject to the different dynamics in markets. In Chinese markets, different from two decades ago, when domestic products were considered inferior to foreign brands (Sklair, 1994), leading Chinese companies have demonstrated their capabilities to utilize design to develop products that are as good as or even superior to products developed by leading international brands. Leading Chinese brands can utilize design to create products with differentiated advantages in terms of aesthetic, usage, meaning, and typological dimensions. However, in international markets, represented by Dutch markets in this research, leading Chinese brands do not provide competitive advantages compared to leading international brands. In terms of aesthetic and usage dimensions, products from Chinese brands are nearly on par with international brands. In terms of the meaning and typological dimensions and overall evaluation, however, leading Chinese brands fall behind leading international brands.
As indicated in prior research, products’ differentiated advantages can demonstrate how a firm utilizes design (Rampino, 2011). The results of this study reflect leading Chinese firms’ utilization of design. As for the styling and integration roles of design, Chinese companies understand and leverage them effectively. Consequently, in Chinese markets, leading Chinese firms develop products that are considered superior to products from leading international brands. Although Chinese brands do not demonstrate advantages in leveraging design’s styling and integration roles in the international markets, they do not exhibit any significant disadvantages either. In other words, in both Chinese markets and international markets, leading Chinese firms’ design capability to differentiate themselves through aesthetics and usability is of a high standard and comparable to those of leading international brands.
When it comes to differentiating themselves in international markets by creating products with new meanings or generating new archetypes, however, leading Chinese firms still has a way to go to match the level of design capability of leading international brands. This partially tallies with earlier observations that Chinese firms seem to encounter difficulty utilizing the strategic role of design (de Bont & Liu, 2017; de Bont, 2016). Apparently, the need for Chinese firms to embark on strategic design may not be essential to be competitive in the home market. In contrast, in order to be competitive in Western markets, Chinese firms do need to further build their capabilities in strategic design. Similarly, the leading international companies in this study need to further grow their design capabilities to be more competitive in the Chinese market.
Practical Implications
Currently, Chinese firms invest in design to drive innovation for upgrading the value chains. This research demonstrates that, thus far, Chinese firms have managed to utilize the styling and integration roles of design effectively but only sparsely utilize the strategic value of design. To compete with leading brands in international markets, it is necessary and urgent for Chinese firms to pay more attention to strategic design. The results of this research can provide insights.
First, an awareness of strategic design should be established. For policy-makers, it is possible to establish design support and promotion schemes to facilitate the understanding and significance of strategic design. They could introduce the concepts of strategic design to Chinese firms systematically and convey the successful cases. For managers, while developing business strategies, should be equipped and empowered to go beyond the traditional cost-driven and product-focused mindset. They could position design at the core of their business strategies and carefully consider how to leverage design to generate competitive values. Second, Chinese companies need to acquire relevant strategic design skills (e.g., design thinking and critical thinking). Some high-level strategic design training can be helpful, such as the design thinking courses collaboratively provided by IDEO and Tsinghua University. Companies can also turn to help from external designers and design consultancies for building and utilizing strategic design skills. Third, several design strategies with proven success can also be interesting, such as design-driven innovation (Verganti, 2009), co-creation strategy (Frow et al., 2015), and lead-user analysis (Eisenberg, 2011). Through implementing these strategies in companies, the firms’ understanding and capability of utilizing design can be improved.
These findings also have implications for Chinese brands interested in launching their products in international markets. The cultural context shapes consumers’ aesthetic preferences, behavioral habits, and the meanings encoded in a product. Cultural differences could explain why consumers’ positive evaluations of products from Chinese brands only apply to Chinese markets rather than international markets and why Chinese consumers generally do not prefer international brands. To address this challenge, some cross-culture design toolkits can be helpful. Cultura (Hao, 2019) is such an example, which guides designers and NPD teams to view users in distant cultures through different lenses. This comprises, among other aspects, what kinds of social-cultural values users hold, what artifacts users typically use, and what rituals they perform in their daily lives (Hao, 2019). These insights can help designers and NPD teams build empathetic understanding for users in distant cultures and develop successful products for international markets. Similarly, international companies can also improve their performance in the Chinese market by adopting cross-cultural design toolkits.
Theoretical Contributions
In addition to the many practical outcomes, the results of this study provide theoretical contributions. Previous studies have investigated how Chinese firms utilize design by focusing on the design process (Heskett & Liu, 2009, 2012; Liu & de Bont, 2017; Zhang et al., 2011). This research extends previous studies by revealing the general competitiveness of products developed by Chinese companies compared to leading international brands in Chinese and international markets and the competitiveness on the specific dimensions.
Furthermore, this research extends the studies on how to measure consumer evaluations of products (Gielens, 2012; Homburg et al., 2015; Moon et al., 2015). The current scales used in marketing research can be limited due to overlooking the meaning and typological dimensions. The Innovation Pyramid Framework developed in design research is comprehensive in capturing multiple dimensions, even though it was initially developed through qualitative studies and used for expert ratings (Rampino, 2011). This research provides an empirical basis for the validity of this framework. We collected samples in Chinese and Dutch markets, which further provided cross-cultural validation. The results demonstrate that the four-dimensional model of the Innovation Pyramid Framework can serve as an effective tool in exploring the role of design as manifested in product characteristics.
Moreover, although this research focuses on Chinese firms, the implications are not limited to Chinese contexts. Other developing nations could also utilize design to achieve economic growth. For those economies, it is possible to first utilize the design’s styling and integration role and focus on domestic markets, which can help them build their understanding of design step by step, gain profits and gradually accumulate innovation capabilities. However, since most societies have moved beyond the industrial economy to the experience, knowledge, and transformation economies, this research demonstrates that focusing on styling and integration roles only is insufficient to be successful internationally and that it is, therefore, essential to focus on the strategic role of design to create differentiated advantages by generating new meanings and typologies.
Limitations and Future Research
There are several opportunities to strengthen this research. First, in order to investigate Chinese firms’ design utilization performance, this research focuses on design award-winning firms and uses award-winning products as research subjects. Although award-winning products suggest companies’ effective usage of design, it does not reflect the general design utilization performance of the majority of Chinese firms. It indicates the highest design performance. Thus, it would be valuable to investigate design utilization performance of average Chinese SMEs and explore solutions to improve their design utilization performance. Furthermore, award-winning products represent excellent design quality (Xia et al., 2016), but excellent design quality does not lead to market success automatically. Future research can investigate how to translate excellent design quality into market success. In addition, this research focuses on iF and Reddot design awards, which are the most popular two awards among Chinese firms. However, there are many alternative design competitions running every year. The different design competitions have different selection systems and criteria (Self, 2014). For instance, IDEA award considers the business value of design in addition to aesthetics, usability, and functionality. Thus, targeting different design awards may result in different results. It would be interesting to replicate this research with other design award-winning products.
Second, in both Study 2a and 2b, we presented products with products’ country of origin information. Consumers’ evaluations reflect their assessments of product design as well as their perception of the country of origin (COO). Future research can examine consumers’ evaluation of products without revealing country of origin information. In this way, results can show consumers’ evaluation of products themselves. Moreover, in Study 2b, although we set clear and strict criteria to select Dutch consumers to represent non-Chinese consumers in Western countries, this sample may carry limitations caused by cultural differences. Thus, future research could replicate this study in other countries (e.g., Germany). The results can strengthen the findings of this research. Results can also provide practical implications for how Chinese brands compete with leading international brands in those countries. In addition, in Study 2, we carefully selected four product categories to conduct two experiments. Future research could replicate this research with alternative product categories. It would be even more interesting to focus on different product categories, such as hedonic products versus pragmatic products and lowly versus highly innovative products. In this way, results can provide specific guidelines for Chinese brands to effectively utilize design for each product category.
Finally, we focused on tangible products. However, design can also contribute to service development. Many Chinese firms develop meaningful service innovation in international markets, such as the applications of TikTok in US markets and Trainpal in UK markets. It would be interesting for future research to investigate design utilization in the service context, which can broaden our understanding of Chinese companies’ utilization of design.
Acknowledgments
The authors would like to thank Yanming He and Xu Han for their assistance with data analyses in Study 1, thank Chee Ngai from Samplenomics for his help on data collection in Study 2, thank Sylvia Xihui Liu and Daniel Graff for their comments on the previous versions of this manuscript, and two anonymous reviewers for their comments for strengthening this manuscript. This research was funded by Hong Kong GRF grant (Grant no. G-YBNL), National Natural Science Foundation of China (Grant no. 72002057), special innovation projects of universities in Guangdong Province China (Grant no. 2022WTSCXl84), Humanities and Social Science projects of the Ministry of Education in China (Grant no. 20YJC760009), and Shenzhen Basic Research Program (Grant no. JCYJ20190806142401703).
References
- Akdeniz Ar, A., & Kara, A. (2014). Emerging market consumers’ country of production image, trust and quality perceptions of global brands made-in China. Journal of Product & Brand Management, 23(7), 491-503. https://doi.org/10.1108/JPBM-12-2013-0472
- Bannister, J. P., & Saunders, J. A. (1978). UK consumers’ attitudes towards imports: The measurement of national stereotype image. European Journal of Marketing, 12(8), 562-570. https://doi.org/10.1108/EUM0000000004982
- Belk, R. W. (1988). Possessions and the extended self. Journal of Consumer Research, 15(2), 139-168. https://doi.org/10.1086/209154
- Beverland, M. B. (2005). Managing the design innovation–brand marketing interface: Resolving the tension between artistic creation and commercial imperatives. Journal of Product Innovation Management, 22(2), 193-207. https://doi.org/10.1111/j.0737-6782.2005.00114.x
- Bilkey, W. J., & Nes, E. (1982). Country-of-origin effects on product evaluations. Journal of International Business Studies, 13(1), 89-100. https://doi.org/10.1057/palgrave.jibs.8490539
- Bloch, P. H. (2011). Product design and marketing: Reflections after fifteen years. Journal of Product Innovation Management, 28(3), 378-380. https://doi.org/10.1111/j.1540-5885.2011.00805.x
- Booth, K. (1979). Strategy and ethnocentrism. Croom-Helm.
- Candi, M. (2010). Benefits of aesthetic design as an element of new service development. Journal of Product Innovation Management, 27(7), 1047-1064. https://doi.org/10.1111/j.1540-5885.2010.00770.x
- Candi, M. (2016). Contributions of design emphasis, design resources and design excellence to market performance in technology-based service innovation. Technovation, 55-56, 33-41. https://doi.org/10.1016/j.technovation.2016.05.004
- Candi, M., & Gemser, G. (2010). An agenda for research on the relationships between industrial design and performance. International Journal of Design, 4(3), 67-77.
- Candi, M., & Saemundsson, R. J. (2011). Exploring the relationship between aesthetic design as an element of new service development and performance. Journal of Product Innovation Management, 28(4), 536-557. https://doi.org/10.1111/j.1540-5885.2011.00827.x
- Chesbrough, H., & Rosenbloom, R. S. (2002). The role of the business model in capturing value from innovation: Evidence from Xerox Corporation’s technology spin‐off companies. Industrial and corporate change, 11(3), 529-555. https://doi.org/10.1093/icc/11.3.529
- Chiva, R., & Alegre, J. (2007). Linking design management skills and design function organization: An empirical study of Spanish and Italian ceramic tile producers. Technovation, 27(10), 616-627. https://doi.org/10.1016/j.technovation.2007.05.015
- Christiansen, J. K., & Varnes, C. J. (2009). Formal rules in product development: Sensemaking of structured approaches. Journal of Product Innovation Management, 26(5), 502-519. https://doi.org/10.1111/j.1540-5885.2009.00677.x
- Chung, K. W. (1998). Strategies for promoting Korean design excellence. Design Issues, 14(2), 3-15. https://doi.org/10.2307/1511848
- Counterpoint. (2020). Global smartphone market share: By quarter. Retrieved December 13, 2020, from https://www.counterpointresearch.com/zh-hans/global-smartphone-share/
- D’Ippolito, B. (2014). The importance of design for firms’ competitiveness: A review of the literature. Technovation, 34(11), 716-730. https://doi.org/10.1016/j.technovation.2014.01.007
- De Bont, C. (2016). Lessons from China: Paradise or graveyard for strategic designers. Journal of Design, Businss & Society, 2(1), 9-22. https://doi.org/10.1386/dbs.2.1.9_1
- De Bont, C., & Liu, S. X. (2017). Breakthrough innovation through design education: Perspectives of design-led innovators. Design Issues, 33(2), 18-30. https://doi.org/10.1162/DESI_a_00437
- De Mozota, B. B. (2006). The four powers of design: A value model in design management. Design Management Review, 17(2), 44-53. https://doi.org/10.1111/j.1948-7169.2006.tb00038.x
- Eisenberg, I. (2011). Lead-user research for breakthrough innovation. Research-Technology Management, 54(1), 50-58. https://www.jstor.org/stable/26505958
- Frow, P., Nenonen, S., Payne, A., & Storbacka, K. (2015). Managing co-creation design: A strategic approach to innovation. British Journal of Management, 26(3), 463-483. https://doi.org/10.1111/1467-8551.12087
- Gardien, P., Djajadiningrat, T., Hummels, C., & Brombacher, A. (2014). Changing your hammer: The implications of paradigmatic innovation for design practice. International Journal of Design, 8(2), 119-139.
- Gemser, G., & Leenders, M. A. (2001). How integrating industrial design in the product development process impacts on company performance. Journal of Product Innovation Management, 18(1), 28-38. https://doi.org/10.1111/1540-5885.1810028
- Gielens, K. (2012). New products: The antidote to private label growth? Journal of Marketing Research, 49(3), 408-423. https://www.jstor.org/stable/41714435
- Goodrich, K. (1994). The designs of the decade: Quantifying design impact over ten years. Design Management Journal, 5(2), 47-55. https://doi.org/10.1111/j.1948-7169.1994.tb00387.x
- Garcia, R., & Calantone, R. (2002). A critical look at technological innovation typology and innovativeness terminology: A literature review. Journal of Product Innovation Management, 19(2), 110-132. https://doi.org/10.1111/1540-5885.1920110
- Hao, C. (2019). Cultura: Achieving intercultural empathy through contextual user research in design [Unpublished doctoral dissertation]. Delft University of Technology.
- Henard, D. H., & Szymanski, D. M. (2001). Why some new products are more successful than others. Journal of Marketing Research, 38(3), 362-375. https://doi.org/10.1509/jmkr.38.3.362.18861
- Hertenstein, J. H., Platt, M. B., & Veryzer, R. W. (2005). The impact of industrial design effectiveness on corporate financial performance. Journal of Product Innovation Management, 22(1), 3-21. https://doi.org/10.1111/j.0737-6782.2005.00100.x
- Heskett, J. (2008). Creating economic value by design. International Journal of Design, 3(1), 71-84.
- Heskett, J., & Liu, S. X. (2009). The approach of design management in China. In Proceedings of the conference of International Association of Societies of Design Research. IASDR.
- Heskett, J., & Liu, S. X., (2012). Models of developing design capacity: Perspective from China. In E. Bohemia, J. Liedtka, & A. Rieple (Eds.), Proceedings of the DMI international research conference (pp. 225-238). John Wiley.
- Heskett, J. (2017). Design and the creation of value. Bloomsbury Publishing.
- Homburg, C., Schwemmle, M., & Kuehnl, C. (2015). New product design: Concept, measurement, and consequences. Journal of Marketing, 79(3), 41-56. https://doi.org/10.1509/jm.14.0199
- Hsu, J. L., & Nien, H. P. (2008). Who are ethnocentric? Examining consumer ethnocentrism in Chinese societies. Journal of Consumer Behaviour: An International Research Review, 7(6), 436-447. https://doi.org/10.1002/cb.262
- Jevnaker, B. H. (2000). Championing design: Perspectives on design capabilities. Academic Review, 1(1), 25-39. https://doi.org/10.1111/j.1948-7177.2000.tb00003.x
- Kaynak, E., & Cavusgil, S. T. (1983). Consumer attitudes towards products of foreign origin: Do they vary across product classes? International Journal of Advertising, 2(2), 147-157. https://doi.org/10.1080/02650487.1983.11104967
- Lawrence, P., & McAllister, L. (2005). Marketing meets design: Core necessities for successful new product development. Journal of Product Innovation Management, 22(1), 107-108. https://doi.org/10.1111/j.0737-6782.2005.00098.x
- Liu, S. X. (2016). Innovation design: Made in China 2025. Design Management Review, 27(1), 52-58. https://doi.org/10.1111/drev.10349
- Liu, S. X. (2021). Barriers to bringing design function into technology start-ups: A survey on the incubation programme of Hong Kong Science Park. The Design Journal, 24(5), 807-828. https://doi.org/10.1080/14606925.2021.1959120
- Liu, S. X., & de Bont, C. (2017). Barriers to strategic design: A perspective from China. She Ji: The Journal of Design, Economics, and Innovation, 3(2), 133-145. https://doi.org/10.1016/j.sheji.2017.09.003
- Liu, S. X., Liu, H., & Zhang, Y. (2018). The new role of design in innovation: A policy perspective from China. The Design Journal, 21(1), 37-58. https://doi.org/10.1080/14606925.2017.1395167
- Liu, S. X., & Rieple, A. (2019). Design management capability in entrepreneurship: A case study of Xiaomi. International Journal of Design, 13(3), 125-138.
- Lu, Y. X. (2013). The future of ‘made in China.’ Mechanical Engineering Trend, 169(10-12), 3-6.
- Luque‐Martínez, T., Ibáñez‐Zapata, J. A., & del Barrio‐García, S. (2000). Consumer ethnocentrism measurement‐An assessment of the reliability and validity of the CETSCALE in Spain. European Journal of Marketing, 34(11/12), 1353-1374. https://doi.org/10.1108/03090560010348498
- Moody, S. (1984). The role of industrial design in the development of new science-based products. In R. Langdon (Ed.), Design policy: Design and industry. London: The Design Council.
- Moon, H., Park, J., & Kim, S. (2015). The importance of an innovative product design on customer behavior: Development and validation of a scale. Journal of Product Innovation Management, 32(2), 224-232. https://doi.org/10.1111/jpim.12172
- Nijssen, E. J., & Douglas, S. P. (2004). Examining the animosity model in a country with a high level of foreign trade. International Journal of Research in Marketing, 21(1), 23-38. https://doi.org/10.1016/j.ijresmar.2003.05.001
- Norman, D. A. (1988). The psychology of everyday things. Basic books.
- Ozer, M. (2011). The moderating roles of prior experience and behavioural importance in the predictive validity of new product concept testing. Journal of Product Innovation Management, 28(1), 109-122. https://doi.org/10.1111/j.1540-5885.2010.00784.x
- Platt, M. B., Hertenstein, J. H., & Brown, D. R. (2001). Valuing design: Enhancing corporate performance through design effectiveness. Design Management Journal, 12(3), 10-19. https://doi.org/10.1111/j.1948-7169.2001.tb00548.x
- Rampino, L. (2011). The innovation pyramid: A categorization of the innovation phenomenon in the product-design field. International Journal of Design, 5(1), 3-16.
- Ravasi, D., & Stigliani, I. (2012). Product design: A review and research agenda for management studies. International Journal of Management Reviews, 14(4), 464-488. https://doi.org/10.1111/j.1468-2370.2012.00330.x
- Reddot. (2013). Red dot: Design team of the year 2013. Retrieved December 13, 2022, from https://www.red-dot.org/zh/pd/design-team-of-the-year/hall-of-fame/2013/?r=1
- Roper, S., Micheli, P., Love, J. H., & Vahter, P. (2016). The roles and effectiveness of design in new product development: A study of Irish manufacturers. Research Policy, 45(1), 319-329. https://doi.org/10.1016/j.respol.2015.10.003
- Roy, R., & Potter, S. (1990) Managing design projects in small and medium-sized firms. Technology Analysis & Strategic Management, 2(3), 321-336. https://doi.org/10.1080/09537329008524018
- Roy, R., & Potter, S. (1993). The commercial impacts of investment in design. Design Studies, 14(2), 171-193. https://doi.org/10.1016/0142-694X(93)80046-F
- Roy, R., & Riedel, J. C. (1997). Design and innovation in successful product competition. Technovation, 17(10), 537-594. https://doi.org/10.1016/S0166-4972(97)00050-3
- Self, J. A. (2014). Mind the gap: Perceptions of design awards from the wild. International Journal of Design, 8(3), 123-138.
- Sklair, L. (1994). The culture-ideology of consumerism in urban China: Some findings from a survey in Shanghai. Research in consumer behavior, 7(2), 259-92.
- Sung, W. O., Nam, K. Y., & Chung, K. W. (2010). Strategic use of international product design award schemes. Design Management Journal, 5(1), 72-86. https://doi.org/10.1111/j.1948-7177.2010.00016.x
- Schwab, K. (ed.) (2019) The global competitive report 2019. World Economic Forum.
- Shimp, T. A., & Sharma, S. (1987). Consumer ethnocentrism: Construction and validation of the CETSCALE. Journal of Marketing Research, 24(3), 280-289. https://doi.org/10.2307/3151638
- Suriñach, J., Autant-Bernard, C., Manca, F., Massard, N., & Moreno, R. (2009). The diffusion/adoption of innovation in the internal market (Vol. 384). Directorate General Economic and Financial Affairs, European Commission.
- Talke, K., Salomo, S., Wierenga, J. E., & Lutz, A., (2009). What about design newness? Investigating the relevance of a neglected dimension of product innovativeness. Journal of Product Innovation Management, 26(6), 601-615. https://doi.org/10.1111/j.1540-5885.2009.00686.x
- Ulrich, K., & Eppinger, S. (1995). Product design, and development. McGraw-Hill.
- Verganti, R. (2009). Design-driven innovation: Changing the rules of competition by radically innovating what things mean. Harvard Business Press.
- Walsh, V., Roy, R., & Bruce, M. (1988). Competitive by design. Journal of Marketing Management, 4(2), 201-216. https://doi.org/10.1080/0267257X.1988.9964069
- Xia, Y., Singhal, V. R., & Zhang, P. G. (2016). Product design awards and the market value of the firm. Production and Operations Management, 25(6), 1038-1055. https://doi.org/10.1111/poms.12525
- Yamamoto, M., & Lambert, D. R. (1994). The impact of product aesthetics on the evaluation of industrial products. Journal of Product Innovation Management, 11(4), 309-324. https://doi.org/10.1016/0737-6782(94)90086-8
- Zhan, X., Mu, Y., Hora, M., & Singhal, V. R. (2021). Service excellence and market value of a firm: An empirical investigation of winning service awards and stock market reaction. International Journal of Production Research, 59(14), 4188-4204. https://doi.org/10.1080/00207543.2020.1759837
- Zhang, D., Hu, P., & Kotabe, M. (2011). Marketing-industrial design integration in new product development: The case of China. Journal of Product Innovation Management, 28(3), 360-373. https://doi.org/10.1111/j.1540-5885.2011.00803.x
- Zhang, Y. (2022). Algorithmic photography: A case study of the Huawei moon mode controversy. Media, Culture & Society, 44(4), 690-705. https://doi.org/10.1177/01634437211064964
- Zec, P. (2007). Design on stage: The Reddot design award. Design Management Review, 18(1), 60-67. https://doi.org/10.1111/j.1948-7169.2007.tb00073.x
Appendix
Appendix 1. Information of iF design award in product design from 2010 to 2020.
Appendix 2. Information of Reddot design award in product design from 2012 to 2020.
