
Exploration in Emotion and Visual Information Uncertainty of Websites in Culture Relations
Institute of Applied Arts, National Chiao-Tung University, Hsinchu, Taiwan
Department of Visual Graphics Communication, Hsuan Chuang University, Hsinchu, Taiwan
This study explores the emotional responses in relation to visual information uncertainty of websites within the theoretical arguments for the cultural dimension of uncertainty avoidance. The information rate model and PAD emotional state model are used to relate the information uncertainty of webpages and one’s emotional responses, respectively. A sample of 239 participants was taken from a pool of students from an institute in central Taiwan. Participants were asked to evaluate webpages that comprise of three variant levels of information uncertainty and respond to instruments designed to measure information uncertainty of webpages and participant emotion. The results of ANOVA indicate significant differences in emotional responses caused by different degrees of information uncertainty: the high degrees of informative uncertainty induce more arousal emotion, the low ones induce less arousal emotion, and the moderate ones induce more pleasure emotion. Consistent results from factor analyses confirmed the feasibility of using an information rate scale to evaluate the visual information uncertainty of webpages. Result of multiple regression analyses suggested that regression correlations exist between the visual information uncertainty of websites and emotions induced in viewers.
Keywords – Emotion, Information Uncertainty, Website, Uncertainty Avoidance.
Relevance to Design Practice – This study explores participant emotional responses in relation to the visual information uncertainty of websites in the dimension of uncertainty avoidance culture. The experimental results could be treated as the basis for cultural and affective design of websites.
Citation: Tsai, T. W., Chang, T. C., Chuang, M. C., & Wang, D. M. (2008). Exploration in emotion and visual information uncertainty of websites in culture relations. International Journal of Design, 2(2), 55-66.
Received March 31, 2008; Accepted August 8, 2008; Published August 31, 2008
Copyright: © 2008 Tsai, Chang, Chuang, and Wang. Copyright for this article is retained by the authors, with first publication rights granted to the International Journal of Design. All journal content, except where otherwise noted, is licensed under a Creative Commons Attribution-NonCommercial-NoDerivs 2.5 License. By virtue of their appearance in this open access journal, articles are free to use, with proper attribution, in educational and other non-commercial settings.
*Corresponding Author: wei@ntit.edu.tw
Introduction
Websites contain multiple visual stimuli. The visual complexes presented on webpages result in diverse levels of information uncertainty (IU) and induce viewers’ perceptive and cognitive responses (Eroglu, Machleit, & Davis, 2003). The inclination of one’s uncertainty avoidance (UA) relates to his/her emotional responses and adapts the information uncertainty in a contrary direction. (Marcus, 2006). Uncertainty avoidance, which refers to the tolerance of uncertainty from information, is one dimension of cultural difference. Uncertainty is a degree to which available choices or the outcomes of possible alternatives are free from information (Shannon & Weaver, 1963). It is also defined in psychological terms, such as novelty (Berlyne, 1974), ambiguity, and complexity (Berlyne, 1971c). Thus, an information rate model has been proposed to provide a psychological description of information uncertainty and to characterize the spatial complex and temporal arrangement of stimuli both within and across different settings (Mehrabian & Russell, 1974; Petrov, 2002). In addition, the Pleasure-Arousal-Dominance (PAD) emotional state model illustrated that participants’ three initial emotional responses are evoked by the psychological qualities of visual information in an environment (Mehrabian, 1996). They will have carry-over effects on their subsequent approach/avoidance behaviors toward websites (Deng, 2006).
Based on the above arguments, a theoretical framework of the study was structured as shown in Figure 1. It was inferred that visual information uncertainty of webpages might be measured based on the information rate model, and the emotional responses induced in the viewers might be explained according to the following three emotional dimensions: pleasure, arousal, and dominance. Visual information uncertainty of webpages might have significant effects on the viewers’ ongoing perceptual and cognitive responses. An interrelation might exist between the visual information uncertainty of websites and emotions induced in viewers. Therefore, the primary research questions were addressed as follows:
- RQ1: Is the information rate applicable to measure visual information uncertainty of webpages?
- RQ2: Does the visual information uncertainty of webpages show significant effects on viewers’ emotional responses?
- RQ3: What is the relation between the visual information uncertainty of webpages and the viewers’ emotional responses?
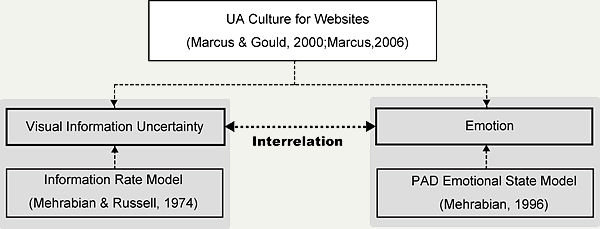
Figure 1. A theoretical framework of the study.
Literature Review
Culture, Information, and Emotion
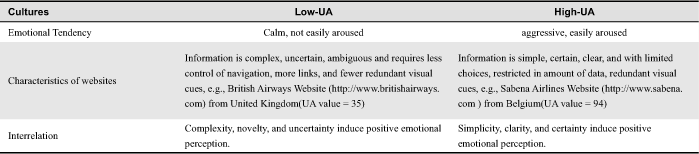
Organisms’ inclinations of information reception and emotional responses are influenced by their cultural properties (Davis, Wang, & Lindridge, 2007; Dormann, 2006). Cultures vary in five dimensions: power distance, collectivism-individualism, uncertainty avoidance, long and short-term orientation, and masculinity-femininity (Hofstede, 1997). Marcus and Gould (2000) identified cultural variations among websites in each of the five cultural dimensions. Of the five cultural dimensions, the one that pertains to how information uncertainly (IU) affects emotional responses is uncertainty avoidance (UA). UA is the resistance to ambiguity or anxiety from things that are uncertain or unknown, as opposed to a feeling of fear from clear threats (Hofstede, 1997). High-UA cultures tend to be expressive, easily aroused, aggressive, active, emotional, and less ambiguous; whereas low-UA cultures tend to be relatively less expressive, less openly anxious, less aggressive or emotional, easier-going, and even more relaxed (Kitayama & Markus, 1994). Marcus & Gould (2000) investigated the UA culture values of various nations and their airline company websites. He claimed that the degree of UA has contrary influence on preference for information uncertainty of user-interface and Web design (Marcus, 2006). Table 1 illustrates a comparison of the properties of high-UA and low-UA cultures according to the study by Marcus and Could (2000). For example, people in Belgium with higher UA culture value (UA=94) tend to favor information of simplicity, clear metaphors, limited choices, restricted amounts of data, redundant cues (color, typography, sound, etc.) in order to reduce ambiguity. On the other hand, people in United Kingdom with lower UA culture value (UA = 35) emphasize complexity with maximal content and choices, less control of navigation, acceptance (even encouragement) of wandering and risk, coding of color/ shape/ texture cues used to maximize information and reduce redundancy (Marcus & Gould, 2000).
Table 1. A comparison of the properties of high-UA and low-UA culture (adapted from Marcus & Gould, 2000)
In other words, the information uncertainty of websites, viewed as complexity, novelty, and ambiguity (Berlyne, 1971c), induces viewer emotions and bends a contrary inclination of one’s uncertain avoidance culture. Based on the assumption that the information uncertainty of websites relate closely to the users’ UA cultural tendency, it is more likely to engage user emotions (Simon, 2001). Culture is inextricably linked with emotion (Kitayama & Markus, 1994); thus, UA could be attributed to one’s emotional responses, which have been proposed to be assessed in various dimensions.
The Dimensions of Emotion
Emotion knowledge is often organized into a two or three dimensional structure, with positive-negative valence, activity or arousal, and potency or dominance (Dormann, 2006). For example, Wundt (1905) reported the bipolar dimensions of pleasant and activation to account for the large variance in emotions; Russell (1980) created the two orthogonal axes of the circumplex of affections to represent the dimensions of “pleasantness” (horizontal) and “activation” (vertical), to investigate one’s personality. Osgoods (Snider & Osgood, 1969) worked with a semantic differential scale to characterize human judgments on or reactions to levels of uncertainty and gave the definitions of arousal, pleasure, and potency. Referring to one’s emotional responses to stimuli in environments, Mehrabian (1996) proposed the three dimensions of the PAD (pleasure, arousal, dominance) model to illustrate that when one enters an environment, their three emotions, pleasure, arousal and dominance, are induced. Their semantic differential studies have shown that human judgments on diverse samples of stimuli can be characterized in terms of these three dimensions (Mehrabian & Russell, 1974). The three dimensions of emotion are briefly stated as follows.
Pleasure
The dimension of pleasantness is the positive-negative valence of emotion and ranges from unpleasant (e.g., unhappy) to pleasant (e.g., happy) (Clore, 1994). Many psychology researchers have demonstrated that induced pleasure encourages the viewer to explore the stimuli in more detail. For example, Isen (1987) found that individuals with a positive emotion could process more complicated information and were more optimistic with regard to accepting challenges. She also found that positive emotions increase an individual’s sensibility to the stimuli in an environment. Berlyne (1971b) also proposed that the hedonic value of ones’ emotion reaches a peak when his arousal potential is at a moderately high point as a result of his arousal-increasing devices and arousal-moderating devices.
Arousal
Physiological arousal is the activation state of emotion, which ranges from calm to excited (Clore, 1994). Since arousal is a primarily affective response, when one is exposed to external stimulus (Berlyne, 1971a), it is viewed as one dimension to evaluate the aesthetics of human factors and design (Liu, 2000). Arousal emotion is also identified as secondary drives, which are motivational conditions produced by external stimuli as a result of learning, according to Berlyne’s motivation theory (Berlyne, 1971b). The arousal emotion is related to the uncertainty, novelty, expectation, and complexity of the stimuli (Berlyne, 1974, p. 19). In addition, it is directly related to the amount of information in an environment according to the information rate-arousal theory (Mehrabian & Russell, 1974).
Dominance
A person’s feeling of dominance in a situation is based on the extent to which he feels unrestricted or free to act in a variety of ways (Mehrabian, 1996). Proshansky, Ittelson, and Rivlin (1970) proposed “freedom of choice” as a dimension of emotion to describe one’s dominant feeling in an environment. For instance, privacy and territoriality permit greater freedom of choice; whereas formal social situations tend to constrain behavior more (Mehrabian, 1972). Physical stimuli, rated as more intense, more ordered, and more powerful, are related with one’s submissive feeling, because they show more constriction than other stimuli (Mehrabian & Russell, 1974).
Estimating viewer emotional responses to each component event in a stimulus configuration is highly challenging, because they usually obtain the essential information from a diverse range of visual cues within a web environment. Mehrabian (1996) has used the PAD model to describe people’s emotional responses when they first encounter visual stimuli in real environments. Furthermore, research has shown that many of the key factors that determine an individual’s perception of the natural environment are also major determinants of the emotional responses induced by virtual webpages (Eroglu et al., 2003; Wimelius, 2004). A web user’s initial emotional responses (i.e., pleasantness and arousal) evoked by the psychological qualities of visual information on a website will have carry-over effects on his/her subsequent approach behaviors (dominance) toward the website (Deng, 2006; Tsai, Chang, & Chen, 2006). Thus, the measurements of the three emotional components could be an index of avoidance/approach to information uncertainty.
Measure of Information Uncertainty
Uncertainty is the degree to which available choices or the outcomes of possible alternatives are free from constraints. It is one index of estimation and judgment on the level of information of a condition or situation (Dictionary.com, 2008). In terms of information theory, the information corresponding to the inherent uncertainty can be measured by the amount of entropy in Equation 1 (Shannon & Weaver, 1963).
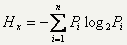 (Equation 1), where Pi is the probability of alternative i.
In Equation 1, Hx is the entropy, Pi is the probability of alternative i, and the summation is all alternatives (Golitsyn & Petrov, 1995; Shannon & Weaver, 1963). Accordingly, the total amount of information is simply the sum of information from each event or component, provided that the component events are independent (provided that successive outcomes are independent of preceding ones in a temporal sequence or that the components are randomly distributed in a spatial configuration ) (Shannon & Weaver, 1963).
However, webpages, similar to complex stimuli in everyday environments, are the combination of all visual stimuli determined by the conditional probabilities of certain presented components in different parts of an arrangement (Oliva, Mack, Shrestha, & Peeper, 2004). The total amounts of information are difficult to obtain under some conditional factors of collative properties, such as familiarity, complex, patterning, and simultaneous effects of multiple modalities (Terwilliger, 1963). Therefore, the concept of an average information rate, defined as the total amount of information received by the viewer per unit time, is appropriate to measure and characterize the spatial complex and temporal arrangement of stimuli both within and across different settings (Mehrabian & Russell, 1974; Petrov, 2002). The information rate also provides an index of the psychological properties of information uncertainty of an environment (Berlyne, 1966). For example, a crowded, high-density arrangement of objects results in a high information rate; the terms of novel, rare, unexpected and surprising all refer to the improbability of an event and have a greater information rate. Verbal descriptions, such as varied, complexity (Cleveland, 2008), diversity (Stamps III, 2002), heterogeneous, dissonant, crowding (Clalhoun, 1962), asymmetry, jarring (Locher, 1995), novelty (Golitsyn & Petrov, 1995), are related to the idea of information rate and could be used to describe the concept of information uncertainty (Petrov, 2002). Moreover, Mehrabian and Russell (1974) developed a verbal measurement of information uncertainty, Information Rate Scale (IRS), to quantify the impact of physical environments on human’s affective and attitudinal orientations. As mentioned above, it was inferred that the visual information uncertainty of webpages might be measured systematically by applying the information rate model.
Some relevant research evidences have supported that there exists a correlation between information uncertainty and emotional responses. For example, Berlyne (1974) proposed one’s displeasure for high or low uncertainty and pleasure for moderate uncertainty. He also suggested that an inverse U-curve relationship exists between pleasure (hedonic emotion) and information uncertainty. Mehrabian & Russell (1974) validated the information rate-arousal hypothesis and confirmed a linear correlation between information rates of a real environment and arousal emotion: Information Rate=0.57 arousal state. These studies offered a basic inference of a correlation between information uncertainty and emotions in the web environment.
Methodology
The research questions were examined using the following two-phase experimental procedure:
Experiment 1: Selection of Representative
Stimulus Materials
Stimuli
The homepages of websites that relate to art, culture, or humanity were chosen as samples, in which viewers acquire both informative and affective stimuli. The chosen websites have all been rewarded with a good reputation by the public media and/or winners of previous design excellence awards. Note that the current experiment focuses on the simultaneous and inseparable occurrence of visual static stimuli on webpage, and hence acoustic and animated stimuli are neglected.
Procedure
To select representative materials, 5 experts in web design, each with more than 3 years of experience, were invited to initially select 85 homepages from digital museum websites. The process involved the filtering of webpages to obtain a limited number of representative webpages. Color laser prints (7.5 x 10 cm) of the chosen homepages were then prepared for the experimental stage of the investigation.
Thirty experienced web users, each with more than 3 years of on-line experience and more than 6 hours a week of internet use, were recruited as subjects. Firstly, the concept of information uncertainty, defined as complexity, novelty, diversity ambiguity, and dissonance, was explained to them. Next, they were asked to classify the 85 homepages in accordance with their visual information uncertainty into 6-8 groups being careful to stay consistent and to state the determinative factors of each classification. Comparison in pair among these homepages, the frequency that a pair of webpages appeared in the same group was used as a variable for analysis to generate a similarity matrix. Therefore, the classification results were coded for statistical techniques of Multi-Dimensional Space (MDS) and Cluster Analysis. MDS was used in data visualization for exploring similarities or dissimilarities in data. Cluster analysis was for the classification of objects into different groups or for the partitioning of a data set into subsets (clusters), so that the data in each subset (ideally) share some common trait - often proximity according to some defined distance measure (Triola, 2007). A cut-off point in the hierarchical tree diagram of the Cluster Analysis was chosen in accordance with a tradeoff between the number of evaluation tasks and the precision of the performance requirement. Based on the positions of the 85 homepages on the derived two-dimensional MDS perception map (R2= 0.894), the homepages were grouped into six clusters. The Delphi method then was used to identify the characteristics of each cluster. After several runs of discussion that referenced the 30 web users’ statements about their determination of each classification, the 5 experts unanimously reached the following consensus for labeling homepages:
- (a)Informative: Multiple text blocks and sections that provide abundant information
- (b)Artistic: Blur images, darker and mono-color tone, more text, and atmospheric/mysterious appearance.
- (c)Contrast: High contrast, large-scale detailed images designed to engage viewers’ eyes and interest, layouts arranged predominantly in the form of half-arc segments.
- (d)Distinctive: Vivid colors and geometric segments designed to transmit precise and unambiguous messages, multiple elements.
- (e)Imagination: Minimum text and multiple images, layouts arranged predominantly symmetrically and horizontally.
- (f)Focal: Main image (or button) positioned in the center of webpage.
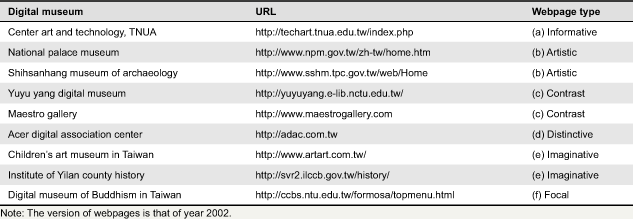
The five expert designers were again invited to select a total of nine homepages to represent the fundamental characteristics of each of the six types of webpages. Note that the number of homepages chosen for each webpage type was specified in accordance with the total number of webpages within each group. The nine representative webpages are presented in Table 2.
Table 2. Nine representative webpages from six types
Experiment 2: Acquisition of Information Rate and Emotional Responses
Participants
A total of 239 undergraduate students from a large technology institute in central Taiwan participated voluntarily in the present study. As they come from all parts of Taiwan, they are representatives of a random sample. The participants’ age ranged from 19-22, with an average age of 20.15 (SD=.735). Participants were required to be familiar with web interfaces and computer functions. Thus, they were randomly chosen from students in multimedia design with either main training in visual design (58%) or information technology (42%). They all have on-line experience and spend five to thirty hours a week on browsing webpages (less than 5 hours: 28%, 6-10 hours: 24%, 10-20 hours: 20% and over 30 hours: 28%). They comprised an almost equal number of males and females - 113 male (47%) and 126 female (53%).
Instruments
The instruments consist of two main measurement tools. The first measurement tool was for measuring the information uncertainty of webpages, while the second one was for measuring the induced emotions in the participants. Two sets of self-reporting semantic differential scales were used (Osgood, Suci, & Tannenbaum, 1957). The items of both measurements were scored on seven-point Likert scales, and the effectiveness of the two constructed scales was verified by preliminary validation analyses.
The current items of information rate measurements were adapted from those used in the Information Rate Scale (IRS) proposed by Mehrabian and Russell (1974). The measured items were screened by item analysis on the mean, standard deviation (±1.5segments), skewness, extreme value test results (P<0.05), correlation coefficients, and factor loading values (0.3) of the data acquired during preliminary validation. In addition, seven items in the original IRS set were further eliminated, because they were designed to describe physical space and might be inappropriate for describing webpages in cyber space; these include indoor – outdoor, rural – urban, man-made – natural, among others. Then, the reliability estimation of the modified scale was conducted and found to be satisfactorily reliable with a Cronbach’s alpha value of 0.92. Based on the analytical results, a total of fourteen items were chosen to construct the current information rate scale, as shown in Table 3. Using this scale, the overall information rate of each webpage could then be determined by summing the scores assigned to each of the individual measured items. This improved measurement is used to assess the visual information rate of complex, multi-modal situations found in web environments. The average of rated score could be an index to quantify the impact of webpages on the affective and attitudinal orientations and account for the overall effect of the various visual aspects of webpages.
Table 3. The fourteen measured items in the information rate scale used in the study
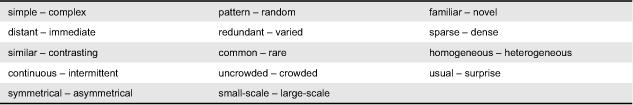
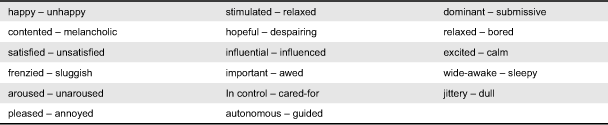
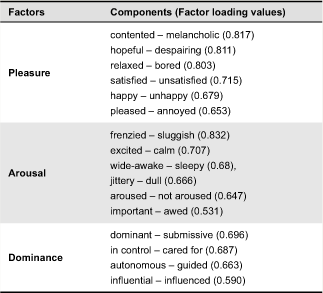
Meanwhile, the items of emotional state scale were adapted from those used in the PAD emotion scale initially developed by Mehrabian (1974). In preliminary validation analyses, only the one adjective pair of “controlling – controlled” was eliminated because its correlation coefficient and factor loading value were both less than 0.3. The reason might be that the visual stimuli on the webpages explored in the current study lacked the perception of real control for differentiation. Thus, the improved emotional state scale comprising a total of seventeen adjective pairs, as shown in Table 4, with a Cronbach’s alpha value of 0.91, is used to measure participant emotion in the three dimensions of pleasure, arousal, and dominance.
Table 4. The seventeen adjective pairs used to construct emotional scale
To increase the efficiency of collecting data, web-based on-line questionnaires constructed using the ASP database program were used to record the participants’ responses to the nine representative webpages. Participants were asked to mark on the scales of the web-based on-line questionnaire based on perceptive and cognitive responses induced by each webpage. Their answers were coded as numerical variables and analyzed through statistical techniques. A screen capture of the web-based on-line questionnaire is shown in Figure 2. A preview of the webpage on the left of the screen is enlarged when participants click on it.
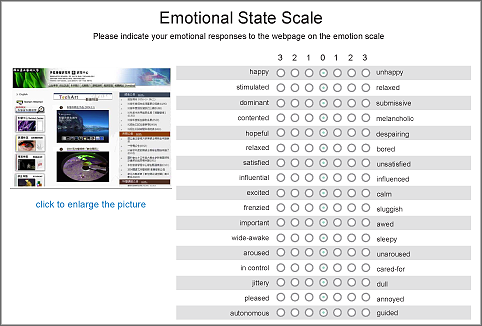
Figure 2. A screen capture of the Web-based on-line questionnaire.
Contents were translated from the Chinese text displayed in the experiment.
Procedure
All of the participants carried out the evaluation experiments in a computer lab that used hardware and software of the same specifications. Fifty identical personal computers all with a 17-inch screen and Windows XP system were used. The environment was also controlled with the same temperature and lighting. The participants were arranged into five groups to carry out the experiments, because of the limited space and hardware. After the researchers had explained the test procedures and purpose, the subjects were asked to input their personal information into the web-based questionnaire system. The nine representative web homepages were then displayed in random sequence on the individuals’ monitors, and each subject was asked to evaluate each webpage using the information rate scale. After completing the questionnaires, the subjects were asked to take a 10-min break. After the break, they were asked to again indicate their emotional response using the emotion scale on the web-based on-line emotional questionnaires.
Results
RQ1: Is the information rate applicable to measure visual information uncertainty of webpages?
The correlation between the rated score of each measured item (adjective) and the total score is summarized in Table 5. It shows that all item-total correlation were significant and in the anticipated direction (at the level of p<0.01). The correlation coefficients of five items were higher than 0.5, which indicates that they might be suitable for measuring visual information uncertainty of webpages. The eight items with medium correlation coefficients (0.2-0.5) might be used to measure the visual IU of webpages with care. The item of ‘small scale – large scale’ had a correlation coefficient of less than 0.2, which suggests that it might be inappropriate in describing the visual information of webpages.
Table 5. Correlation between measured items and the total score
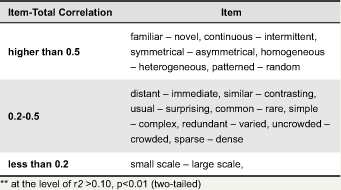
Note: ** at the level of r2 >0.10, p<0.01 (two-tailed)
To explore the factorial compositions of the information rate, the fourteen IRS measured items were submitted to principal components factor analyses using squared multiple correlations as communality estimates, followed by varimax rotation. Specifying a criterion of a factor eigenvalue greater than one, four factors were extracted. The factors were named in accordance with the variables with higher factor loading values, i.e., Novelty, Complexity, Aesthetic, and Regularity, as shown in Table 6. Novelty had the highest correlation (0.621) with IRS; regularity had the lowest (0.271).
Table 6. Correlations between four factors and IRS
Furthermore, to examine the consistency of the information rate scale, a factor analysis on the fourteen IRS measured items and information total score was performed on the data acquired during the evaluation trials for each webpage type. The factor loading values of the measured items were deemed to be sufficient if 0.50 or higher on a factor. The analysis results yielded 4 factors extracted from three webpage types (Artistic, Contrast, and Distinctive) and 5 factors from the others (Informative, Imaginative, Focal). Though there was a minor difference in the number of factors among webpage types, the factor loading values of items were consistently higher: sparse–dense and uncrowded–crowded were all higher than 0.75 for all six webpage types; redundant–varied, usual–surprise were all higher than 0.7 for three of six webpage types. The loading values of the factors were almost consistent across webpage types. The result suggests that the information rate scale is a consistent measurement for each of the six webpage types.
Conclusively, the information rate scale developed in this study is applicable in measuring the visual information uncertainty of webpages, although some measured items may need modification.
RQ2: Does visual information uncertainty of webpages show significant effects on viewer emotional response?
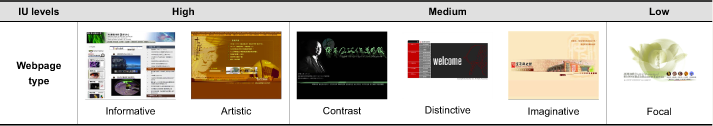
To answer research question 2, we summed all responses of the measured items and averaged them to obtain a total score for the information rate of each individual webpage. The significant main effects of the webpage types on the degrees of IU were investigated by performing an univariate ANOVA. The results indicate a statistically significant difference in the scores of the six webpage types at the 0.05 level (F=9.56, P<0.00). They can be ranked in descending order as follows: Informative (3.69), Artistic (3.63), Contrast (3.45), Distinctive (3.42), Imaginative (3.4), and Focal (3.36). By performing a further multiple range t-test with Scheffe’s method, it was found that the Informative, Artistic, and Focal webpage types have significant differences compared to the other types. The characteristics of information uncertainty of the Contrast, Distinctive, and Imaginative webpage types are very similar. Accordingly, IU of websites was identified as three levels of high, medium, and low for the further comparison of emotional responses and are shown in Table 7.
Table 7. Three IU levels of webpages

Next, the raw data acquired during emotional response evaluation were analyzed as follows: a factor analysis (principal component analysis) was conducted to extract the emotional
factors. Three factors were extracted with a cumulative contribution rate of 71.90% to describe the users’ emotional perceptions. As shown in Table 8, the first factor axis is related to pleasure, the second factor axis is arousal, and the third factor axis is dominance. This result closely agrees with Mehrabian’s PAD model.
Table 8. Factorial compositions of emotional measurement
Then, to compare the emotional perception of the three IU levels, the mean of the three factor scores were analyzed. The results of a one-way ANOVA for the three factor scores showed that a statistically significant difference exists among different IU levels at the 0.05 level. In addition, further multiple range t-test with Scheffe’s method showed that the main effects are all significant among the three emotion compositions – pleasure, arousal, and dominance. Figure 3 illustrates the mean scores of the three factors for the three IU levels of webpages. As shown, the high IU webpages (Informative, Artistic) induce more arousal emotion, and the low IU (Focal) webpages induce less arousal emotion. Meanwhile, the moderate IU webpages (Contrast, Distinctive, and Imagination) induce higher pleasure response.
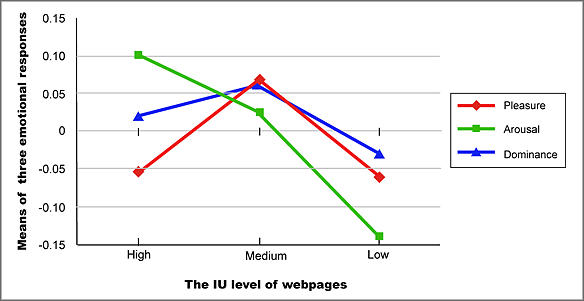
Pleasure (F=60.63, Sig. =0.00, P<0.05); Arousal (F=46.21, Sig. =0.02, P<0.05) ; Dominance (F=10.31, Sig. =0.00, P<0.05 )
Figure 3. Comparison of three emotional responses to the IU level of webpages.
Furthermore, Multivariate ANOVA was performed to explore the effects of the webpage types and the participants’ gender, training background, and on-line experience on the three emotion compositions. The emotional responses assigned by the participants to webpages were entered as dependent variables in a 2(Gender)*2(Design Training)*4(On-line Experience) MANOVA model. The results showed no significant effect in any variance on both arousal and dominance responses. However, the interaction effects among gender, on-line experience, and design training were found to be significant on pleasure. The results indicated that gender (F=4.775, P<0.05), design training (F=5.210, P<0.05), and the on-line experience of the participants (F=5.829, P<0.05) exerted significant effects. Females have higher pleasure response than males; also, participants with design background and more on-line experience received higher pleasure from websites.
RQ3: What is the relation between visual information uncertainty of webpages and viewers’ emotional responses?
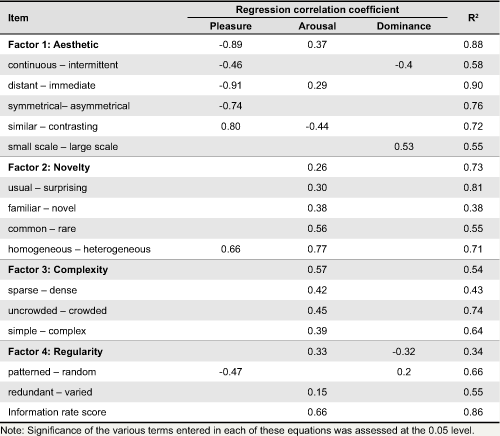
To answer research question three, regression analyses were performed to examine how the independent variables of the three emotional responses affect the dependent variables of the four factors of IU and the total information rate score. All of the variables were normalized before the analyses. The resulting equations at the significance level of 0.05 are shown in Table 9. It indicates that the R2 of the regression for the Aesthetic (0.88) and Novelty (0.73) factors is high; that for the Complexity (0.54) and Regularity (0.34) factors is low. The Aesthetic factor has been much more affected by the sense of pleasure induced in the viewer than by the sense of arousal (Aesthetic = -0.89 pleasure+0.37arousal). The Novelty and Complexity factors exist in a positive correlation only with the sense of arousal (Novelty = 0.26 arousal; Complexity = 0.57 arousal). The Regularity factor is positively affected by the sense of arousal, but negatively affected by the sense of dominance (Regularity = -0.32 dominance+0.33 arousal). Except for the Aesthetic factor, all factors are mainly affected by the sense of arousal. Furthermore, the regression equations of each measured item are also derived and shown in Table 9. It yields that all but four items have regression correlations with arousal. The results are compatible with information rate-arousal theory (Mehrabian & Russell, 1974) that information rate is primarily assessed by arousal. Finally, the relation between the information rate and emotional responses was derived from the following regression equation: Information rate = 0.66 arousal state (R2=0.86).
Table 9. Regression correlation between measured items of information rate scale and
emotional responses
Discussion
This study explores participants’ emotional responses in relation to visual information uncertainty of websites in the theoretical arguments of uncertainty avoidance within a culture, the information rate model, and the PAD emotion model. Discussions and major contributions are summarized as follows.
Cultural Tendency for Web Preference
A webpage’s degree of information uncertainty can be classified into the following three levels in descending order: High (Informative, Artistic types), Medium (Contrast, Distinctive, and Imaginative types), and Low (Focal type). The conclusion drawn from the above can be interpreted with Marcus & Gould’s UA cultural theory on websites (Marcus & Gould, 2000) and further stated below: for viewers in lower UA cultures, the nature of their emotion tends to be calmer and seems to prefer webpages that contain more information uncertainty to easily excite their emotion. Informative and Artistic webpage types with higher information uncertainty and information rate scores may fit viewers in lower UA cultures. On the other hand, viewers with aggressive nature in higher UA cultures prefer webpages with less information uncertainty and induce less arousal emotion. The Focal webpage type with lower information uncertainty and information rate score may fit viewers in higher UA cultures.
Comparison between Real and Web Environments
Compare to Mehrabian & Russell’s research on the real environment, the current study focuses on web environments. The differences between these two studies are discussed in terms of testing stimuli, methods, and results.
First, the visual stimuli of the nine representative webpages were the experimental materials in this study, while the 65 verbal descriptions of the real environment were used in Mehrabian’s research. Webpages, like some complex stimuli in everyday environments, is a combination of all the visual stimuli determined by the conditional probabilities of certain presented components in different parts of an arrangement. The effects of individual stimulus are difficult to separate from the others. Thus, visual materials would be more appropriate to represent a practical situation than oral descriptions.
Second, the applicability of the information rate scale is discussed and compared between web and real environments in the current study. A set of measured items that are suitable for assessing the IU of webpages were screened from the Mehrabian’s IRS. All of these measured items were proved to have positive coefficients with the total score of information rate (Table 5). Factor analyses on different webpage types yield that the corresponding IRS results suggested almost consistent and influential factors for each of the six webpage types. It suggests that such a measure might be used for visual information uncertainty of webpages, as well as for the real environment, artworks (France & Henaut, 1994; Locher, 1995; Tang, 1998), photographic or pictorial presentations, and video recordings. Arousal emotion is directly related to the amount of information in an environment according to information rate-arousal theory (Berlyne, 1974; Mehrabian & Russell, 1974). However, this study found that the Aesthetic factor was primarily affected by pleasure response, not by arousal response. Thus, the measured items in Aesthetic factor might be eliminated. After this elimination, the remaining nine measured items (usual–surprising, familiar–novel, common–rare, sparse–dense, uncrowded–crowded, simple–complex, homogeneous–heterogeneous, patterned–random, redundant–varied) suggest the best applicable items for measuring the information rate of web environments. They differ slightly from Mehrabian’s fourteen items, which are used to measure information rate in a real environment.
Third, both research found that information uncertainty is positively affected by viewers’ arousal emotion. However, participants still have dissimilar perceptive and cognitive responses between visual and verbal descriptions of stimuli. Since users generally concentrate only on a certain region of the computer screen and for a short time when browsing webpages, the arousal induced by the visual stimuli is likely to be more pronounced than that induced by the stimuli in larger-scale, natural environments. Consequently, the correlation coefficient corresponding to the information rate and the sense of arousal is found to be 0.66 in the current study, which is higher than the 0.57 reported by Mehrabian and Russell for real environments. It might appear that arousal affects information rate more significantly in a web environment than a real environment.
Relations between IU and Emotion on Websites
Visual IU of webpages has significant effects on viewers’ three emotions - pleasure, arousal, and dominance. The results showed that higher IU webpage types (Informative, Artistic) may induce more arousal emotion, whereas the lower IU webpage types (Focal) may induce less arousal emotion. The result of regression analysis also confirmed that visual IU of webpages and arousal exist a positive linear relation with a rate of 0.66. The pleasure emotion value reached the higher point when the IU (Contrast and Distinctive webpage types) is moderate. The result was in accordance with Berlyne’s inversed U-curve relationship between pleasure and information uncertainty. Visual information on the extremes of uncertainty (highest and lowest) did not stimulate more pleasure for viewers. The most likely explanation rests on the fact that information might be overloaded or boring to viewers in both extremes.
The tendency of one’s emotional responses is a main result of the cultural difference in uncertainty avoidance (Marcus & Gould, 2000). Therefore, it supports the validity of the assertion that the appraisal of information uncertainty could be determined by arousal, pleasure, and dominance. The discussion to follow is to further explore the regression correlations between visual IU of webpages and viewers’ emotions. The measured items of the Aesthetic factor (symmetrical – asymmetrical, continuous – intermittent, similar – contrasting, distant – immediate) are the most critical attributes of visual compositions in webpages. Good form leads to one’s positive feeling, which can process more complicated information (Berlyne, 1971a). It may explain why the Aesthetic factor is more affected by the sense of pleasure induced in the viewer than by the sense of arousal. The moderate IU webpages, which intrigue more pleasure emotion, usually have these visual features. For example, the composition of Imaginative webpages is symmetrical and the atmosphere of Imaginative types is distant. Furthermore, the Novelty and Complexity factors bear a positive correlation only with the sense of arousal. Novelty intrigues one’s motivation, and complexity engages one’s attention (Berlyne, 1974). It is reasonable to deduce that positive correlation between both factors and arousal response are mainly caused by information uncertainty. For example, high IU webpage types, such as Informative and Artistic, which are composed of more texts, images, and mysterious appearance, induce more viewers’ arousal emotion. The Regularity factor is positively affected by the sense of arousal, but negatively affected by the sense of dominance. The finding may lead one to believe that web templates and redundant elements enhance participants’ ability to control but interest them less. The examples of variant levels of webpages are illustrated in Table 10.
Table 10. Examples of variant IU levels of webpages. Webpages are reprinted with permission.
Limitation of This Study
Some limitations on the design of this study should be discussed. For example, participants all with the same major might have a partiality for certain webpage types. Pre-surveys of individuals’ tendency toward UA might be of great value in understanding the influence of culture on UA. This study focused only on the responses to static visual stimuli on webpages. The acoustic, animated visual stimuli and other interactive elements frequently used on webpage were excluded although they are an essential part of website design. It may be of interest for future research. While this study has its limitation, which does not allow for the results to be generalized, we hope that it can serve as a basis for future studies on affective design strategy for visual information culture of websites.
Conclusions
Some conclusions are drawn from this study. Informative and Artistic webpage types may better suit viewers in lower UA cultures; whereas, the Focal webpage type may better suit viewers in higher UA cultures. Visual information uncertainty of webpages has significant effects on viewers’ emotional responses. Webpages with higher IU induce arousal emotion; whereas those with lower IU induce less emotion and those with moderate IU elicit higher pleasure emotion value.
Moreover, the result of this study supports that the information rate could be an approach to describe visual information uncertainty of webpages. Four factors, such as Aesthetic, Creativity, Novelty, and Regularity, suggest the framework of visual information uncertainty of webpages. The Novelty, Complexity, and Regularity factors, which have positive and profound influence on the sense of arousal, might be the determinants of visual information uncertainty of webpage. The findings suggest that the nine items (usual–surprising, familiar–novel, common–rare, sparse–dense, uncrowded–crowded, simple–complex, homogeneous–heterogeneous, patterned–random, redundant–varied), are main contributors to the Creativity, Novelty, and Regularity factors and would be the most applicable measured items for visual information uncertainty.
Furthermore, the data indicates that the emotions of pleasure, arousal, and dominance can be a prediction of the IU levels of webpages. The correlations imply that the Aesthetic factor of a webpage is more affected by the sense of pleasure. The Novelty and Complexity factors receive positive and profound influence from the sense of arousal. The Regularity factor is positively related to arousal, but has negative relevance to dominance. The regression model between visual information uncertainty of webpages and viewers’ emotions might provide the basis for the affective computation of visual website design.
Based on these conclusions, we have listed below some implications for website design:
- The determination of visual information on websites needs to depend on the tendency of the viewers’ UA culture and their emotional responses.
- Informative and Artistic webpage types, which contain more text, images, and a mysterious appearance, induce more viewers’ arousal emotion. They are easily adapted for a person whose is naturally calmer.
- The Focal webpage type, with a main image and less information, suits people with an aggressive and easily aroused personality.
- The detailed images and symmetrical layouts on Contrast, Distinctive and Imaginative webpage types bring more pleasure to those browsing them.
- The Aesthetic factor is highly related to pleasure. The components of symmetrical layout, contrast color tone, detailed images, and such will positively bring viewers’ pleasant responses.
- Novelty primarily determines the level of uncertainty and the ease in stimulating viewers’ motivation. Surprising and novel elements are a must for web design.
- Commonly-used webpage templates may provide viewers with a sense of dominance when browsing but may not arouse viewers’ interest because of less uncertainty.
In conclusion, information uncertainty originated from information theory and is a meaningful index in estimating visual complexes of the web environment. Its relations with emotional responses induced in a viewer provide assistance to determine the information design of websites for the sake of variant uncertainty avoidance culture. The psychological concepts of information rate could be used to describe the visual IU of webpages. The regression correlations between emotion and visual information uncertainty of webpages provide the basis for affective computing design of websites
References
- Berlyne, D. E. (1963). Complexity and incongruity variables as determinants of exploratory choice and evaluative ratings. Canadian Journal of Psychology, 17(3), 274-290.
- Berlyne, D. E. (1966). Curiosity and exploration. Science, 153(3731), 25-33.
- Berlyne, D. E. (1971a). Aesthetics and psychology. New York: Appleton-Century-Crofts.
- Berlyne, D. E. (1971b). Arousal-moderating devices, aesthetics and psychobiology. New York: Appleton-Century-Crofts.
- Berlyne, D. E. (1971c). Information, uncertainty, redundancy, aesthetics and psychobiology. New York: Meredith Corporation.
- Berlyne, D. E. (1974). The new experimental aesthetics, in studies in the new experimental aesthetics. New York: John Wiley & Sons.
- Clalhoun, J. B. (1962). Population density and social pathology. Scientific American, 206(2), 139-148.
- Cleveland, P. (2008). Aesthetics and complexity in digital layout systems. Digital Creativity, 19(1), 33–50.
- Clore, G. L. (1994). Why emotions vary in intensity. In P. Ekman & R. J. Davidson (Eds.), The nature of emotion,fundenmental questions (pp. 386-393). Oxford: Oxford University Press.
- Davis, L., Wang, S., & Lindridge, A. (2007). Culture influences on emotional responses to on-line store atmospheric cues. Journal of Business Research, 61(8), 806-812
- Deng, L. (2006). Beyond usability: Affect in web browsing. Unpublished doctoral dissertation, Texas A&M University. Texas, USA.
- Dictionary.com. (2008). Complexity factor definition. Retrieved January 12, 2008, from http://www.businessdictionary.com/definition/complexity-factor.html
- Dormann, C. (2006). Cultural representations in Web design: Differences in emotions and values. In T. McEwan, J. Gulliksen, D. Benyon (Eds.), In Proceedings of HCI 2005: People and Computers XIX - The Bigger Picture (pp. 285-299). London: Springer.
- Eroglu, S. A., Machleit, K. A., & Davis, L. M. (2003). Empirical testing of a model of online store atmospherics and shopper responses. Psychology & Marketing, 20(2), 139-150.
- France, M. M., & Henaut, A. (1994). Art, therefore entropy. Leonardo, 27(3), 219-221.
- Golitsyn, G. A., & Petrov, V. M. (1995). Information and creation: Integrating the “Two Cultures”. Basel: Birkhäuser Verlag.
- Hofstede, G. (1997). Cultures and organisations software of the mind. London: McGraw-Hill.
- Isen, A. M. (1987). Positive affect facilitates creative problem solving. Journal of Personality and Social Psychology, 52, 1122-1131.
- Kitayama, S., & Markus, H. R. (1994). An introduction to cultural psychology and emotional research. In S. Kitayama & H. R. Markus (Eds.), Emotion and culture: Empirical studies of mutual influence (pp. 37-57). Washington, DC: American Psychological Association.
- Liu, Y. (2000). The aesthetics and the ethic dimensions of human factors and design. Ergonomics, 46(13-14), 1293-1305(13).
- Locher, J. P. (1995). A measure of the information content of visual art stimuli for studies in experimental aesthetics. Empirical Studies of the Arts, 13(2), 183-191.
- Marcus, A. (2006). Cross-cultural user-experience design. In Proceedings of the 4th International Conference, Diagrams 2006: Diagrammatic Representation and Inference (pp.16-24). Berlin: Springer.
- Marcus, A., & Gould, E. W. (2000). Cultural dimensions and global web user-interface design. Interactions, 7(4), 32-46.
- Mehrabian, A. (1972). Nonverbal communication. Chicago: Aldine-Atherton.
- Mehrabian, A. (1996). Pleasure-arousal-dominance: A general framework for describing and measuring individual differences in temperament. Current Psychology: Developmental, Learning, Personality , Social, 14(4), 261-292.
- Mehrabian, A., & Russell, J. A. (1974). An approach to environmental psychology. Cambridge, MA: The MIT Press.
- Oliva, A., Mack, M. L., Shrestha, M., & Peeper, A. (2004). Identifying the perceptual dimensions of visual complexity of scenes. Paper presented at the 26th annual meeting of the Cognitive Science Society, Chicago, IL.
- Osgood, C. E., Suci, G. J., & Tannenbaum, P. H. (1957). The measurement of meaning. Urbana: University of Illinois Press.
- Petrov, V. M. (2002). Entropy and stability in painting: An information approach to the mechanisms of artistic creativity. Leonardo, 35(2), 197-202.
- Proshansky, H. M., Ittelson, W. H., & Rivlin, L. G. (1970). Freedom of choice and behavior in a physical setting. In H. M. Proshansky, W. H. Ittelson, & L. G. Rivlin (Eds.), Environmental psychology: Man and his physical setting (pp. 173-183). New York: Holt, Rinehart & Winston.
- Russell, J. A. (1980). A circumplex model of affect. Journal of Personality and Social Psychology, 39(6), 1161-1178.
- Shannon, C., & Weaver, W. (1963). Mathematical theory of communication. Urbana: University of Illinois Press.
- Simon, S. J. (2001). The impact of culture and gender on web sites: An empirical study. SIGMIS Database, 32(1), 18-37.
- Snider, J. G., & Osgood, C. E. (1969). Semantic differential technique. Chicago: Aldine Publishing Company.
- Stamps III, A. E. (2002). Entropy, visual diversity, and preference. The Journal of General Psychology, 129(3), 300-320.
- Tang, C. K. (1998). Information rate and aesthetic preference of modern static computer artworks in terms of viewers.Unpublished master dissertation, National Chiao Tung University. Hsinchu, Taiwan.
- Terwilliger, R. F. (1963). Pattern complexity and affective arousal. Perceptual and Motor Skills, 17, 387-395.
- Triola, M. F. (2007). Elementary statistics. Boston: Addison Wesley.
- Tsai, T. W., Chang, T. C., & Chen, K. S. (2006). Intriguing young people on website. Paper presented at the design & emotion 2006 conference, Gothenburg, Sweden.
- Vitz, P. C. (1966). Preferences for different amounts of visual complexity. Behavior Science, 11(2), 105-114.
- Wimelius, H. (2004). Fundamentals of user perception and interaction: Environmental psychology applied in a study of web pages. PsychNology Journal, 2(3), 282-303.
- Wundt, M. E. (1905). Fundamentals of psychology (7th ed.). Liepzig: Engelman.
- Xing, J. (2004). Measures of information complexity and the implications for automation design (No. DOT/FAA/AM-04/17). Virginia: Office of Aerospace Medicine Federal Aviation Administration.
