
How to Rate 100 Visual Stimuli Efficiently
Graduate School of Design, National Taiwan University of Science and Technology, Taipei, Taiwan
Perceptual mapping is a method often employed in design and marketing as a means for visualizing consumer perceptions of product alternatives on the market. Perceptual maps can be computed from two types of data, from attribute ratings or from similarity judgments. In this paper, two computer-based methods are proposed for obtaining attribute rating data, based on multiple attribute scales, for a large number of visual stimuli: The hierarchical sorting method was developed from a strategy commonly employed in paper-and-pencil surveys, whereas the divide-and-conquer method was developed from a strategy often utilized in (computer) sorting of algorithms. In tests that used 100 armchairs as stimuli, it was found that both methods received high scores for simplicity and overall satisfaction in subjective evaluations by the participants. The evaluations, however, also showed that each method had its own advantages. While the divide-and-conquer method produced equivalent results in a significantly less amount of time than the hierarchical sorting method, the hierarchical sorting method was considered to have a higher likelihood of expressing actual opinions than the divide-and-conquer method, due to the fact that a participant using the sorting method could focus on the details of the stimuli after they had been grouped by similarity at the initial stage.
Keywords - Perceptual Mapping, Attribute Rating, Semantic Differential, Hierarchical Sorting, Divide-and-Conquer.
Relevance to Design Practice – User perception is an important issue in product design. However, as the variety of products on the market increases, it becomes more difficult to determine user perceptions. The rating methods developed in this research provide designers with a means for understanding consumer preferences toward a large number of product alternatives.
Citation: Chuang, Y., & Chen, L. L. (2008). How to rate 100 visual stimuli efficiently. International Journal of Design, 2(1), 31-43.
Received June 29, 2007; Accepted October 16, 2007; Published April 1, 2008
Copyright: © 2008 Chuang and Chen. Copyright for this article is retained by the authors, with first publication rights granted to the International Journal of Design. All journal content, except where otherwise noted, is licensed under a Creative Commons Attribution-NonCommercial-NoDerivs 2.5 License. By virtue of their appearance in this open-access journal, articles are free to use, with proper attribution, in educational and other non-commercial settings.
*Corresponding Author: yaliang.chuang@gmail.com.
Introduction
Aesthetics has always been an important factor in design. In recent years, however, “emotional design” (Norman, 2004) has begun to receive growing attention in a diverse range of design specialties, from website design (Kim, Lee, & Choi, 2003) to the design of vehicle controls (Schütte & Eklund, 2005) and passenger cars (Lai, Chang, & Chang, 2005). Jordan (2000) also proposed the notion of “pleasurable design” as the next step beyond the fulfillment of functionality and usability. A general framework of affective responses elicited by products and experienced by users has been proposed in Desmet & Hekkert (2007), in which the experience of a product by a consumer is classified into three distinct types: aesthetic experience, experience of meaning, and emotional experience.
To study the perceptions of products by target consumers, perceptual maps are often used by marketing researchers, psychologists, and designers as a means for visualizing consumer perceptions of product alternatives on the market (Urban & Hauser, 1993; Moore & Pessemier, 1993). Product perceptual maps are computed either from attribute rating data or similarity judgments, by using a number of methods, including factor analysis and multidimensional scaling. In the process of collecting the attribute rating data or the similarity judgments, each alternative product can be represented by a photograph that has been pre-processed so as to remove the background and other irrelevant details. Sometimes, text descriptions of each product are also included. The product alternatives can then be evaluated by the participants, who rate a product according to a number of attributes, or judge the similarities between pairs of product alternatives, as illustrated in Figure 1 (a) and (b), respectively.
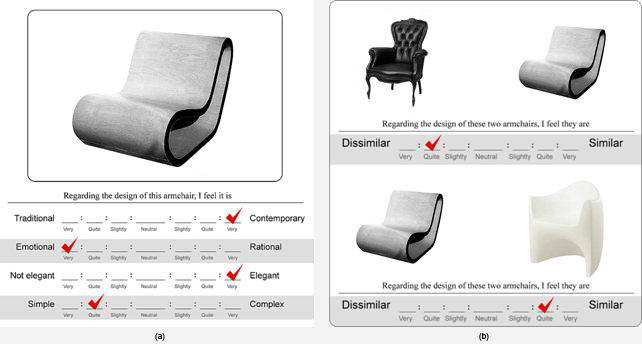
Figure 1. (a) Attribute Ratings and (b) Similarity Judgments. Image source: Pao&Paws, 2005. Reprinted with permission.
Based on these attribute ratings or similarity judgments, perceptual mapping algorithms are calculated and used to create a low-dimensional map, such that each point on the map corresponds to a product alternative and the distance between any two points matches, as much as possible, the perceived difference (as indicated by the survey data) between the corresponding products. In other words, if two products are perceived as similar, the points representing them on the map are placed close together; or, if two products are perceived as dissimilar, the corresponding points are placed farther apart. Using attribute rating data, it is also possible to compute vectors that represent bipolar attribute scales and to place them accordingly on the perceptual map (Urban & Hauser, 1993).
Figure 2 shows a perceptual map that was computed from the attribute rating data for 20 representative armchairs, collected from ratings by 30 participants, using 10 bipolar adjective scales (Cheng, 2003). On the resulting perceptual map, the locations of the armchairs correspond to the similarities perceived by the participants. For example, in the lower right-hand corner, several armchairs that were described by participants as “contemporary,” “hard,” and “simple” in design are located closely together. Several attribute vectors are also shown on the map. For example, close to the horizontal axis is the attribute vector “Traditional–Contemporary,” the placement of which allows us to suggest the general perception of a product in relation to these two opposites: the farther an armchair is located to the right of the map, the more contemporary is its perceived identity or meaning; the farther it is located to the left, the more traditional its perceived meaning. Thus, for designers, the product perceptual map is particularly valuable in that it clearly connects each alternative product with its perceived meaning. By determining the common features (for example, with regard to form, material, and color) of those products that express a certain perceptual meaning, as shown on the perceptual map, designers can gain insights into how to design a product that will deliver a specific meaning to the consumer.

Figure 2. Perceptual map of 20 armchairs
(adapted and redrawn from Cheng, 2003, p.62).
Although product perceptual maps can provide useful insights for designers, the number of product alternatives (or visual stimuli) that can be included on a map is usually limited. This is because, without suitable tools, it is too time-consuming to collect attribute rating data or similarity judgments for more than 20~30 visual stimuli. For most studies, this means that some type of selection process must be conducted to reduce the number of product alternatives to a manageable level before the actual survey can take place. An investigation of the existing literature shows that researchers commonly collect more than 50 visual stimuli at the initial stage of research. For example, Grimsæth (2005) collected 51 drills from among those on the market; Nagamachi (2002) obtained 60 samples of cosmetic containers made by a wide variety of companies; Chuang and Ma (2001) selected 75 micro-electronic products from various reference books on international contemporary design; Lai et al. (2005) compiled 125 stimuli from existing passenger cars; and Chang and Wu (2007) gathered 262 stimuli of household products from three major international competitions (iF, IDEA, and G-Mark) and from the brochures published by large companies such as Alessi and Philips. Due to the limitations of available tools, however, most of these researchers ended up investigating fewer than 30 stimuli in their main experiment, for example, the 13 drills selected in Grimsæth’s research, the 30 products investigated in the user survey of Chuang and Ma’s study, the 27 passenger cars in the study by Lai et al. (2005), and the 19 stimuli employed in Chang and Wu’s research.
Some studies have used large sets of stimuli. For example, Bashour (2006) used 134 face images to measure facial attractiveness; Llinares and Page (2007) selected 114 stimuli to investigate purchasers’ perceptions of buildings and urban developments; and Lai, Lin, Yeh, and Wei (2006) used 288 mobile phone samples to investigate the optimal combinations of form and color in phone product design. But, without the proper survey tools, such studies mean long experimental sessions that can lead to user fatigue and data inaccuracies. It is reported in the literature (Andreassen & Fletcher, 2007, p.8-6) that 45 minutes was needed for conducting card sorting of 100 word-based stimuli for one attribute. Based on our past experience, approximately the same amount of time would be required for rating 100 visual stimuli with respect to just one attribute. When collecting rating data that involves a number of attributes, the time required can quickly run into several hours, a situation that becomes a burden to the participants.
To reduce the number of stimuli, a set of representative stimuli are usually selected by expert evaluation and other systematic techniques. However, it is possible that some stimuli representing specific variations and design properties might be excluded during this selection process (Llinares & Page, 2007). In addition, due to differences between the conceptual models perceived by experts and by users (Norman, 1990; Hsu, Chuang, & Chang, 2000), user preferences might not be fully represented by a small set of stimuli selected by experts.
As a result, the small number of stimuli that can be included in a paper-and-pencil survey restricts a researcher’s ability to fully examine consumer perceptions and preferences. As designs of products become more highly varied, a researcher may wish to conduct studies with a larger set of stimuli, covering as much as possible the full spectrum of a product class. Figure 3 shows a perceptual map constructed in the process of this research that is based on attribute rating data for 100 armchairs, collected from ratings given by 30 participants using five bipolar adjective pairs. Compared to the previous perceptual map of 20 stimuli (Figure 2), this 100-product perceptual map clearly provides much more information for designers. In addition to showing a greater number of products, it also goes much further in showing the relative perceived meaning of any one product alternative.
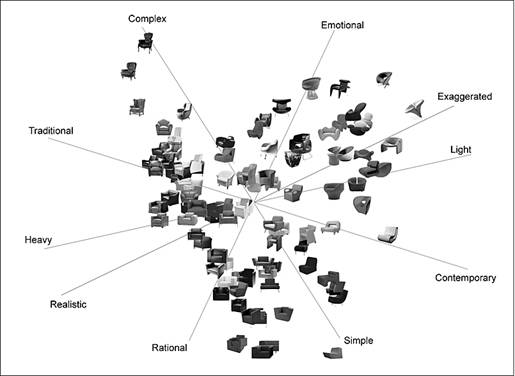
Figure 3. Perceptual map of 100 armchairs.
In this study, the researchers focused on developing tools suitable for collecting attribute rating data for a large number of products for the purpose of constructing perceptual maps. Specifically, we developed two computer-based methods for rating a large number of visual stimuli efficiently, based on the hierarchical sorting strategy commonly employed in paper-and-pencil surveys, and the divide-and-conquer approach often employed in (computer) sorting of algorithms (Aho, Ullman, & Hopcroft, 1983). Experiments were then conducted to evaluate the performance and reliability of the proposed rating methods.
Development of the Two Rating Methods
In our previous study (Chuang, Chen, & Chuang, 2008), we found that computer-based rating methods using real-time adjustment and interactive drag-and-drop operations hold high potential for rating a large number of products. The benefits of such methods include the ability to simulate daily shopping decisions, in which multiple products are compared simultaneously, the ability to obtain more accurate data, and the ability to offer a better user experience, as indicated by subjective evaluation scores. Based on these results, two interactive rating methods for assessing large sets of stimuli were developed.
First, a rating method was developed based on the hierarchical sorting strategy, commonly employed in paper-and-pencil surveys on product perceptions. In hierarchical sorting, a participant sorts a large number of stimuli in a hierarchical fashion: first sorting them roughly into a number of groups, then gradually refining each group into smaller and smaller subgroups. For example, in a study by Chang and Chen (2007), participants were asked to first roughly sort 144 stimuli into three groups; then, to sort each of these three groups into three subgroups according to their evaluation of the degree to which a stimulus satisfied a specific adjective, such as “elegant.”
A second rating method was developed based on the divide-and-conquer strategy, widely applied in the design of computer algorithms (Aho et al., 1983; Cormen, Leiserson, & Rivest, 1990). This strategy works by recursively dividing a big problem into smaller problems, conquering the smaller sub-problems, and then combining solutions to the smaller problems to form a solution to the original big problem. For example, the merge sort algorithm (Cormen et al., 1990) employs the divide-and-conquer strategy for sorting, where a set of n elements is recursively divided down into two subsets of n/2 elements, until the size of a subset is small enough to permit sorting to be done easily, e.g., when n = 1 or 2. The sorted subsets are then recursively merged back up the hierarchy to form longer and longer subsequences of sorted elements, until the entire sequence is obtained in sorted order.
Both the hierarchical sorting and the divide-and-conquer strategies are attempts to reduce the number of stimuli that need to be compared in detail by a participant. The difference is that, for the hierarchical sorting strategy, the division of stimuli into groups is done manually by the participant based on some criteria, whereas for the divide-and-conquer strategy, the division is done by a computer, automatically, randomly, and as evenly as possible. Thus, during the division stage, considerably more effort is needed from a participant using the hierarchical sorting strategy. In addition, groups at the same level of hierarchy might have different numbers of stimuli when using the hierarchical sorting strategy. During the merging stage, the reverse is true. For the hierarchical sorting strategy, merging of the subgroups is done simply by concatenation, because the groups are formed by rough sorting to begin with. On the other hand, for the divide-and-conquer strategy, merging of the individually sorted subgroups requires clever algorithm design in order to achieve efficiency. In the following subsections, we describe the development of each method in more detail.
Rating Method Based on Hierarchical Sorting Strategy
In this section, we describe the application of a rating method that attempts to simulate the paper-and-pencil approach for dealing with a large number of stimuli. For this rating method, developed based on the hierarchical sorting strategy, a participant rates the stimuli with respect to each rating scale in four steps: divide, conquer, merge, and confirm. The “Rational–Emotional” scale will be used as an example to demonstrate the rating process.
Step 1. Divide (by the user). The participant browses through the entire set of stimuli, and divides them into three groups: a Rational group, an Emotional group and a Neutral group, according to the participant’s rough judgment of the degree of rational or emotional meaning conveyed by each stimulus. If necessary, as determined by the researcher, the participant can be directed to divide each of these groups further, until the number of stimuli in each group is small enough for direct rating by the participant. In the example illustrated in Figure 4, only one level of division into three groups was performed. The armchairs were initially displayed on the lower part of the screen. The participant then interactively dragged and dropped each armchair to the appropriate group at the top of the screen.
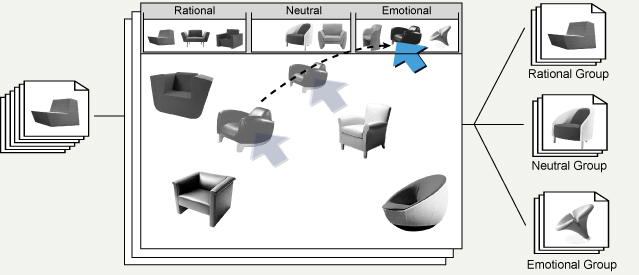
Figure 4. Divide step of the hierarchical sorting method.
Step 2. Conquer (by the user). The participant next rates the stimuli in each group. For example, as shown at the top of Figure 5, the subset of armchairs for the Rational group was initially displayed on the lower part of the screen. The participant then interactively dragged and dropped each armchair to the appropriate position on a scale from “Extremely Rational” to “Slightly Rational” at the top of the screen, by comparing each one against the others in the same group.
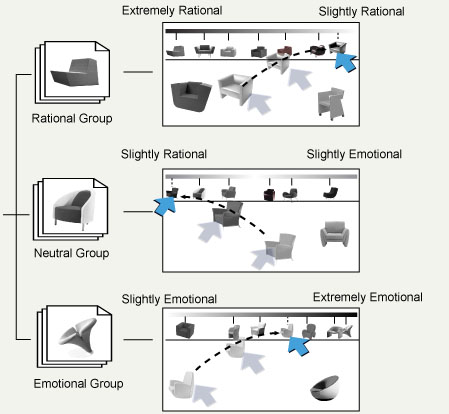
Figure 5. Conquer step of the hierarchical sorting method.
Step 3. Merge (by the computer). The rating results for all of the groups are concatenated by the computer to form the combined rating results. It takes less than three seconds to merge and generate a graphical representation of the results, like the one shown in Figure 6.
Step 4. Confirm (by the user). After examining the combined rating results, the participant may adjust the rating scores for stimuli as necessary, as can be seen in Figure 6. After these final adjustments, the participant confirms the overall rating results by clicking a “confirm” button, and then continues to rate the stimuli according to other scales.
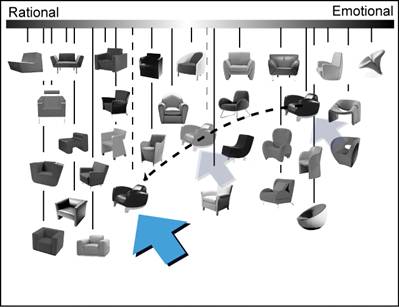
Figure 6. Confirm step of the hierarchical sorting method.
Rating Method Based on Divide-and-Conquer Strategy
In this section, we describe the application of a second rating method, developed based on the divide-and-conquer strategy. Similarly to the hierarchical sorting method, a participant rates the stimuli with respect to each rating scale in four steps: divide, conquer, merge, and confirm.
Unlike the hierarchical sorting method, in which the stimuli are first roughly sorted into three groups by the user, the division of stimuli into groups is done by computer for the divide-and-conquer method. Each group consists of a random subset of stimuli that can then be “conquered” by the user. This random division removes the lengthy process required for a participant to examine all stimuli and to manually sort them into groups. However, because the stimuli are now randomly divided, a clever merging mechanism needs to be developed to re-combine the rating results of these random subsets.
Our idea is to make use of three “anchor” stimuli that are presented in all groups to facilitate the merging step. These three anchor stimuli are chosen to sufficiently define the full range of the stimuli, with one near the minimum, one near the middle, and one near the maximum ratings of the particular scale, e.g., “Rational–Emotional.” Let smin, smid, and smax denote the three anchor stimuli. For each group, a participant rates the random subsets of stimuli, each of which contains the three anchor stimuli, smin, smid, and smax. After the participant completes rating all of the groups, the computer then makes use of the different locations of smin, smid, and smax within the different groups to obtain the merged ratings. Specifically, the rating of a stimulus within each group is first increased or decreased according to the scaling factors defined by the vectors smid smin or smid smax, depending on whether the stimulus lies to the left or the right of smid in that group. The (stretched or shrunken) ratings of the stimuli in the different groups can then be stacked on top of each other by aligning the locations of smid to obtain the overall rating results.
The three anchor stimuli, which roughly correspond to the minimum, the middle, and the maximum ratings for a scale, also help to eliminate the potential anchoring problem (Böckenholt, 2004). This anchoring problem refers to the biases that arise when making comparisons against a reference, or anchor, point (Sherif & Hovland, 1961). By providing smin, smid, and smax as global references, a participant can make judgments that are less influenced by the particular composition of the stimuli in a randomly generated group. To ensure that the three anchor stimuli sufficiently define the full range of the stimuli, an initialization step, as described in the next section (Initialization for Divide-and-conquer Rating Method), is developed for selecting stimuli to be included in the first group, and executed only once prior to the rating survey being conducted.
In the following steps, the “Rational–Emotional” scale will again be used as the example scale to demonstrate the rating process for the divide-and-conquer method.
Step 1. Divide (by the computer). Let S denote the original set of stimuli. The set S is divided into a number of groups, Si, i = 1, …, g, of approximately the same size, so that the number of stimuli in each group is small enough for direct rating by a participant. The first group, S1, is formed by the initialization step described in the next section (Initialization for Divide-and-conquer Rating Method), while the rest of the groups are randomly generated by the computer, with the addition of smin, smid, and smax as the anchor stimuli. In this research, the set of stimuli is divided into five groups of approximately the same size, as illustrated in Figure 7.
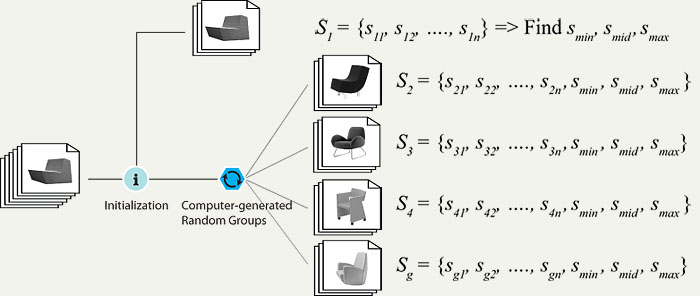
Figure 7. Divide step of the divide-and-conquer method.
Step 2. Conquer (by the user). As explained previously, the first group, S1, is treated differently than the other groups. The participant begins by dragging and dropping each stimulus in the first group, S1, to an appropriate place on the scale displayed at the top of the screen in order to rate them (Figure 8, top). Those stimuli in the first group that are given the minimum score, the nearest to the middle score, and the maximum score, denoted as smin, smid, smax, are selected as the anchor stimuli. These three anchor stimuli are automatically added to the remaining groups, S2~Sg. When a participant rates the stimuli in a group Si, the three anchor stimuli are displayed on the scale as reference points, marked by a triangle, a circle and a rectangle, as seen in Figure 8. The participant then interactively drags the rest of the stimuli from the bottom of the screen up to the appropriate positions on the scale, also as illustrated in Figure 8. Meanwhile, the participant can also adjust the positions of the three anchor stimuli to reflect their order in the respective group.
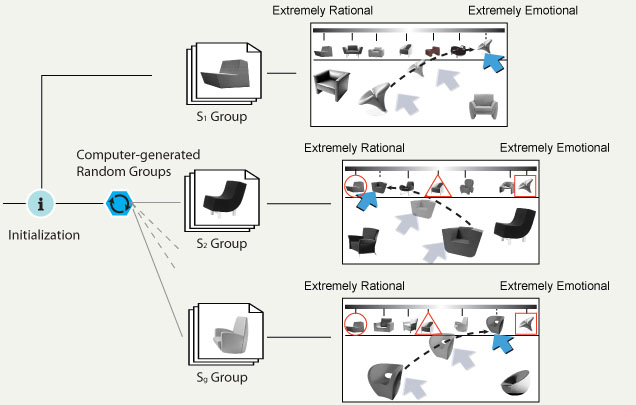
Figure 8. Conquer step of the divide-and-conquer method.
Step 3. Merge (by the computer). After the participant completes rating the stimuli for all of the groups, the rating results are combined by the computer to form the overall ratings. Note that, at Step 2, the participant can adjust the three anchor stimuli, smin, smid, smax, to reflect any perceived differences among the stimuli in any one group. Thus, the merging cannot be done simply by aligning the three anchor stimuli. Instead, the rating of a stimulus within a group is first increased or decreased according to the scaling factors defined by the vectors smid smin or smid smax, and then merged into the overall rating results. With the equipment used in our experiment (an Intel Pentium IV, 2.8 giga Hz CPU, 1 gigabyte RAM), it took less than three seconds to merge the rating results and to display a visual representation of the overall ratings on the screen. The details of the merge mechanism are explained in the following paragraphs.
We merged the rating results of groups Si, i = 1, …, g-1, into the rating results of the last group, Sg, to obtain the combined results. The mechanism of the merge is illustrated in Figure 9. Two equations were developed to estimate the final score for a stimulus sij in the group Si.
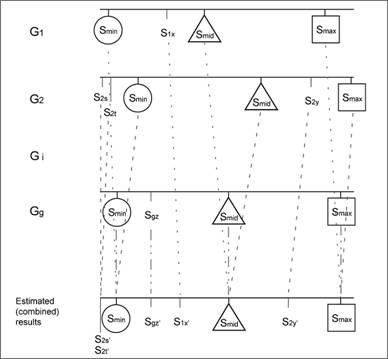
Figure 9. Merge step of the divide-and-conquer method.
First, we calculated the scaling factors, ΔLi andΔRi, to be applied to the stimuli in Si that lie to the left and to the right of smid, respectively. Let Gi(smin), Gi(smid), and Gi(smax) denote the scores for smin, smid, and smax in the group Si; and let Gg(smin), Gg(smid), and Gg(smax) denote the scores of smin, smid, and smax rated in the last group, Sg. Then, ΔLi andΔRi are computed using equation (1).
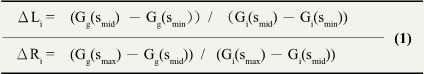
Second, the estimated final score of each stimulus, F(sij), was calculated based on the initial score Gi(sij) of the stimulus sij in group Si using equation (2).
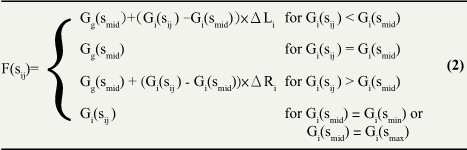
During the estimation process, if Gi(smid) was found to be rated at the same value as Gi(smax) or Gi(smin), i.e., Gi(smid)=Gi(smin) or Gi(smax)=Gi(smid), the system would skip the calculation (because the denominator would be zero in these cases) and use the original scores Gi(sij ) to plot the stimuli in the combined results. The scaling equations do allow for cases in which a stimulus sij is rated at a value smaller than that of smin, or larger than that of smax. Such a value can still be scaled according to the scaling factorsΔLi andΔRi. If the estimated final score F(sij) is out of bounds, the score will be set to the minimum (0) or the maximum values allowed. In such cases, the system will display a warning message that asks the participant to check the overall results carefully at the confirmation step. However, because the initialization step ensured that the three anchor stimuli were sufficiently different to serve as effective anchors, these out-of-range problems did not occur in our experiment.
Step 4. Confirm (by the user). The participant reviews the combined results and adjusts the score for any stimulus by directly dragging and dropping it to the appropriate position (as demonstrated in Figure 10). This confirmation process is the same as that of the hierarchical sorting method.
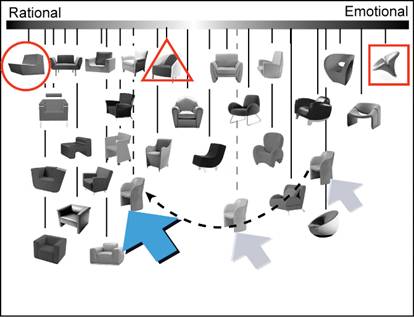
Figure 10. Confirm step of the divide-and-conquer method.
Initialization for Divide-and-conquer Rating Method
As described in the previous section (Rating Method based on Divide-and-Conquer Strategy), critical to the success of the divide-and-conquer strategy is an efficient method for merging the solutions of the sub-problems to form the solution to the original problem. In applying the divide-and-conquer approach, we first divide the set of all stimuli into a number of groups; then, we have the participants rate the more manageable size of stimuli within each group; and finally, we merge the rating results for the individual groups into (an approximate of) the overall rating results. The idea is to make use of three anchor stimuli (smin, smid, and smax) that are presented in all of the groups to calculate the scaling factors (ΔLi, ΔRi) for merging the rating results from the different groups. For the scaling factors to be estimated as correctly as possible, the three anchor stimuli need to adequately define the full range (the minimum, the mid point, and the maximum) of the stimuli. We can select the three anchor stimuli from the rating results of the first group, so that smin, smid, and smax correspond to the stimuli that have the minimum, the nearest to the middle, and the maximum scores. However, the stimuli in the first group need to be sufficiently diverse for this strategy to work. We therefore devised an initialization step for selecting stimuli to be included in the first group.
A quick sorting experiment with the hierarchical sorting strategy was conducted for the initialization step. We asked six participants to sort the stimuli with respect to each of the five bipolar scales separately. They first roughly sorted the 100 stimuli into three groups, for example, an Emotional group, a Rational group and a Neutral group; then, for each group, they further sorted the stimuli into three subgroups according to the degree of the specific adjective image, e.g., quite emotional, very emotional, and extremely emotional. After the rough sorting, the 100 stimuli were divided into nine groups, according to varying degrees of the specific adjective word. On the average, it took a participant 8.75 minutes to sort the 100 stimuli into nine groups for each bipolar scale. Then, 20 stimuli were selected from the sorting data of the six participants. Specifically, six, eight, and six stimuli were selected from the first, the middle (5th), and the last (9th) groups, respectively. The selected stimuli were pre-assigned to be rated in the first group of the main experiment. In this way, the anchor stimuli (smin, smid, and smax) would be sufficiently different and could be used to derive reliable estimates of the scaling factors for the merging of the groups.
Experiment Design
Prior to the main experiment, a pilot study was conducted to obtain an initial understanding of the two methods. Six graduate students of the authors’ department were invited to test the rating task using the same settings of the actual experiment (described in the previous section [Rating Method based on Hierarchical Sorting Strategy]). Based on the results of the pilot study, it was found that when using the hierarchical sorting method, it took a participant 20 minutes to rate the 100 armchairs with respect to a single scale. On the other hand, each participant spent less than 10 minutes to complete the rating task for a single scale when using the divide-and-conquer method. Because more than 10 scales are often needed in a product perception survey (e.g., Chuang, Chang, & Hsu, 2001), the hierarchical sorting method could be very time-consuming in practice (based on an estimated 200 minutes for 10 scales). In this study, we decided to use a rating survey with five scales for evaluating the performance and reliability of the divide-and-conquer method (for an estimated time of less than 50 minutes); and to use a survey with only two scales for the hierarchical sorting method (for an estimated time of 40 minutes). The results of the hierarchical sorting approach were used as a simulation of the traditional pencil-and-paper method for comparison purposes. The experiment was conducted in a fixed order for every participant, and was conducted over a period of three weeks, with an interval of one week between each test provided to eliminate any potential learning effects.
Experiment Design
Within Subject Design
The experiment for this study was designed as a “within subject” experiment, in which a participant evaluates both rating methods. The experiment took place over a course of three weeks. A total of 30 participants were invited to rate 100 armchairs using the divide-and-conquer rating method (with five rating scales) during the first two weeks, and then to rate the same 100 chairs using the hierarchical sorting method (with two scales) in the third week. For each evaluation, the amount of time needed for the rating procedure was recorded as a way to determine the efficiency of the rating methods. At the end of the experiment, each participant was asked to describe his/her experience using the specific rating method by answering several close-ended questions. The results of the test and retest for each participant were used to analyze the reliability of the divide-and-conquer method.
Experiment Procedure
Each time a participant began to use the rating method, an animated demonstration, with similar instructions as those suggested by Osgood, Suci, and Tannenbaum (1957, p.82), was first shown to help him/her understand how to rate stimuli using the specified method. After completing several warm-up tests, the participant then started to rate the stimuli in a randomized sequence with respect to the bipolar adjective scales. At the end of the experiment, the participant was asked to rate the method based on his/her subjective feeling and usage experience.
Materials (Stimuli & Bipolar Adjective Scales)
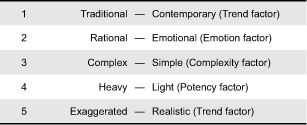
The armchair, a product familiar to most people, was used as the example product to experimentally evaluate the performance of the methods developed in this research. A total of 100 stimuli (Table 1) were collected from more than 10 books. At the same time, five bipolar adjective scales (Table 2) were selected from a previous study on the fundamental dimensions of affective responses to product shapes (Hsiao & Chen, 2006). The scales were represented by a continuous gradient bar and labeled according to nine degrees, adapted from those used in the computer program Surveyor (Heise, 2001), e.g., extremely rational, very rational, quite rational, slightly rational, neutral, slightly emotional, quite emotional, very emotional, and extremely emotional. In addition, an extra “unable to express” option was provided that participants could select when they did not consider the specific bipolar scale to be applicable (Hughes, 1969). This extra option was included as an attempt to eliminate errors resulting from forced answers.
Table 1. The 100 armchairs used in the experiment
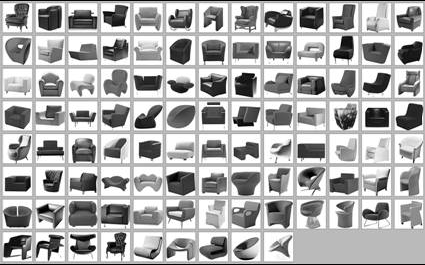
Table 2. The five bipolar affective adjectives used in the experiment (translated from Chinese)
Control of Other Factors
To allow a participant to easily rate the stimuli using an interactive drag-and-drop operation, the display area was enlarged by placing two 17-inch LCD monitors next to each other. In addition, a vertical 19-inch LCD monitor was used as a magnifier for displaying the stimuli in larger sizes (in the final confirmation step). When a participant moved the mouse/cursor to review or adjust a stimulus, the image of the stimulus was enlarged and dynamically updated on the screen. The equipment setup is shown in Figure 11.
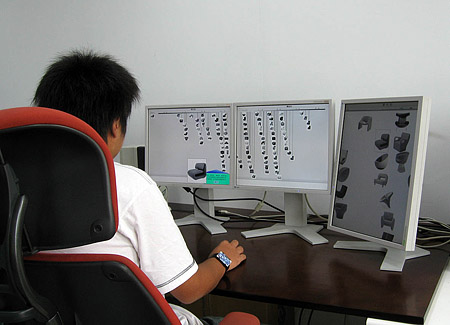
Figure 11. Experiment setup.
Performance Measurements
To evaluate the performance of the two methods, the following characteristics were assessed:
Efficiency: During the data collection process, the time used by a participant was automatically recorded and coded with respect to three categories: dividing time (Td), conquering time (Tc), and the time used in the final confirmation step (Tfc). In the next section, the efficiency of the methods will be discussed based on these data.
Test/retest reliability: The rating data given by each participant in the test and retest of the divide-and-conquer method was used to evaluate the reliability of this method. There were 15,000 pairs of raw data (consisting of 100 stimuli, 5 scales, and 30 participants) collected for the analysis.
Subjective feelings: At the end of the experiment, each participant was asked to indicate his/her feelings toward the rating method with respect to simplicity, fatigue, likelihood of expressing actual opinions, and overall satisfaction. Four rating scales were developed, each using nine adverb labels, e.g., extremely difficult, very difficult, quite difficult, slightly difficult, neutral, slightly easy, quite easy, very easy, and extremely easy. The participant dragged the slider to the proper location on the scale to express his/her feelings. The scores were calculated in real time and shown next to the scale. The participant could also directly input a score, ranging from 0 to 100 (as illustrated in Figure 12). To facilitate the participant in expressing the degree of fatigue experienced using the method, he/she was asked to indicate his/her initial state with regard to fatigue at the beginning of the experiment. After completing the rating tasks, the participant was then asked to adjust this initial score to express his/her degree of fatigue after using the specific rating method.
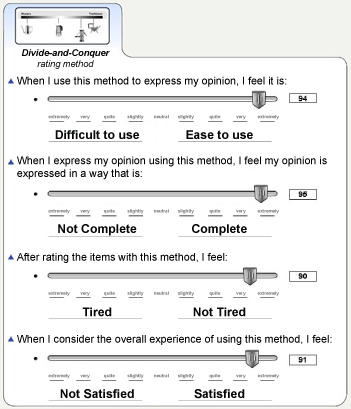
Figure 12. Subjective evaluation of rating methods.
Profile of Participants
Thirty students from the authors’ department participated in the experiment. All of the students were majoring in Industrial Design and were between 21 and 29 years of age. On the average, it took a participant 50 minutes to complete each of the three experiments, including the introduction, warm-up test, and the main rating tasks. They received an incentive of 400 New Taiwan dollars (about 12 US dollars) for their participation.
Results
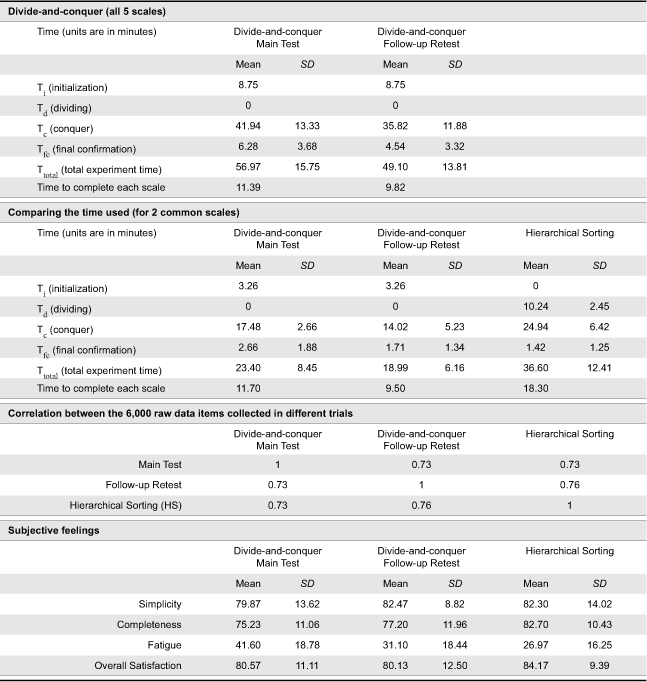
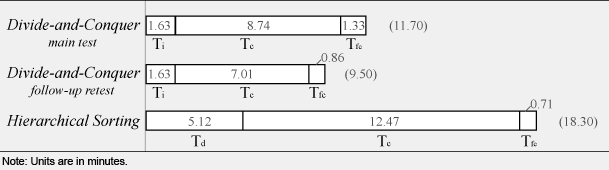
On the average, it took a participant 11.39 minutes to complete the rating of 100 stimuli with respect to one scale by using the divide-and-conquer method, and 18.30 minutes by using the hierarchical sorting method. Comparing the 6,000 pairs of data (consisting of 100 stimuli, 2 scales and 30 participants) collected with these two methods, the average correlation is 0.72. The overall results are displayed in Table 3. A two-dimensional perceptual map, obtained by using MDPREF (with 0.88 as the cumulative proportion of variance) and based on the data collected with the divide-and-conquer method, is displayed in Figure 3.
Table 3. Test results
Perceptual Maps
Comparing the perceptual map of 100 stimuli (Figure 3) constructed in this study to the map of 20 stimuli (Figure 2), we observed that both maps show “Traditional–Contemporary” and “Rational–Emotional” to be two important attribute scales for describing consumer perceptions of armchairs. On both maps, the vectors that correspond to these two attributes are located almost perpendicular to each other, and could serve as the axes for the maps. At the stimulus level, the armchairs that were common to both maps are located in similar locations relative to the set of attribute vectors. As shown in Figure 13, the armchair that was found to project the most simple and contemporary image on the left map (of 20 stimuli) was also located near the end of the vectors for “Simple” and “Contemporary” on the right map (of 100 stimuli).
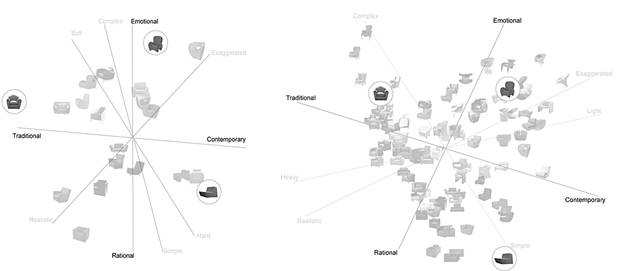
Figure 13. Perceptual map constructed in a previous study (left, adapted and redrawn from Cheng, 2003, p.62) and in this study (right).
Comparing the 3,000 items of raw rating data (consisting of 100 stimuli, 2 scales, and 30 participants) collected with the hierarchical sorting method to those of the divide-and-conquer method (conducted in the main test) for the same two scales, the results showed that the correlation was significant at the 0.01 level (2-tailed). In summarizing the analysis, the test results indicate that the hierarchical sorting and the divide-and-conquer methods are able to obtain quite consistent rating results.
Efficiency
We first analyzed the time required for the initialization process necessary for the divide-and-conquer method. The total amount of time for this process was 262.36 minutes for the six participants and the five bipolar adjective scales. To calculate the average time required for the divide-and-conquer method, this total amount of time for initialization was amortized over the number of participants in the main experiment. The result (8.75 minutes for five scales) is denoted as Ti in the following discussion. For the main experiment, the time usage data were automatically recorded and coded with respect to the three steps in the rating processes: the time used by a participant to divide the stimuli into subgroups (Td, only for the hierarchical sorting method), the time used by a participant to rate the stimuli at the conquer step (Tc), and the time used to confirm the overall results in the final confirmation step (Tfc). In addition, the time a participant used to complete the entire experiment, including Ti for the divide-and-conquer method, is denoted as Ttotal.
On the average, it took a participant 48.22 minutes to rate 100 stimuli according to five bipolar adjective scales by using the divide-and-conquer method. The amortized initialization time (Ti) for each participant was 8.75 minutes. The average time to complete the rating tasks for each scale was thus 11.39 minutes (= (48.22 + 8.75)/5). Of the 11.39 minutes, a participant used 8.74 minutes for rating the stimuli by groups (Tc) and 1.33 minutes for reviewing the combined overall results in the final confirmation stage (Tfc). It was also found that when the participant did the same rating tasks in the retest, it took less time to complete the entire rating tasks for the five scales (Ttotal, mean of 9.82 minutes for each scale), possibly due to a learning effect.
When using the hierarchical sorting method, it took a participant 18.30 minutes to complete the rating tasks for each scale, on the average. The additional time was spent mainly on dividing the entire set of stimuli into three subgroups (Td, mean of 5.12 minutes). Meanwhile, the time that a participant used to rate the stimuli within a group (Tc, mean of 12.47 minutes) was also longer than that of the divide-and-conquer method. A comparison of the average time a participant used in rating 100 stimuli on each of the two scales in the three trials is given in Table 4.
Table 4. Comparison of the average time per participant per scale for the three trials
Before comparing the efficiency between the two methods with the paired-samples t test, the 10 sets of time data (Tc, Tfc, and Ttotal of the three trials and Td of the hierarchical sorting method) were analyzed using the Shapiro-Wilk test for normality at the 0.05 level. The results showed that several sets of the data were not normally distributed (p<0.05), except for Td, Tc and Ttotal for the hierarchical sorting method. To fulfill the assumption of normal distribution required for conducting the t test, the raw data X was transformed by  (Johnson & Wichern, 2002, chap. 4) to pass the normality test (p>0.05) and analyzed with the paired-samples t test at the 0.05 level. The result of Ttotal showed that the divide-and-conquer method was significantly faster than the hierarchical sorting method (df=29, p<0.01, t=-10.75 for the test, t=-15.84 for the retest). Meanwhile, the amount of time that a participant spent at the conquer step using the hierarchical sorting method (Tc, mean of 12.47 minutes) was significantly longer than that using the divide-and-conquer method (df=29, p<0.01, t=-6.70 for the test, t=-11.86 for the retest). According to the participants’ comments, this was because the stimuli within each of the manually divided groups were more similar to each other than those in the groups randomly divided by computer when using the divide-and-conquer method. It required more time and effort from a participant to evaluate the details among the similar stimuli.
Reliability of the Divide-and-Conquer Method
The reliability of the divide-and-conquer method was calculated as the degree to which the same scores could be reproduced when the same stimuli were measured repeatedly by the same participant (Osgood et. al., 1957, p.126-132). Two methods of comparison with the 15,000 pairs of raw rating data (consisting of 100 stimuli, 5 scales, and 30 participants) were employed.
First, the absolute deviation between the values given by each participant for the same stimulus in the main test and the follow-up retest were calculated. It was found that 55% of the test-retest comparison data showed deviations of smaller than 1 unit (out of 9 units) and that 93% of the data showed deviations of smaller than 3 units. Second, using Pearson’s correlation to compute the degree of linear relationship between the pairs of data, the results showed that the test-retest correlation was significant at the 0.01 level (2-tailed). The average correlation was 0.72 (SD=0.1). Compared to the results of our previous study on evaluating alternative computer-based rating methods (Chuang et al., 2008), in which only 21 stimuli were used and the average test-retest correlation for the methods was between 0.76 and 0.82, the divide-and-conquer method proposed in this research appeared to have achieved a comparable level of reliability for a much larger set of stimuli.
Correlation Between the Results of the Divide-and-Conquer Method and the Hierarchical Sorting Method
The techniques used for analyzing the test-retest reliability were also applied to compare the 6,000 pairs of raw rating data (consisting of 100 stimuli, 2 scales, and 30 participants) collected with the divide-and-conquer method (in the main test) and the hierarchical sorting method. First, 48% of the comparison data showed absolute deviations smaller than 1 unit (out of 9 units), and 91% of the data showed deviations smaller than 3 units. Second, by using Pearson’s correlation to compute the degree of linear relationship between the pairs of data, the results showed that the correlation was significant at the 0.01 level (2-tailed). The average correlation was 0.73 (SD=0.1), the same as the test-retest reliability of the divide-and-conquer method. This comparison indicates that the divide-and-conquer method was able to obtain data similar to those obtained by using the hierarchical sorting method, commonly employed in traditional pencil-and-paper surveys.
Subjective Feelings
After completing the rating task, each participant was asked to rate the rating method based on his/her subjective feelings with respect to (a) degree of simplicity, (b) degree of fatigue, (c) likelihood of expressing actual opinions, and (d) overall satisfaction. Differences between the two methods were analyzed using a pair-samples t test for each of these four aspects separately. Using a 0.05 significance level, the results indicated that there were significant differences found in the results of (b) fatigue and (c) expressing actual opinions. The participants felt the greatest degree of fatigue (mean of 41.60, t= 3.35, df=29, p<0.01) the first time they experienced rating the 100 stimuli with the divide-and-conquer method, but the average of the fatigue rating values was below the neutral (50/100) level. In the follow-up retest using the same divide-and-conquer method, the average level of fatigue was reduced to 30.40. The participants felt the least degree of fatigue (mean of 25.63) when rating with the hierarchical sorting approach. Although significant differences were found among these three trials, the differences in the degrees of fatigue could also be due to the sequence of the experiment and the fact that only two scales were employed in the final hierarchical sorting experiment (because of time constraints).
On the other hand, the hierarchical sorting method was considered to have a higher likelihood of expressing the actual opinions of the participants (mean of 82.70, t=3.11, df=29, p=0.04) than the divide-and-conquer method (mean of 75.23 for the test, mean of 77.20 for the retest). Seven of the 30 participants commented that the manual dividing process helped them to pre-rate the large set of stimuli, and allowed them to focus on details when rating stimuli within each group during the conquer stage.
In addition, both the divide-and-conquer method and the hierarchical sorting method were felt to achieve a high degree (means of around 80 out of 100) of simplicity and overall satisfaction.
Conclusion
In this study, the authors developed two methods, the hierarchical sorting method and the divide-and-conquer method, for rating a large number of visual stimuli with respect to multiple scales. We then conducted experiments to evaluate the performance and reliability of the proposed rating methods. Using 100 armchairs as visual stimuli and five attribute scales for evaluation, it took a participant only 48.22 minutes to complete the experiment using the divide-and-conquer method. When using the hierarchical sorting method, the experiment could be completed in less than 90 minutes. Based on the time data reported in Andreassen and Fletcher’s study (2007, p.8-6), it is estimated that 225 minutes (45 minutes for each of the five attributes) would have been needed for manually conducting a card sorting with 100 stimuli and five scales. Thus, both methods developed in this research are much more efficient for obtaining attribute rating data with a large set of stimuli than the manual card-sorting method.
The attribute data collected by the two methods were found to be quite consistent, with an average correlation of 0.73. Both methods received high scores in subjective evaluations by participants with regard to the degree of simplicity and overall satisfaction. While the divide-and-conquer method was found to be more efficient, the hierarchical sorting method was considered to have a higher likelihood of expressing the actual opinions of the participants, because a participant was able to focus on the details of the stimuli after they had been grouped by similarity at the initial stage.
Based on these results, the main strength of the divide-and-conquer method appears to be its efficiency, due to the fact that a participant does not need to do the very time-consuming task of browsing through the entire set of stimuli at the beginning, and possibly also due to the fact that the stimuli in a group are diverse, making it easier to rate the items within the group. In contrast, the main strength of the hierarchical sorting method is its apparent accuracy: Participants considered it more likely that the ratings of this method reflected their actual opinions, because they were able to focus on comparing and distinguishing differences among similar stimuli. However, as the stimuli are more similar in this case, the participant might need to spend more time to evaluate them.
A researcher therefore can choose which trade-off to make in selecting a method for rating stimuli. If the objective is to observe the overall structure of a perceptual map containing many stimuli, a situation in which efficiency might be important and clear distinctions of subtle differences among similar stimuli might be less critical, a researcher could choose the divide-and-conquer method. In contrast, if the objective is to investigate in detail the visual differences among similar stimuli, a researcher might choose the hierarchical sorting method.
Acknowledgments
We sincerely thank the reviewers of this paper for their insightful comments. We would also like to thank the participants who helped to evaluate the rating methods. This research was supported by Taiwan’s National Science Council under Grant NSC- 94-2411-H-011-004.
Appendix
The rating methods described in this article are part of the survey tools implemented in the CAKE (Computer Aided Kansei Engineering) system, which was developed by the authors. As an appendix to this paper, we are making the CAKE system available online at http://www.ijdesign.org/software/CAKE/. Researchers are welcome to download the CAKE system for designing and conducting quantitative surveys.
References
- Aho, A. V., Ullman, J. D., & Hopcroft, J. E. (1983). Data structures and algorithms. Boston: Addison-Wesley.
- Andreassen, C., & Fletcher, P. (2007). Early childhood longitudinal study, birth cohort (ECLS–B): Psychometric report for the 2-year data collection. Washington, DC: National Center for Education Statistics. Retrieved September 15, 2007, from http://nces.ed.gov/pubsearch/pubsinfo.asp?pubid=2007084
- Bashour, M. (2006). An objective system for measuring facial attractiveness. Plastic and Reconstructive Surgery, 118(3), 757-774.
- Böckenholt, U. (2004). Comparative judgments as an alternative to ratings: Identifying the scale origin. Psychological Methods, 9(4), 453-465.
- Chang, W. C., & Wu, T. Y. (2007). Exploring types and characteristics of product forms. International Journal of Design, 1(1), 3-14.
- Chang, Y. -M., & Chen, H. -Y. (2007). A neural network-based computer aided design tool for automotive form design. International Journal of Vehicle Design, 43(1-4), 136-150
- Cheng, H. D. (2003). Application of morphing in multidimensional perceptual space: Using chairs as examples (in Chinese). Unpublished master’s thesis, National Taiwan University of Science and Technology, Taipei, Taiwan.
- Chuang, M. C., & Ma, Y. C. (2001). Expressing the expected product images in product design of micro-electronic products. International Journal of Industrial Ergonomics, 27(4), 233-245.
- Chuang, Y., Chen, L. L., & Chuang, M. C. (2008). Computer-based rating method for evaluating multiple visual stimuli on multiple scales. Computer in Human Behavior, 24(5), 1929-1946.
- Cormen, T. H., Leiserson, C. E., & Rivest, R. L. (1990). Introduction to algorithms. Boston: MIT Press.
- Desmet, P. M. A., & Hekkert, P. (2007). Framework of product experience. International Journal of Design, 1(1), 57-66.
- Grimsæth, K. (2005). Kansei engineering: Linking emotions and product features. Retrieved April 31, 2007, from design.ntnu.no/forskning/artikler/2005/artikkel_Kansei_Engineering_K_Grimsath.pdf
- Heise, D. R. (2001). Project Magellan: Collecting cross-cultural affective meanings via the Internet. Electronic Journal of Sociology, 5(3). Retrieved July 31, 2005, from http://www.sociology.org/content/vol005.003/mag.html.
- Hsiao, K. A., & Chen, L. L. (2006). Fundamental dimensions of affective responses to product shapes. International Journal of Industrial Ergonomics, 36(6), 553-564.
- Hsu, S. H., Chuang, M. C., & Chang, C. C. (2000). A semantic differential study of designers’ and users’ product form perception. International Journal of Industrial Ergonomics, 25(4), 375-391.
- Hughes, G. D. (1969). Some confounding effects of forced choice scales. Journal of Marketing Research, 6(2), 223-226.
- Johnson, R. A., & Wichern, D. W. (2002) Transformations to near normality. In Applied multivariate statistical analysis (5th ed., pp.194-202). Upper Saddle River, NJ: Prentice Hall.
- Jordan, P. W. (2000). Designing pleasurable products: An introduction to the new human factors. London: Taylor & Francis.
- Kim, J., Lee, J., & Choi, D. (2003). Designing emotionally evocative homepages: An empirical study of the quantitative relations between design factors and emotional dimensions. International Journal of Human Computer Studies, 59(6), 899-940.
- Lai, H. -H., Chang, Y. -M., & Chang, H. -C. (2005). A robust design approach for enhancing the feeling quality of a product: A car profile case study. International Journal of Industrial Ergonomics, 35(5), 445-460.
- Lai, H. -H., Lin, Y. C., Yeh, C. H., & Wei, C. H. (2006), User-oriented design for the optimal combination on product design. International Journal of Production Economics, 100(2), 253-267.
- Llinares, C., & Page, A. (2007). Application of product differential semantics to quantify purchaser perceptions in housing assessment. Building and Environment, 42(7), 2488-2497.
- Moore, W. L., & Pessemier, E. A. (1993). Product planning and management: Designing and delivering value. New York: McGraw-Hill.
- Nagamachi, M. (2002). Kansei engineering as a powerful consumer-oriented technology for product development. Applied Ergonomics, 33(3), 289-294.
- Norman, D. A. (1990). The design of everyday things. New York: Doubleday.
- Norman, D. A. (2004). Emotional design. New York: Basic Books.
- Osgood, C. E., Suci, G. J., & Tannenbaum, P. H. (1957). The measurement of meaning. Urbana: University of Illinois Press.
- Pao&Paws (2005). Milian design views. Taipei: PPBook.
- Peterson, R. A. (2000). Creating effective questionnaires. Thousand Oaks, CA: Sage.
- Rao, R.V., & Katz, R. (1971). Alternative multidimensional scaling methods for large stimulus sets. Journal of Marketing Research, 8(4), 488-494.
- Schütte, S., & Eklund, J. (2005). Design of rocker switches for work-vehicles: An application of Kansei Engineering. Applied Ergonomics, 36(5), 557-567.
- Urban, G. L., & Hauser, J. R. (1993) Design and marketing of new products (2nd ed,). Englewood Cliffs, NJ: Prentice-Hall.
