
Materials in Products Selection:
Tools for Including User-Interaction in Materials Selection
Faculty of Industrial Design Engineering, Delft University of Technology, Delft, The Netherlands
Products do not only discriminate from other products in functionality, but also in the way they please users. The sensorial properties of materials influence whether a product provides adequate feedback or gives a pleasant emotional experience. Designing a specific user-interaction involves selecting appropriate materials that create that interaction. However, defining which material properties contribute to the desired interaction is difficult as these are often subjective. Clients are not always able to clearly specify what desired user-interaction they want to create with the product. As a result, product designers often start a search based on unclear criteria.
The recently developed Materials in Products Selection (MiPS) tools help product designers together with clients in defining the sensorial properties of materials required to create a desired user-interaction with the product. The tools define the user-interaction via several means, namely pictures of product examples and their materials, actual materials samples, and the sensorial aspects of materials during several phases of the user-product interaction. This paper presents an evaluation of the tools with professionals and students. The results show that these tools lead to high consensus between product designers and clients during discussions and a better definition of the required materials properties.
Keywords - User-product Interaction, Client-Product Designer Relation, Materials Selection Tools, Evaluation of Tools.
Relevance to Design Practice – The materials selection tools offer a practical instrument for the discussions product designers have with their clients about the desired user-interaction aspects of a product and the materials from which it is made.
Citation: van Kesteren, I. E. H., Stappers, P. J., & de Bruijn, J. C. M. (2007). Materials in product selection: Tools for including user-interaction aspects in materials selection. International Journal of Design, 1(3), 41-55.
Received April 23, 2007; Accepted October 17, 2007; Published December 1, 2007
Copyright: © 2007 van Kesteren, Stappers and de Bruijn. Copyright for this article is retained by the authors, with first publication rights granted to the International Journal of Design. All journal content, except where otherwise noted, is licensed under a Creative Commons Attribution-NonCommercial-NoDerivs 2.5 License. By virtue of their appearance in this open access journal, articles are free to use, with proper attribution, in educational and other non-commercial settings.
*Corresponding Author: IlsevanKesteren@gmail.com
Introduction
Products do not only differentiate themselves from other products in functionality, but also in the way that they please users (Jordan, 2000). Users nowadays expect a product to function properly (Roozenburg & Eekels, 1995), to be easy to use, and to touch them emotionally in some way (Desmet, 2002). The moment that products satisfy the consumer on issues like utility, safety, and comfort; the emphasis of the consumer will shift towards appearance, emotional attributes, and symbols (Crilly, Moultrie, & Clarkson, 2004). Manufacturers that develop products with these expectations have grown significantly, especially in the consumers market. They have started to realize that they need ways to get into the hearts and minds of their customers to stay in business (Sanders, 2001).
Materials selection plays an essential role in the product design process (Doordan, 2003). Product materials determine the range of function, durability, certain costs, user feedback, and user experience. When users interact with products, their senses are in contact with the materials of those products. Users see the colours of materials, feel the texture and weight, and hear the sounds that the materials make when the object is moved. These sensory perceptions contribute to product usability and use experiences (Hekkert, 2006). Product designers use materials to create these sensory perceptions (Ashby & Johnson, 2002, 2003). In addition, product designers select materials for products to elicit the right associations. For example, the metals that are used in a Rolex watch project social status (Jordan, 2000). Hodgson and Harper (2004) stated that materials considerations are pervasive in design as the substance through which product designers' intentions are embodied. Likewise, Gant (2005) emphasized that the strategic use of materials is one of the most influential ways through which product designers engender deeper, more emotive connections between their products and their users. The materials that a product is made of thus influence how users interact with the product.
The different aspects of materials can be for the most part categorized in two groups, namely the technical aspects and the user-interaction aspects. The technical aspects of materials define how the product will be manufactured and how it will function. The user-interaction aspects are those that influence the usability and personality of a product. For example, shininess can influence how well users can read from a display (use aspects) and colours are a very strong aspect to create a personality that influences user experience. For high quality products, product designers should select materials that are optimal or compromise in both aspects.
A problem that product designers encounter in materials selection is that their clients are often unable to clearly specify what user-interaction aspects of materials they desire in a new product (van Kesteren, Stappers, & de Bruijn, 2006). Consequently, product designers start a materials search based on criteria that can be interpreted in different ways. Product designers use their experiences to select candidate materials, which they then discuss with the clients. They point out that during these discussions, it is clear that the clients desire aesthetics and perceptions other than initially stated. It is undesirable for the product designers to be on the wrong track too long or for them to have to start from the beginning with a new materials search. This leads to unnecessary delays in the materials selection process. Our aim is to find ways to minimize these unnecessary delays.
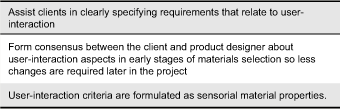
We developed the Materials in Products Selection (MiPS) tools, which are new tools for incorporating user-interaction aspects into the materials selection process (van Kesteren, Stappers, & de Bruijn, 2007). The tools' main purpose is to increase understanding and form consensus between clients and product designers about the desired user-interaction aspects of the materials used in a new product. The tools can be used in design brief meetings in which clients explain the objectives and constraints for a new product. The expected benefits of the tools are summarized in Table 1.
Table 1. Summary of the expected benefits of the tools
MiPS aims at defining a material profile for a new product in terms of sensorial properties (Table 2 and 3). These properties can be translated later into technical properties and are expected to be concrete enough so that both the client and designer have the same expectations. Descriptions of perception and use are still multi-interpretable and therefore less useful for this purpose. Technical properties can come forward in discussions about user-interaction aspects, but it is not necessary. Preferably the tools do not direct to material names yet. Although defining materials reduces the number of possible material candidates, it can also lead to problems; e.g., when the materials cannot fulfil project objectives on other aspects aside from user-interaction. Furthermore, new materials are easily excluded when materials are defined at the beginning of a project.
In the next section, we present the three MiPS tools. Thereafter, we study the tools in a fictive design brief meeting, as shown in the 'usability study,' 'results,' and 'discussion' sections. Furthermore, based on the results of the study, we present a revised version of the tools at the end of the paper.
Table 2. Categories of properties that can be used to describe a material profile
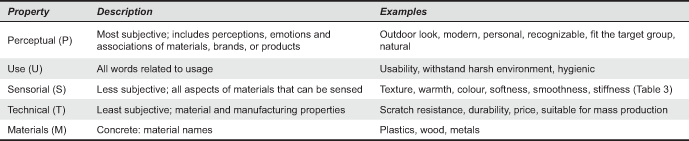
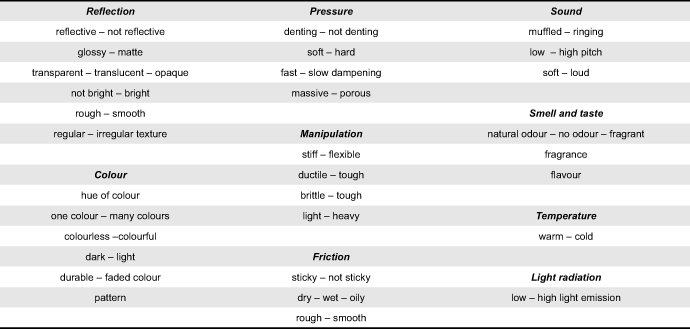
Table 3. List of sensorial properties
Materials in Products Selection: Three Tools
MiPS consists of three different tools for design brief meetings between product designers and clients. The tools define user-interaction through several means- pictures of product examples and their materials (picture tool), actual materials samples (sample tool), and the sensorial aspects of materials during several phases of the user-product interaction (question tool).
Picture Tool
Example products are an important frame of reference in the early phases of product development (Pasman & Stappers, 2001). When a product designer wants to create a certain personality, he can use existing products and the materials from which these products are made as examples. Together with a client he can select those aspects of the example products of which they think create the desired personality. The background idea of the tool is to offer product designers a set of product images for defining the sensorial properties that create a specific product personality. We expect that clients in particular can better point out what they want from example products than in terms of material characteristics.
Govers (2004) developed a product personality scale in which product personality refers to the character of a product. This scale consists of 20 personality terms that are visualized with pictures. These pictures show situations and objects, not necessarily products. For the picture tool, a similar set of images was made, but of existing products. To create uniformity in product examples, a product category was chosen, namely consumer electronics, in which most products can be characterized. Numerous pictures of products were selected from various internet stores and were categorized under 20 personality terms. During the categorization, we found the term 'pretty' to be more subjective than the other terms. It more closely relates to the product itself rather than the materials. The same holds for the term 'idiosyncratic.' We omitted both terms in the final set. The terms 'serious' and 'boring' appeared to have the same products associated with them. The materials aspects of these products were similar. We decided to replace these two terms with the term 'business like.' Also the terms 'provocative' and 'lively' were combined into the term 'lively.'
After selecting appropriate product examples, the picture cards were composed. The picture tool consists of a set of 16 cards with each representing a different personality. On the front of the card are product examples that help the visualization of personality. The back of the card helps to translate the product characteristics into sensorial properties (Figure 1). It shows details of the materials and some keywords. These cards can be used in two steps. While defining a design brief, clients can show which personality cards are representative of their desired product personality (using the front). Next, product designers can discuss the sensorial properties related to the selected personalities with the client using the back. An example of a question that the product designer may ask the client is "These products are semi-transparent, is that also what you had in mind?" The product designer can then begin a materials search based on these material properties.
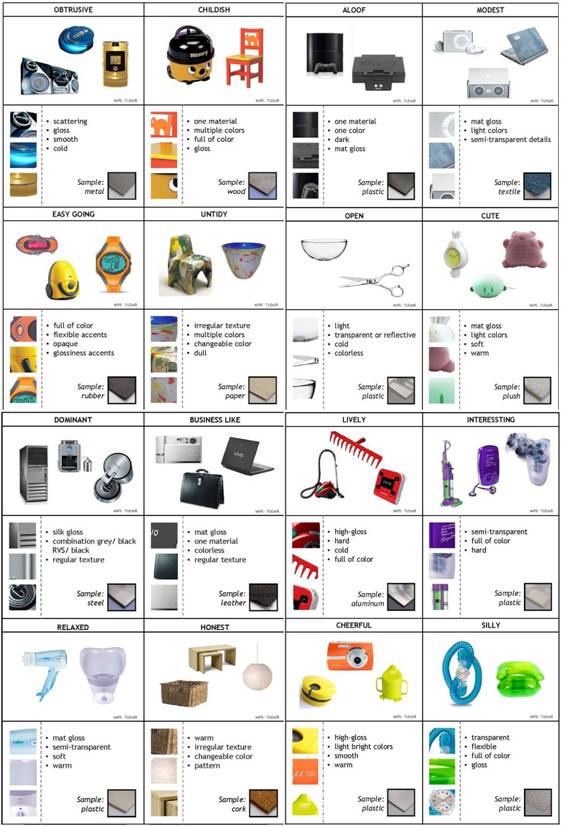
Figure 1. Picture tool.
The picture cards will vary somewhat depending on culture, trends, and time. The product examples used in the cards for this study are products that are available in the Netherlands and placed on the cards by Dutch design students. The connection between the personality term and the product examples are made within their context and might be different in another context. These connections, however, do not determine the outcome of the discussions, but rather inspire discussions. In other words, if a client wants to create a 'lively' product, it may not necessarily be similar to the products presented on the 'lively' card. It is the combination of cards and the aspects that come up in the discussion that are directing the materials choices for the product. Hence, disagreement between the tool user and the creator can be inspiring. Furthermore, the discussions should not focus on the products themselves but on the material properties that these products represent. However, we do acknowledge that in due time, example products might need to be replaced or that in other cultures other example products will be more suitable.
Sample Tool
Material samples are widely used in materials selection (van Kesteren, 2008). They are used as a communication tool for comparing and testing candidate materials. Material samples from suppliers show, for example, different colours or different transparencies of their material portfolios. The idea is to use samples in the defining phase of materials selection, thus to formulate a material profile. The existing sample sets from suppliers are too detailed to use for this purpose: they only vary on some material aspects. A set of samples that represents a wide range of sensorial properties can support the defining phase. These samples help the discussions on which materials best fit the desired user-interaction aspects. In particular, tactile aspects are most suitable for discussions with physical samples.
The number of samples is limited to the practical issues of storage, bringing it to client meetings, and using it in discussions. We aimed at selecting a maximum of 15 samples that represent a combination of sensorial properties. To create uniformity, we decided to eliminate colour except for the natural materials colour and use similarly shaped samples.
A matrix with sensorial properties was made to create the set. For each property, the variations were put into a matrix. For example, the sensorial property 'transparency' has the variations of transparent, semi-transparent, and opaque; and the sensorial property 'gloss' has the variations of high gloss, satin gloss, and matte. For each variation, a material sample was selected from different material databases (www.materialexplorer.com, private collections, and collections from the faculty of Industrial Design Engineering). The samples selected in this step represented one variation of a sensorial property. The number of samples was then reduced to 11 of which have wide variations of sensorial properties (Figure 2). During a design brief meeting, the product designer and client can select a combination of samples that have the desired sensorial effect that creates a personality for the new product. The sensorial properties of the samples form the starting point for the materials searches.
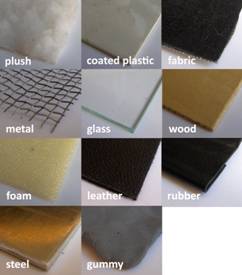
Figure 2. Sample tool.
Question Tool
In design brief meetings, topics are discussed that are important in the project. The product designers often have a list of questions that are relevant for every project, such as those that related to costs, available manufacturing facilities, and target group. These topics are formed by experience and sometimes written down in a checklist. The idea behind this tool is to use questions about the specific topic of how the user interacts with a product to identify the sensorial properties that form, emphasize, or weaken the interaction.
This tool initiates discussion topics that refer to aspects of interaction. To create the tool, first topics of interaction were defined and discussed with two experts (G. D. S. Ludden, personal communication, October 9, 2006; M. H. Sonneveld, personal communication, November 7, 2006). The topics were product experiences (being the emotional, associative, and perception responses to the product), the functional use, and the distinctiveness of a product compared to other products. A set of questions was composed for each topic. Second, a structure was created to organize the questions. Requirements for this structure were that it should be easy to remember and follow a natural conversational style rather than being a questionnaire for the client.
A familiar way of organizing product requirements is via a process tree or life cycle analysis (Roozenburg & Eekels, 1995). In a process tree, all phases of a product life cycle come forward, from design to disposal. It forces product designers to consider the consequences of their design for every phase. One of the phases is the 'use' phase, which is the one that we based the organization of the questions.
The tool is composed of a list of questions and a checklist of sensorial properties. The list of questions is organized according to different phases in the user-product interaction: 1) first contact, 2) try out, 3) transport, 4) unwrapping, 5) usage, and 6) rest phase (Table 4). The product designer and the client imagine and discuss the interaction that the user will have with a new product in a specific phase. For each phase, the discussion should end with the question: "What sensory aspects play a role in this?" The answers to this question provide the sensorial properties of a product desired in the phase in question. These are noted on the checklist, which can be filled out during discussion and can be used to summarize the material requirements for the materials search (Table 3).
Table 4. Questions tool (pictures were added in the revised form)

Usability Study
The design of the tools has reached the stage where it is now possible to study how the usability of the tools can be optimized. The aspects of the usability of interest are the performances of the tools, how easy they are to use, and how they influence the creativity of the users. To understand the tools' performance in design brief meetings, they were evaluated in a real life setting. The tools aim to achieve a high level of certainty to start an effective materials search, to have a high level of consensus between clients and product designers about the key sensorial properties that create the desired personality and to formulate a material profile in terms of sensorial properties.
We invited six professional product designers and six business clients to use the tools in design brief meetings for two fictive design assignments that we created. Furthermore, we invited twelve students who either did or did not study at a product design education to do the same. The last group acted as clients. Therefore, no only can the performance of the tools be compared, but also the influence of the participants' experiences on the usability and performance of the tools could be assessed. The questions that were studied are as follows:
Question 1: How do the tools perform in the design briefs and how do they differ?
- Does using tools increase the certainty of clients and product designers about whether or not the product designer can start an effective materials search?
- Do the tools lead to consensus about the sensorial properties that are important in the materials searches?
- Do the tools direct to sensorial properties of materials?
Question 2: How easy to use are the tools for clients and product designers?
Question 3: How do the tools influence the creativity of the product designers?
Procedure
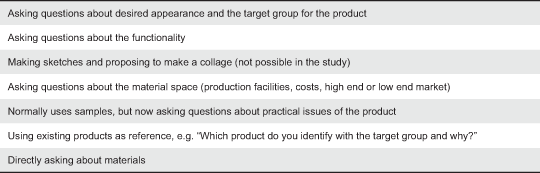
The participants of the study used all three tools so as to be able to compare them. Furthermore, they used no specific tool to compare their own approaches ('own method') with the created tools. With their own method, the product designers followed different approaches as summarized in Table 5.
The participants discussed two design assignments in product designer/client pairs in a session. For each assignment, two tools were used for ten to fifteen minutes. The entire session took 2 hours. The participating product designers received instructions for the two tools they would use during the first assignment. Before starting the second assignment, they received instructions for the other two tools. After the two assignment discussions, the participants were asked to fill out a questionnaire (see Questionnaires section).
Table 5. Examples of own approaches ('own method') in a design brief meeting
Design Assignments
The first assignment focused on the industrial design and product personality of a cutlery set with an outdoor look for daily use. A fictive manufacturer of outdoor products wanted to increase brand recognition by designing a new product that is not only used for outdoor activities but also in everyday life. The second assignment was a more complex product than the first one, namely a new concept for a camera based on new technologies. The concept was termed 'Polaroid video' and elaborates on the old Polaroid camera concept, but with moving pictures. The assignment was to design the housing for the product, which produces the Polaroid video pictures. The participating clients were provided with instructions about the assignments. Herein, a fictive company profile, the problem definition, and the task for the designer were given.
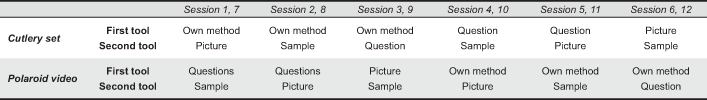
Order of the Applied Tools
The order of the tools varied to assess the influences of the different tools on each other and the usability of the tools for each assignment. The baseline condition 'own method' always preceded all other tools, so as not to bias the participants. Because we expected similar biases to operate between our new tools, we chose to let the question tool precede the other two, and have the sample tool last (Table 6). Every sequence of tools is used twice, once with a professional pair and once with a student pair.
Table 6. Order of applied tools per session
Profiles
Consensus between clients and product designers regarding materials profile was measured at three different points, namely before, in between, and after the use of each tool. We surveyed the participants' ideas about the desired materials for the new product at these points. We could then compare the client's and product designer's ideas. Two questions were asked per profile. First, the participants were asked to indicate their certainty about the product designer's ability to start an effective materials search at that point. Second, the participants were asked to describe the desired material features for the new product. After filling out the three profiles, the participants filled out an extra profile. On this profile, they were asked to pick a maximum of five sensorial properties on which they think are important to base the materials search (see the list of properties in Table 3).
Questionnaires
After the two design brief discussions, the participants were asked to fill out a questionnaire. The aim of this questionnaire was to evaluate the different tools on usability and creativity topics. Questions about usability were as follows: "What are the benefits of using the tools?" and "Would you suggest using only one tool or a combination of tools?" The participants were furthermore asked to react on three propositions per tool by filling in their answer on a 5-points Likert scale (Likert, 1932). These were as follows: 1) "What is the efficiency of the tool during the design brief?"; 2) "I believe the client/product designer comprehended what I mean ….." (better to worse), and 3) "How much effort did it take to become familiar with the tool?" The usability part of the questionnaire was concluded by asking the participant to rank the tools in order of usability.
Questions about creativity included the following: "How inspiring were the tools for you?", "How directing were the tools, and how was you did experience this?" and "How did the tools support your creativity?" For the creativity part also three propositions could be filled out per tool on a five points scale: 1) "I obtained more inspiration by using the tools", 2) "The tool narrowed my creativity" and 3) "The tool was very directing".
The questionnaire ended with questions about points for improvements for the tools. These were: "Would you like to use one of the tools yourself?"; "Did you miss anything in the tools?" and "Do you have suggestions for improving the tools?"
Results
Question 1: Performance of the Tools
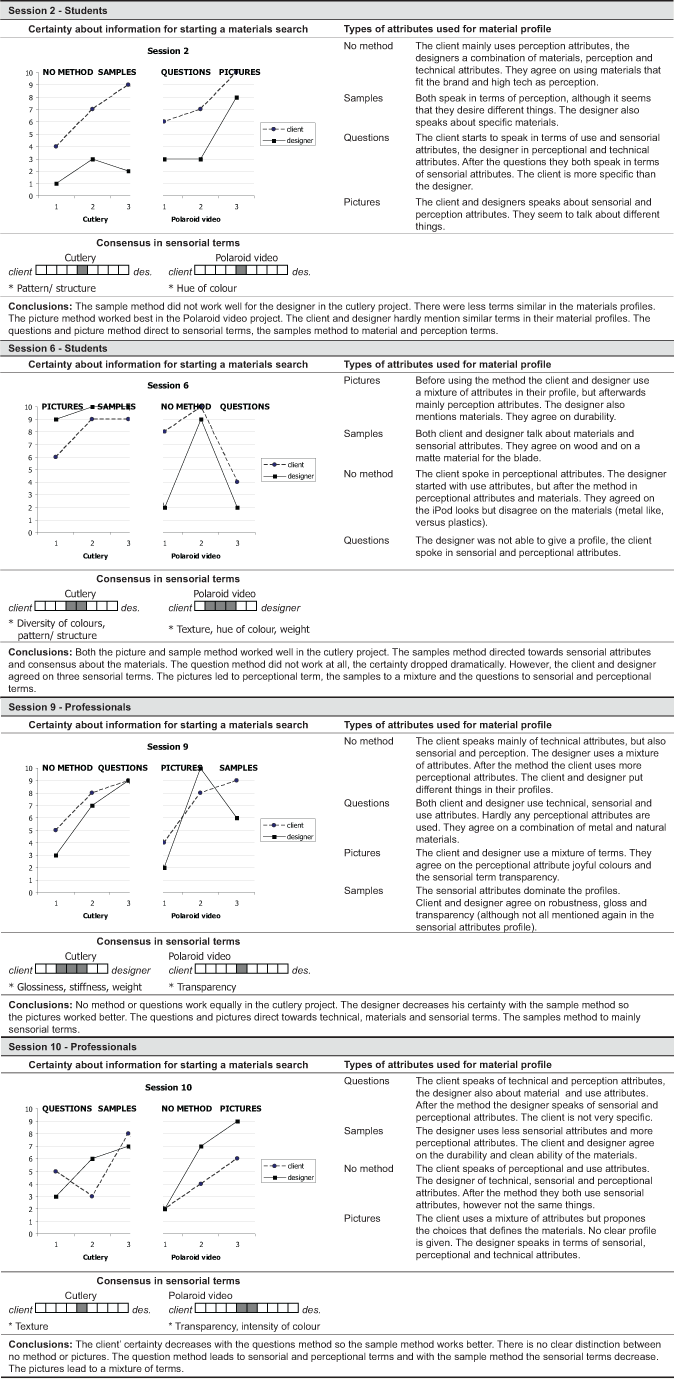
The profiles made before and after the own method or the tool was used were summarized per session. Four sample summaries are provided in Table 7, two from professionals and two from the students.
Note that in the study presented here, the participants used the tools without any preparation. In practice, a new assignment is often known before the first meeting between the product designer and client. Product designers can then prepare how they will use the tools before the design brief meeting, which might make them work better.
Table 7. Sample profile summaries that were filled out for four of the 12 sessions
Increase of Certainty
The certainty of being able to start an effective materials search, indicated on the profiles that were filled out by a participant before and after using a tool, were compared. Three situations could occur, namely an increase of certainty, a decrease of certainty, or neither (same certainty). Table 8 shows that most participants increased their certainty after the discussions. When the product designers used their own method, they more often increased their certainty compared to when they used one of the offered tools. This was in a minimum of 67% of the cases (16 / 24 participants). The sample and question tools are least effective in increasing certainty.
Table 8. Number of sessions in which certainty was increased, decreased, or remained the same after using one of the tools
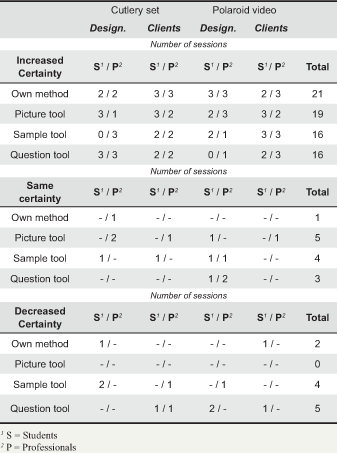
The picture tool never resulted in a decrease of certainty; however, this tool also scored the highest in keeping the same certainty. Professionals in particular indicated the same certainty after having used the tool. The sample and question tools led to a decrease in certainty more often than the other tools, especially for students.
Consensus on Sensorial Properties?
Although product designers and clients increased their certainty about an effective search, would they start a search with the same material properties? In general, we found limited agreement on sensorial properties between the profiles made by clients and product designers (Table 9). In all sessions and with both assignments, we found a minimum of 1 to a maximum of 3 similar terms out of the 5 selected. The terms that were agreed upon differed per session, indicating that in every session different materials profiles were made.
Table 9. Number of similar terms that were filled out in the sensorial properties profiles after using two tools
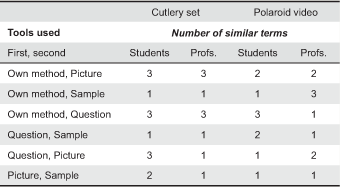
The picture and question tools led to the largest number of properties common to both clients and product designers. Almost every time that these tools were used after the 'own method,' the product designer and client agreed on 2 or more terms. In other combinations of tools, we saw agreement on 2 or 3 terms occasionally, but for most there was agreement with only one term.
We found some relation between the participants' certainty about being able to start an effective materials search and their low agreement on key sensorial properties for the search. The client and product designer agreed on only one term after 12 briefs. In 5 of these briefs, a decrease in certainty was found. This decrease in certainty occurred after using the sample tool (4 times) or after the question tool (1 time). When participants were uncertain after using the sample tool, it thus led to a low level of consensus. Uncertainty indicated after using the other tools did not automatically lead to a low level of consensus. The other tool used in the assignment seemed to improve the level of consensus that was reached after using the first tool. The picture tool was used as the second tool in most of these cases, but we also found an example with the sample and question tool as the second tool. These examples suggest that using a combination of tools can help to reach consensus between the client and product designer. If after using the question tool, for example, there is still uncertainty about how to start a materials search, another tool can be used to reduce uncertainty and to increase consensus between the client and product designer.
Directing to Sensorial Properties?
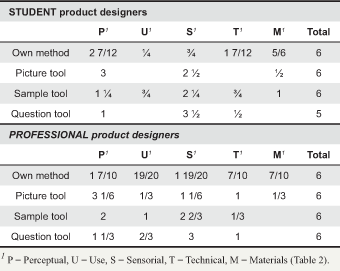
The material terms used in the profiles that the participants made before and after using a tool were grouped into different property categories (Table 2). We looked at which categories were found in the profiles made after using each tool. If one category was mainly found, we added a "1" in Table 10. If more than one category was found, we divided "1" with the number of categories and gave each category a fraction of 1. We focused on the categories used by the designers, because they need these terms for the materials searches. Finding the sensorial category was expected, because this is the category for which the tools aimed. Finding the perceptual category is particularly unwanted, because the tools are designed to translate perceptions into sensorial properties.
Table 10 shows that the product designers used sensorial properties in their profiles after using all tools. The only exceptions are when they used their 'own method' and additionally when professional product designers used the picture tool. This was the case in about half of the profiles. The question tool directed to sensorial properties mostly. The picture and sample tools did stay on the perceptual level in one third to one half of the cases. These tools need to be improved to make them effective tools.
Table 10. Proportions of terms used in the profiles made by the product designers after using a tool.
One of the six students was not able to fill out a profile after the question tool.
The type of sensorial properties that were discussed differed from tool to tool. Transparency and colour aspects were mainly discussed with the picture tool; texture and pattern aspect with the sample tool; and sound, smell, and taste were only discussed with the question tool.
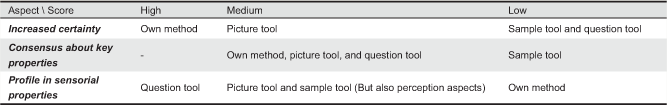
Summary
In Table 11, we summarize the results of the first research question. We found that the tools' performance differed depending on the aspects studied. None of the tools scored high on all aspects.
Table 11. Summary of tool performance
Question 2: Ease of Use
In general, we saw that the product designers were able to use the tools after reading the introduction. They customized the tools for their own approaches (Figure 3). For example, some product designers used the picture tool to make categories of wanted and unwanted personalities together with the client. Others made a selection before showing the cards. The sample tool lured participants to touch and explore the samples. Some pairs grouped the samples as well during the discussion. Although the question tool was understood, participants had more difficulty in using this tool directly. The topics of discussion often diverged from the written questions. Furthermore, only one of the twelve pairs was able to discuss all phases of the interaction in the time allotted. Some product designers advised to not apply the tool in the first design brief. They preferred to prepare themselves by adjusting the questions to a specific situation before asking the questions to a client.
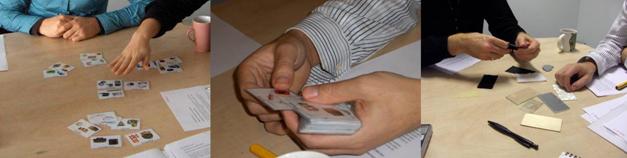
Figure 3. Examples of how the picture tool was used. Grouping pictures (left). Selecting cards (middle).
The sample tool lured participants to touch and explore the desired physical properties (right).
The participants mentioned different benefits of each tool. They remarked that the picture tool provides a perception of the personality that the new product should have. It gives an idea of the materials that can create the desired personality. The example products leave plenty of freedom for the product designers while helping the clients to define what they want. According to the participants, the sample tool was able to quickly bring up the tactile aspects of the materials. It was easier for them to judge whether the materials provided the right feeling with the sample tool than with the picture tool. However, the sample tool still required that the participants be able to visualize the materials on a product, which some found difficult. The question tool works as a checklist. The participants mentioned that the questions forced the client to think about all aspects of the interaction in a more detailed manner than without the tool. A drawback of the question tool was that in many cases it led to long discussions for determining the required user-product interaction, but did not result in defining sensorial aspects.
The usability of each tool was rated by the participants on a five point scale for three topics. The outstanding results are that the picture tool required the least amount of time to get familiar with and that the question tool took the longest in design brief meetings. All other questioned aspects are more dependent on the participants' preferences and judgements. The participants were lastly asked to rate the tools based on usability. Although the sample tool was rated as most usable in some cases, the picture tool was rated as most usable overall. The sample tool came in second place. The question tool was rated as least usable, even lower than the product designers' own methods. Except for the business clients who preferred the question tool over their product designers' own method, the different groups did not differ in their ratings.
All but one of the 24 participants preferred to work with a combination of tools. They argued that each tool focused on a different aspect of the new product. They suggest that the picture tool is better to use during design brief discussions, where as the sample and question tools are better at a later stage. The most preferred combination was the picture tool together with the sample tool, followed by a combination of all three.
Question 3: Creativity
The participants varied in their opinions about how inspiring the tools were. The picture tool was judged as very inspiring by the majority of the participants, because it led to new ideas quickly. Drawbacks of the picture tool were that it makes it hard to think 'out-of-the-box,' because it provides so many examples. The professional participants found the sample tool inspiring, although only on an unconscious level. The student participants, on the other hand, did not find the sample tool inspiring. Students found the samples difficult to visualize in the new product. Other students were afraid that the materials were settled after selecting the samples from the set, which was not the intention of the tool. The question tool was not found inspiring by most participants, although they found the tool clarifying. It helped the participants to approach the project from another angle. One participant mentioned that the question tool did not direct to materials, but instead to aesthetics and visual characteristics of materials, which is actually the purpose of the tool.
In general, the tools were judged as directing, especially the question tool. Professional product designers and business clients liked this directing as they argued that in a design brief meeting, there is no time for chitchats and the questions help to get to the point. The students, however, found it annoying that the tools directed them. They argued that all tools restrict creativity. Half of the student product designers even found this very annoying.
The participants were asked how the structuring characteristics of the tools influenced the ability to be creative. Although the tools influenced the creativity of the users, it is hard to say if the tools improved or restricted the creativity of a person. We found a lot of variation in the participants' judgements about this issue. In general we can conclude that the professionals' creativity was stimulated in their creativity while the students' creativity was restricted. The picture and sample tools scored better on this issue than the question tool.
Discussion of the Results
The evaluation of the tools showed that they generally do what they should do; however, the performance and usability of the tools can be improved based on the following recommendations.
Combination of Tools
The tools were evaluated individually to measure the performance and usability of each tool. We learnt that none of the tools scored high in all the desired performances (Table 11). Our advice is to use the tools in a combined form. With a combined form, we expect that product designers can reach a high level of consensus with their clients and also with a high level of certainty of being able to start an effective materials search.
Although the participants preferred to use a combined form with the picture and sample tools, we recommend starting with the question tool. The question tool was found to be more directing to the aim for sensorial properties than the other tools. Furthermore, it led to a high number of similar properties for which to start a materials search. The uncertainty caused by the question tool can be reduced by using the picture tool or sample tool to support the discussions for each user-interaction phase of the question tool. When the picture and sample tools focus on different sensorial properties, the tools can really complement each other (see the 'revised and combined tools' section).
The results showed a wide variety of opinions about usability and creativity of the tools. Not only did we find differences between professionals and students and between clients and product designers, we also found differences within the groups. Which means that one tool does not suit all. Although a combination of tools may meet the needs of more users, product designers should be able to select only one of the elements of the combined tools, e.g., only the pictures or the samples. In that situation, the tool is expected to be effective for different product designers working with different clients on different projects.
Translation or Converging Step
As the results show, not every tool directed to a material profile described as sensorial properties. Although the tools aim to translate perceptual terms into sensorial properties, they led to materials profiles described in perceptual terms. This is especially true for the picture and sample tools. We expect that although clients and product designers mention the same perceptual terms, they might translate the terms differently into materials characteristics, which is unwanted. The picture and sample tools thus seem thus to lack a clear translation step.
The question tool resulted in a materials profile in sensorial terms. With this tool, the translation step was indicated by the last question for each phase discussed, namely "Which sensorial aspects play a role in this?" Furthermore, a checklist of properties was provided to summarize the discussions. Although not every product designer used this checklist, it helped to direct the discussions to sensorial properties. A similar translation step can make the picture and sample tools more effective. It is thus recommended to emphasise on such a step in both tools.
Students versus Professionals
Students and professionals differ in their experience with the execution of materials searches for design projects and the background of these projects. The students in this study had had almost no experience with client projects and with design brief meetings. Despite these differences, we expected that the tools were usable for both professionals and students. However, the results show that the two groups reacted differently to the tools. Students found the tools more restricting to their creativity and had more trouble using them than professionals. Some students were very explicit in their disinterest in using the tools for future projects. An explanation might be that students have not come across the problems in materials searches that the tools try to reduce. They did not understand the effort needed to reduce these problems, and therefore were less willing to use the tools. Another explanation can be that students are explicitly exploring their creativity in the educational system, while professionals are using their creativity in a more applied manner. Whereas, the professionals seem to integrate the tools and their own approaches to enhance their creativity, the students seem to see the tools as a barrier to their own creativity.
Based on the differences between students and professionals, we recommend choosing one target group, which for our case will be the professional product designers, for further development of the tools.
Recommendations for Each Tool
Picture Tool
Although the backs of the cards did offer translations of the personalities and pictures shown, they did not lead to describing the materials profile in sensorial properties. More emphasize should be placed on this side by providing a checklist on which all the mentioned properties are presented, for example. The product designer could then use this checklist to summarize the results of the discussions. Some participants recommended using only product examples and no personality terms. However, we recommend using the terms, because they name the different cards, which eases up the discussion, even when clients and designers do not agree on the terms.
Sample Tool
The participants' evaluations of the sample tool differed more than any of the other tools. It appears that using material samples is more closely relate to personal approaches than the other tools. In any case, the sample tool can be optimized by taking the following suggestions. The samples help to determine the kind of material properties that are desired for the new product and this aspect should be emphasized, for example, by providing a list of sensorial terms that are present in the samples.
The materials that are now included in the set are not judged as very inspiring by the participants, and in their opinion, some samples were missing. We suggest to select a new set of samples with the same background ideas, namely to represent a wide range of sensorial properties, but to find more extreme samples. The material characteristics that the participants suggested adding are transparency differences, more plastics, soft materials, stones or ceramics, metals, fibres, and gels.
Question Tool
Many participants rated the question tool as less usable in its current form. However, the question tool was the most directing to sensorial properties, as compared to the other tools. For this reason, we do not recommend abandoning the tool.
The questions were all given as one list, but could be more effective if they were separated on different cards by phase. The order of the phases can then be changed. Although it is still important to discuss all relevant phases, the discussions can follow a more natural sequence than with a pre-defined order of questions. The next suggestion is to add pictures of situations to the question cards. It is then easier to imagine the new product in the different phases. For example, the first contact phase can be illustrated by a picture of a shop.
Some participants suggested using the question tool at a later stage in the design process. However, as soon as the project objectives are defined, it is wise to consider the materials objectives as well. Product designers could prepare themselves by reformulating the questions before the actual meeting with the client.
Revised and Combined Tools
The usability study clearly showed that the current tools can be improved to increase their function. The recommendations for improvement were to combine the tools and to increase communication on sensorial properties. The expected advantage of a combination of tools is that the strengths of each tool can be extended to reach consensus about the key sensorial properties that create the required user-interaction. This section examines the considerations made to integrate the tools (Figure 4).
Figure 4. Ideal order to apply the Materials in Products-selection (MiPS) tools.
The basis for the combined tool is the question tool. In the concept form, the questions for all phases were presented on one sheet of paper. In MiPS, the questions will be separated by phase and presented on cards. The advantage is that the product designers can change the order of the phases more easily with separate question cards. Furthermore, the backs of these cards can also be used. This creates space for a checklist mentioning the sensorial properties of materials. Just as with the picture tool, one side of the card can then be used as a diverging step (the questions) and one side can be used as a converging step (the sensorial properties).
For each phase in the user-product interaction, the picture cards and material samples support discussions about the desired visual and tactile interaction. The picture cards and samples were adjusted such that they can be used in mixed form. Each card with product examples is now also accompanied by a material sample. The set of material samples was thus extended from 11 to 16 samples. The samples represented one of the material characteristics of the products on the cards. To maintain a wide variety of sensorial properties in the sample set, some of the product examples were changed. For example, the product examples of the 'modest' card were changed to be able to add a textile material. Some of the materials suggested in the usability study were added in the new version.
The samples were made the same size as the picture cards (80x60mm), and on the back of each picture card, a fragment of the materials sample was added. The product designer is then provided with a visual clue to the sample and when using the sample, the product designer can find the sample characteristics on the back of the picture card. On the question cards, visual clues are given of the picture cards and samples to motivate the product designers to use them as aids for answering the questions.
In the original version of the tools, a clear converging step was missing. The checklist is an important element of the tool to facilitate the converging step. Using the checklist helps product designers to define the required user-interaction aspects as sensorial properties. Although the sensorial properties are given on the back of the question cards, which already function as a checklist, a separate checklist is provided on which the designers can make notes. The checklist is designed in such a way that there is white space available to make a sketch or take notes. The aspects mentioned on the back of the picture cards can be directly noted on the checklist when using the cards or the samples. Both use the same terms. The importance of this converging step will be stressed in the instructions for the tool.
Conclusions
The three tools in the Materials in Products Selection tool were evaluated in design brief meetings with product designers and clients. The tools were effective in different ways. The picture and question tools led to a high level of consensus between product designers and clients in terms of the desired user-interaction aspects of materials. The question tool did this by directing to the aimed for sensorial properties. Based on these sensorial properties, product designers could effectively start their materials searches. The picture tool was very user-friendly and together with the sample tool stimulates the creativity of both clients and product designers. From our evaluation, the question tool was not viewed as user-friendly or able to promote creativity in its current form.
To optimize the tools, we suggest emphasizing further developments on the converging step of the tools. Although the tools helped product designers in defining user-interaction aspects, they were only able to translate a low percentage of these aspects into sensorial properties. Starting a materials search would thus still be difficult. However, when the tools are further developed as suggested at the end of this paper, product designers can benefit from using the tools when searching for materials.
Acknowledgements
Four students worked together with the authors on this project. Jill Roeloffs and Clemence Simons designed the sample tool. Laura Klauss and Annette Voesenek designed the picture tool. They developed the tools for their 'Practice in design research' course in the Industrial Design Engineering's bachelor program. These students, along with all participants of the study presented in this paper, are acknowledged for their work.
References
- Ashby, M., & Johnson, K. (2002). Materials and design: The art and science of material selection in product design. Oxford: Butterworth-Heinemann.
- Ashby, M., & Johnson, K. (2003, December). The art of materials selection. MaterialsToday, 24-35.
- van Kesteren, I. E. H. (2008). Product designers' information needs in materials selection. Materials & Design, 29(1), 133-145
- Crilly, N., Moultrie, J., & Clarkson, P. J. (2004). Seeing things: Consumer response to the visual domain in product design. Design Studies, 25(6), 547-577.
- Desmet, P. M. A. (2002). Designing emotions. Unpublished doctoral dissertation, TU Delft. Delft, The Netherlands.
- Doordan, D. P. (2003) On materials. Design Issues, 19(4), 3-8.
- Gant, N. (2005). Plastics design - The unlikely pioneer of product relationships. In Proceedings of the 1st International Conference on The Art of Plastics Design (Paper No. 6), Shrewsbury: Rapra Technology.
- Govers, P. C. M. (2004). Product personality. Unpublished doctoral dissertation, TU Delft. Delft, The Netherlands.
- Hekkert, P. (2006). Design aesthetics: Principles of pleasure in design. Psychology Science, 48(2), 157-172.
- Hodgson, S. N. B., & Harper, J. F. (2004). Effective use of materials in the design process - More than a selection problem. In P. Lloyd, N. Roozenburg, C. McMahon, & L. Brodhurst (Eds.), Proceedings of the 2nd International Engineering and Product Design Education Conference (pp. 593-601), Stockholm: The Design Society.
- Jordan, P. W. (2000). Designing pleasurable products: An induction to new human factors. London: Taylor & Francis.
- Likert, R. (1932). A Technique for the Measurement of Attitudes. Archives of Psychology 140, 1-55
- Pasman, G., & Stappers, P. J. (2001). ProductWorld, an interactive environment for classifying and retrieving product samples. In Proceedings of the 5th Asian Design Conference (pp.1-11). Seoul, Korea.
- Roozenburg, N. F. M., & Eekels, J. (1995). Product design, fundamentals and methods. Chichester, NY: Wiley.
- Sanders, E. B. N. (2001). A new design space. Paper presented at the ICSID Conference 2001: Exploring Emerging Design Paradigm, Oullim, Seoul, Korea. Retrived March 1, 2007, from http://www.maketools.com/pdfs/NewDesignSpace_Sanders_01.pdf.
- van Kesteren, I. E. H., Stappers, P. J., & de Bruijn, J. C. M. (2007). Defining user-interaction aspects for materials selection: Three tools. In the Web Proceedings of Nordic Design Research. Retrieved April 1, 2007 from http://www.nordes.org/upload/papers/88.pdf.
- van Kesteren, I. E. H., Stappers, P. J., & de Bruijn, J. C. M. (2006). Product designers' approaches of integrating user-interaction aspects in materials selection. Manuscript submitted for publication.
